Roberto Jacobs / Profile
- Information
|
8+ years
experience
|
3
products
|
75
demo versions
|
|
28
jobs
|
0
signals
|
0
subscribers
|
MQL5 Community:
Programmer + Forex Trader
Product on Market:
Forex Currency Power Index indicator for MT5
https://www.mql5.com/en/market/product/101322
Forex Currency Power Index indicator for MT4
https://www.mql5.com/en/market/product/101328
TrendColorBars
https://www.mql5.com/en/market/product/14715
Programmer + Forex Trader
Product on Market:
Forex Currency Power Index indicator for MT5
https://www.mql5.com/en/market/product/101322
Forex Currency Power Index indicator for MT4
https://www.mql5.com/en/market/product/101328
TrendColorBars
https://www.mql5.com/en/market/product/14715
Roberto Jacobs

Sergey Golubev
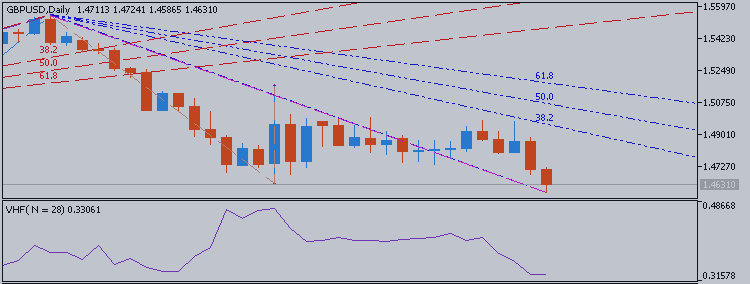

Developed by Adam White and published in August 1991 in Futures Magazine Used for determining whether a market is trending or congested, or about to change from one to the other Useful within a technical trading system to determine which indicators are best-calibrated to the current market...
4
Roberto Jacobs

Sergey Golubev


To understand the cause of a margin call is the first step. The second and more beneficial step is learning understanding how to stay far away from a potential margin call. The short answer as to understand what causes a margin call is simple, you’ve run out of usable margin...
4
Roberto Jacobs

Sergey Golubev
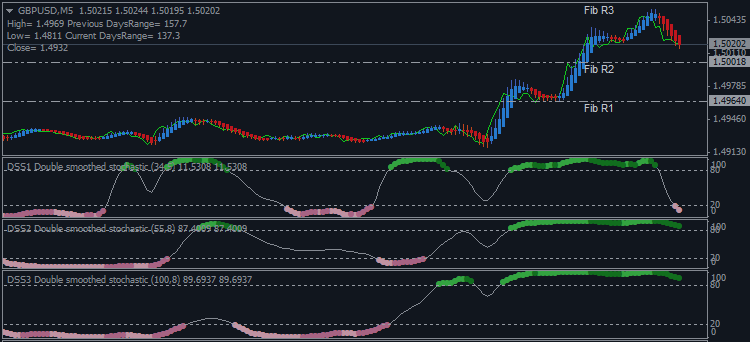

This is simple system namely 3 Stoch MaFibo trading system. This system is using standard indicators in Metatrader and we can use this system to know the market condition and possible future direction of the trend movement, and for trading for example (template files are attached...
3
Roberto Jacobs

Sergey Golubev
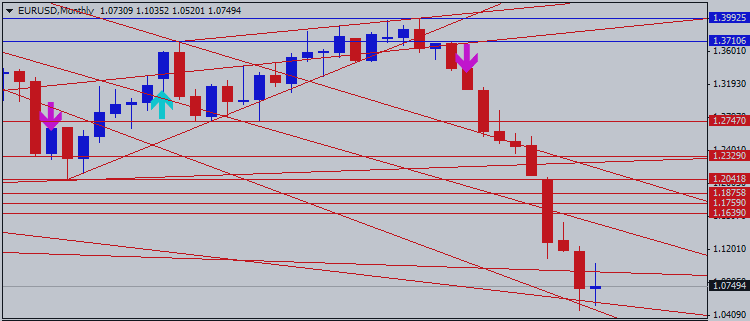

EURUSD monthly price is on primary bearish market condition since the end of last year: MN price crossed Senkou Span A line to be turned from bullish to the bearish in September 2014, and this situation for primary downtrend will remain for the rest of 2015 with some secondary ranging market cond...
3
Roberto Jacobs

Sergey Golubev
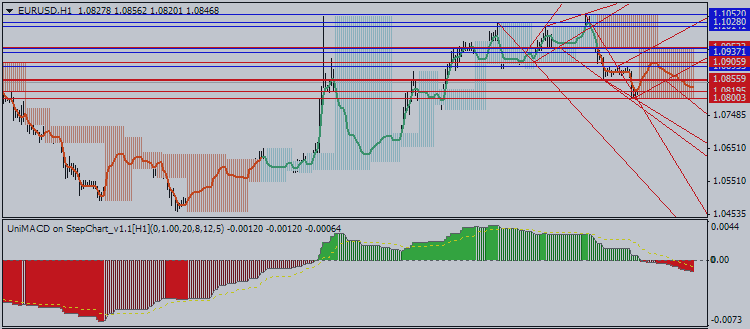

Support and Resistance is one of the concept in Forex trading. The concepts of support and resistance are undoubtedly two of the most highly discussed attributes of technical analysis and they are often regarded as a subject that is complex by those who are just learning to trade...
4
Roberto Jacobs

Sergey Golubev

In today's lesson we are going to combine what we have learned about the current and capital accounts by looking at something which is known as the balance of payments...
3
Roberto Jacobs

Sergey Golubev
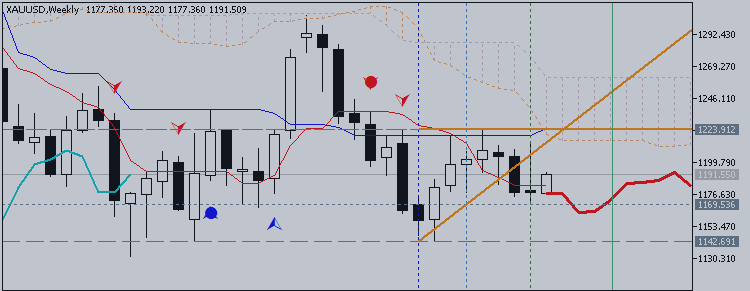

US DOLLAR TECHNICAL ANALYSIS Prices turned higher as expected after producing a bullish Piercing Line candle pattern. A daily close above the 38.2% Fibonacci retracement at 11901 exposes the 50% level at 11951...
3
Roberto Jacobs

Sergey Golubev
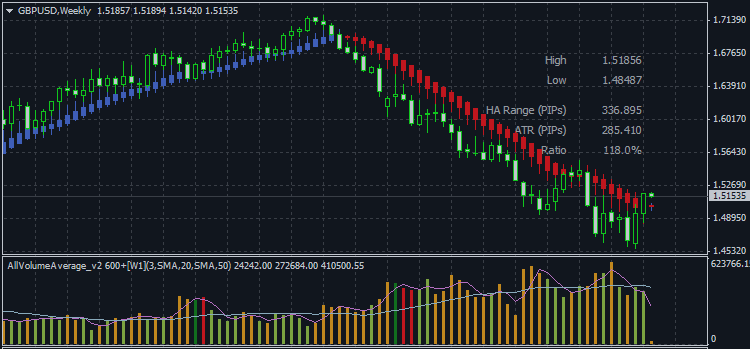

Dynamic Stop Loss It is a good idea to never trade without a hard stop loss unless you are using extremely small position sizes. This is an essential part of controlling risk in Forex trading. The stop loss may be made dynamic, as a way to lock in profits on a trade that progresses profitably...
3
Roberto Jacobs

Sergey Golubev

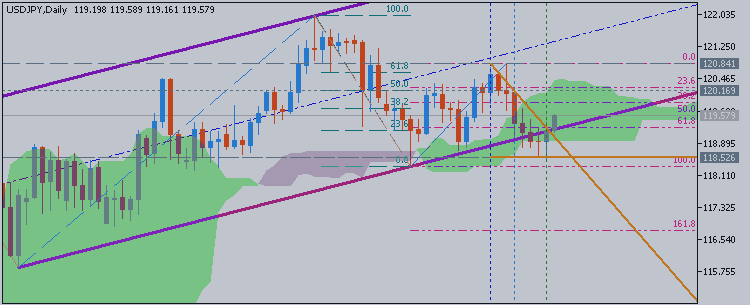
US DOLLAR TECHNICAL ANALYSIS Prices transitioned into digestion mode after bouncing to retest a recently broken rising trend. A daily close above the 23.6% Fibonacci expansion at 12027 exposes the trend line support-turned-resistance at 12058...
4
Roberto Jacobs

Sergey Golubev


The economic outlook if the Fed does not trigger a recession is quite positive and gets better as time goes by. Consumer spending is likely to grow just in pace with the economy. Few consumers are stretching beyond their incomes, and few are withdrawing from spending...
4
Roberto Jacobs

Sergey Golubev

Tenkan-sen line is located above Kijun-sen line of Ichimoku indicator with 122.02 resistance and 118.32 support levels on W1 timeframe for the uptrend to be continuing...
4
Roberto Jacobs

Sergey Golubev
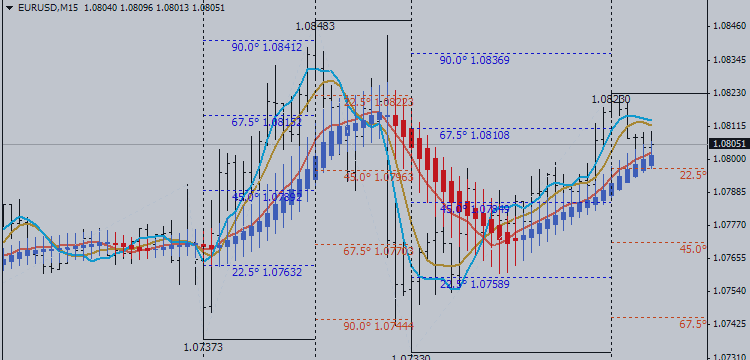

Tenkan-sen line is below Kijun-sen line of Ichimoku indicator on W1 timeframe with 1.0461 support level for primary bearish market condition. AbsoluteStrength indicator and TrendStrength indicators are marking for ranging market condition to be started in the middle of the March for weekly price...
4
Roberto Jacobs

Sergey Golubev


JP Morgan's EUR/USD forecast profile is unchanged this month and continues to show a slower decline for the rest of the year, after an unprecedented -11% drop in Q1. JPM's Quarter-end targets are 1.07 in Q2, 1.06 in Q3 and 1.05 in Q4...
3
Roberto Jacobs

Sergey Golubev
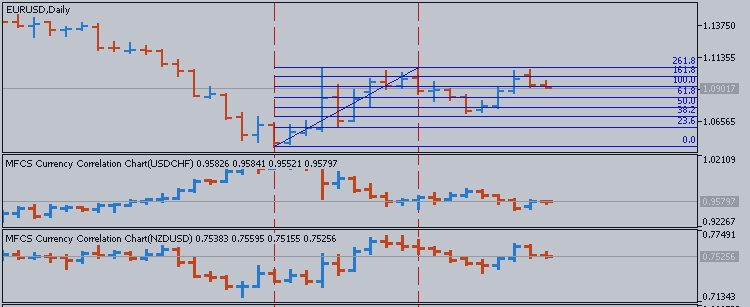

EURUSD correlation with both pairs USDCHF and NZDUSD is very strong. EURUSD holds positive correlation with NZDUSD in an hourly time frame ONLY while it establishes strong negative correlation with USDCHF pair both in an hourly and daily time frame...
2
Roberto Jacobs

Sergey Golubev
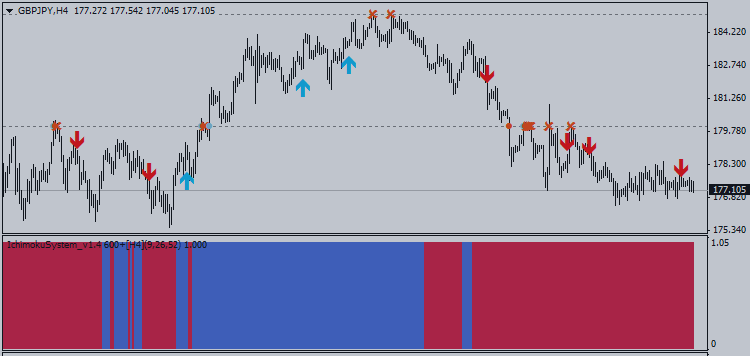

By examining the daily chart of the GBPJPY pair, we easily can notice that the pair has moved aggressively downwards during the previous period after placing a short-term top in the 185.00 regions. The psychological areas of 185.00 intersect with 61.8% Fibonacci of the major decline from 189...
2
Roberto Jacobs

Sergey Golubev


• iPhone Killer: The Secret History of the Apple Watch (Wired) • Renegades of Junk: The Rise and Fall of the Drexel Empire (Bloomberg) • Wall Street Executives from the Financial Crisis of 2008: Where Are They Now...
3
Roberto Jacobs

Sergey Golubev

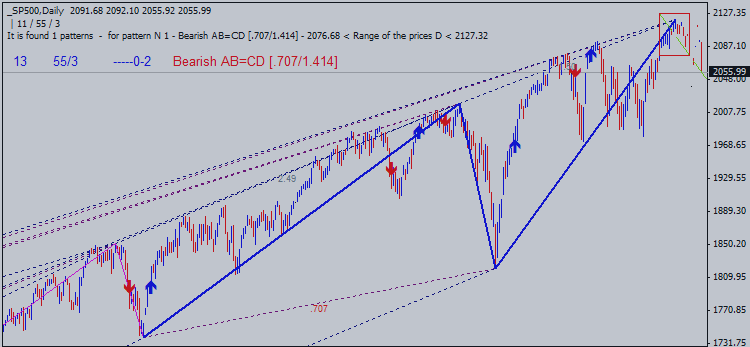
US Stock Market Conclusion, or There are three ways to play a bear market.
30 March 2015, 18:11
Since the beginning of January 2014 stocks have shown signs of institutional selling. This can be seen in the small capitalization stocks index the Russell 2000. This group of stocks generally leads the S&P 500. The chart posted below shows some of my analysis of the SP500 index...
3
Roberto Jacobs

Sergey Golubev
EURUSD Technical Analysis 2015, 29.03 - 05.04: Bearish Ranging Within 1.0551 and 1.1051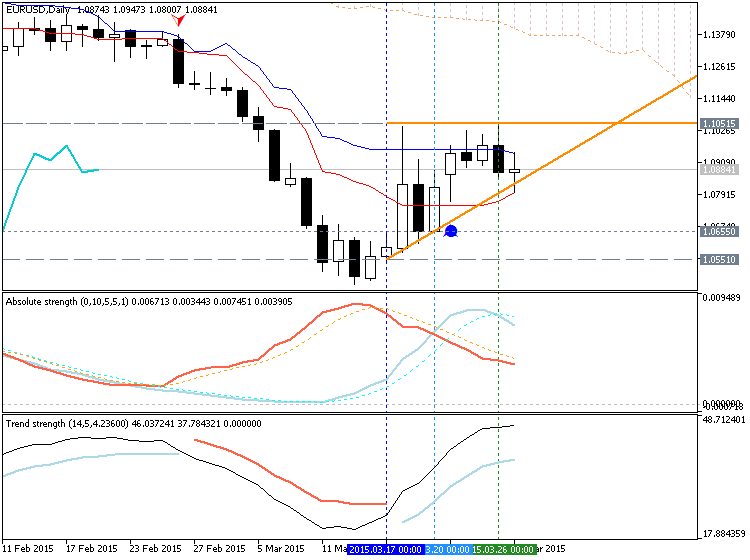
D1 price is on ranging bearish market condition: The price is located below Ichimoku cloud/kumo and far below Sinkou Span A line Chinkou Span line is too far for any possible reversal of the price movement from bearish to the bullish Nearest support

Roberto Jacobs

Matthew Todorovski
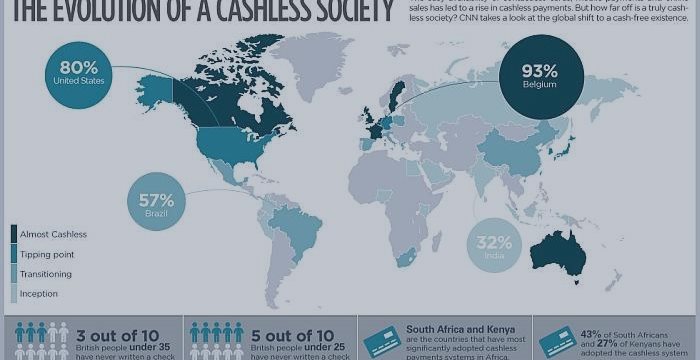

March 24, 2015 Santiago, Chile French paper Le Parisien didn't mince words in the headline: "La chasse au cash est lancee". Basically 'hunting season on cash is launched'...
2
:
