Watch the Market tutorial videos on YouTube
How to buy а trading robot or an indicator
Run your EA on
virtual hosting
virtual hosting
Test аn indicator/trading robot before buying
Want to earn in the Market?
How to present a product for a sell-through
Expert Advisors and Indicators for MetaTrader 4 - 79

What is a tool ? Used for monitoring profit summary in your portfolio, by setting profit target. The tool will automatically close all open orders. When the profits meet the target set. How to use Place the tool on any currency pair, any timeframe and set profit target. Easy... Currency Pair : Any Timeframe : Any Input Parameter Summary profit for auto close all orders ($) Meaning : Input your profit target here. Visit my products Target Profit Magic Target Profit All The Profit Tracker Currenc
FREE

STO Currency Strength Meter DEMO uses Stochastic Oscillator to monitor how strong a currency is, or in other words, if it's being bought or sold by the majority compared to the other currencies. It displays the strength-lines of the currencies of the pair (base and counter currencies of the chart) with changeable solid lines. Also, you can add up to ONE additional currency (only 1 in the DEMO version, in FULL up to 5) to the "comparison pool" that already has the base and the profit (counter) cu
FREE
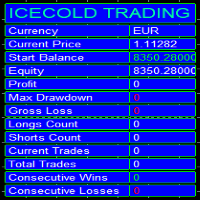
Icecold Trading OSD (On Screen Display) Is very Helpful and easy to use. Try Demo out today!
On Screen Display -Start Balance -Equity -Profit -Max Drawdown -Gross Loss -Longs count -Shorts count -Current Trades -Total Trades
*Know that in the Total Trades, Consecutive Wins & Consecutive Loss columns , those are ALL of the trades your account has done. It does not show 0 when loaded if you have completed trades already in Account History... Just note. To RESET just change Account history per
FREE
The NNFX ALGO TESTER is an tool designed to help the NNFX (No Nonsense Forex) traders develop, improve and test algorithms in a simpler, faster and more accurate way. This software reduces backtesting time from serveral days to only a few minutes! Please download the Demo instead of this Lite version. You can sill use the Lite but this version is now discontinued and it has much less functionality than the full version. The NNFX algo Tester software is too big (in terms of complexity) to be avai
FREE
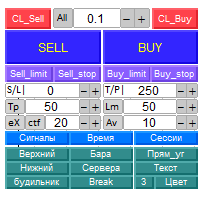
Panel "PanelKjutaMultiTerminalTrial" for trading. It doesn't work on a real account. Opens, modifies, closes and deletes trading and pending orders from the chart using virtual lines, buttons and the active information terminal. Automatically opens an order by indicator levels. Hints in Russian, English or disabled. It has a number of functions for trailing virtual Take Profit lines and limit orders. Displays information on the active information terminal. Hides and includes virtual lines S/L ,
FREE
红黄绿简明指示趋势与震荡指标升级版。 使用红黄绿三色来标示上升趋势 、震荡、下跌趋势。 红色表示空头趋势(下跌)。 绿色表示多头趋势(上涨)。 黄色表示震荡区域。 从黄色转变为红色时,行情可能从震荡转变为下跌趋势。一段连续的红色,说明下跌趋势很强。 从黄色转变为绿色时,行情可能从震荡转变为上升趋势。一段连续的绿色,说明上升趋势很强。 指标的上半部分区域和下半部分区域若同步为红色,表明下跌趋势已经形成共振,接下来大概率走出一段空头趋势。 同时,红绿黄分为上下两部分:
若上下部分同时为绿色,表明上涨趋势已经形成共振,接下来大概率走出一段多头趋势。 若上下部分同时为红色,表明下跌趋势已经形成共振,接下来大概率走出一段空头趋势。
若上下同时为黄色,表明当前行情为震荡。 升级版2.0: 新增两条快慢线。 当慢线(Blue/Red线)为蓝色时,视为多头行情。当慢线为红色时,视为空头行情。 当快线(DarkGray线)从下方向上穿过慢线时,作为参考做多信号,激进交易者可进场做多。反之亦然。
参数可调。 //+------------------------------------------
FREE

-------------------------------------------------------------------------------------------------------------------------------------------------- New version of this product is here : https://www.mql5.com/en/market/product/59924?source=Site+Profile+Seller -------------------------------------------------------------------------------------------------------------------------------------------------- TOTAL TAKE PROFIT & TOTAL TRAILING STOP. Average Take Profit & Average Trailing Stop. Setup TO
FREE

The presented indicator is the author's implementation of the idea embodied in the Alligator indicator, which has already become a classic. The proposed product allows you to visually demonstrate the direction of price movement, temporary price rollbacks and zones of multidirectional price movement. Namely: The indicator lines go up and diverge from each other - a strong bullish trend; The indicator lines go down and diverge from each other - a strong bearish trend; The indicator lines go up but
FREE

Supertrend Moving Average A combination of Supertrend and Moving Average to create a converging trade setup Input parameters: signal mode: set it to true if you want to plug it into STAT (Signal Tester and Trader) arrow shift: distance between fast EMA line to arrow on chart turn on price line filter turn on moving average signal for converging setup k period d period s period averaging method Moving average period Averaging method upper level limit (Stochastic) lower level limit (Stochastic)
FREE

ContiStat restricted - Free DEMO version of the ContiStat indicator
Free version of the indicator is ment as DEMO of full paid version. Full functionality is available, however The indicator work only on M30 chart period . Find the ContiStat indicator for full functionality
Brief description The ContiStat indicator calculate statistic frequency of green (up) and red (down) movement in the chart and determine movement dynamics (silver curve). There are two key parameters to understand the Cont
FREE

This indicator shows ratios between extremes on the chart. You can specify your own ratios (e.g. Fibonacci).
Parameters Most important Density - how much in details to search ratios in extremes. Bigger number means less details, smaller number means more details. Base unit is 1 bar on the chart. History - how far to go in history while searching. When you set -1, the indicator processes all bars from history. Base unit is 1 bar on the chart. Range - how far search ratios from given extreme. Ba
FREE

Trading is about waiting for the right time. This indicator was created to know what is happening on our charts without having to cover the screen with indicators. In addition, it has several types of alerts that allow us to dedicate our time to other things until something interesting happens. You can use multiple alarms at the same time. It is not a problem.
By default AlterAlert offers us alerts when the following indicators give us a signal:
Moving average (MA crosses) Stochastic Oscill
FREE
EA is based on Parabolic SAR and MACD indicator. if there are loss EA try to recover loss and fix position by placing another bigger order. Please test in strategy tester and let me know your feedback Suitable for Beginners No complex settings Just use EURUSD M5 time frame YOU CAN CONTACT ME FOR OPTIMIZATION Please leave the comment your like or dislike I will be happy to answer all kind of query related to this product... Please check in strategy tester and comment like or d
FREE
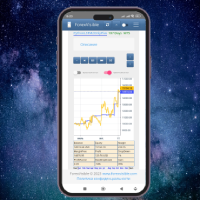
This client utility is intended for sharing and copying signals, as well as for monitoring your Expert Advisor on the site https://forexvisible.com . The Android version of the site can be downloaded here The version for the MT4 terminal can be downloaded here https://www.mql5.com/en/market/product/106509 There are many reasons to use this application in your trading, and these are: 1. If you have many trading advisors and many accounts, it is very difficult to track them and monitor everyt
FREE
TradingDesk Demo – Performance Analyse MT4 This is a Demo version of TradingDesk indicator which is limited to show only EURUSD. Full version can be found here: https://www.mql5.com/en/market/product/40189
TradingDesk analysed MetaTrader 4 historical data by Symbol, Magic Number, Trade or Comment. All these evaluations will be displayed in real time on your MetaTrader 4 chart window.
All this information will be displayed in the following dashboards: account info General information about
FREE

Constructor is a convenient tool for creating, (building strategies) testing and applying trading strategies and ideas, as well as testing and using separate indicators and their groups.
Constructor includes opening, closing, deal tracking, averaging and recovery modules, as well as various trading options with and without averaging and martingale. You are able to connect up to 10 different external indicators. Find the detailed instructions in the attached pdf file.
Trading settings
averag
FREE

Auto risk manager Free is a utility for order management. Regardless of whether the orders are opened manually or by Expert Advisors, the utility removes pending orders (if needed) and disables the terminal (not letting the EAs open new trades) when a specified profit or loss percentage is reached. This demo versions allows you to understand the work of the full version of Auto risk manager . The demo works only with AUDNZD orders only. Profit_Percent and Loss_Percent may have either positive or
FREE

Tester BO and Tester Signal Bar is a script that allows you to test your trading strategies. The tester has two buffers with up / down signals. An example of use can be seen in the screenshots below. Using the indicator tester, you can achieve the maximum ratio of profitable trades for binary options. Improvement for forex is also planned. I wrote the idea at the very bottom in the “Planned work” group. You can filter your signals by the following data: 1- start date analyze. Interval (1 day, 7
FREE

I decided to list it for free. Combined Informer of DeMarker with RSI MTF. Each parameter can be change values in menu. it is good for scalping or for weekly trading and looks as universal fx-toy. Now I use it for BTC, ETH, BNB. In menu you can turn on daily percentage gain info, weekly and monthly gains also included as informers. Short ATR helps to determine when price was slow/stopped and entry for pulse pump/dump. The filter of numbers of RSI can be tuned for overbought/oversold values w
FREE

This a very Simple EA with two take profit level lines TP1&TP2 both lines can be added using a button, incase the lotsize is less than 0.01 the lines will not show
in addition to that the EA has a breakeven function, where it moves the stoploss to entry point once the price reaches TP1 or TP2 , this function is disabled by default
please let me know if you face any issue with this EA
FREE
Trend Note Indicator Suitable for multi time frame market direction prediction. Blue and red color indicate the buy and sell call respectively. Blue indicator is denote buy call and Red indicator denote the sell call. Happy trade!! this indicator is suitable for all time frame, but our recommended time frame to use 1hour and 4 hours, suitable for any chart.
FREE

Edit: Due to non update, i have choosed to make it free. Have fun.
We are proud to present you the new version of our Easy One click trading Panel PRO ================= Active Support === 7 days for refund === Update and many function will be added === =================
Input:
Magic : Set the magic number Horizontal_position : Set the horizontal location Vertical_position : Set the vertical location SoundON : Active/Disable Sound Alert Function:
Enable_IP
FREE

The FxSProWPR oscillator generates signals for trend confirmation, which can also nbe used to confirm the emergence of new trends.
Indicator Parameters NumberBars - the number of bars to display the indicator. Too many bars may significantly slow down the operation of the trading terminal. SignalAlert - an Alert notifying of a trend. SignalSound - sound alert to notify of a trend. The sound will be played once the histogram exceeds the level of 15.
Rules to confirm position entry Green histo
FREE
Binary Options Assistant (BOA) COLD Signals Indicator provides signals based on Amalia Trader Binary Options Strategy. Indicators: Keltner & Stochastic
Stop missing trades, stop jumping from chart to chart looking for trade set-ups and get all the signals on 1 chart! U se any of the BOA Signals Indicator with the Binary Options Assistant (BOA) Multi Currency Dashboard .
All BOA Signal Indicator settings are adjustable to give you more strategy combinations. The signals can be seen vis
FREE

Please note this is a Free version and will only work on EURUSD pair. If you like this product please buy the full EA (FXA Local Trade Copier Pro). FXA LTC is a trade copier for MT4 terminal. This is a fantastic tool for coping trades from one MT4 terminal to many others running on the same PC/VPS. It is extremely easy to setup with minimal settings you can be coping trades in minutes. FXA LTC also caters for Brokers that use different symbol names. FXA LTC will copy trades in 0.5 seconds or le
FREE

A simple Expert Advisor based on the "Top Bottom Price" indicator and Martingale (which can be disabled by changing the "Martingale Multiplier" parameter to the value = 1). The Expert Advisor has been optimized for the EUR/JPY M15 currency pair. There is also an indicator limiting the opening time of transactions "Entry Time". Below are the statistics of testing the Expert Advisor for the EUR/JPY M15 pair over the past 3 years. Default testing parameter Initial balance = 10,000$ Net profit = 19
FREE

This is a Semi Automated OTE EA based on the free teachings of ICT. One of the biggest challenges in trading is related to executing and managing trades. After analyzing charts, draw an OTE Fibonacci and turn on the EA. It will automatically execute orders based on the Fibonacci level of your placement and protect any open positions when in profit. Please review the documentation that accompanies this product.
Auto Lot Calculation Based on Risk Percent
Auto SL and TP
Auto BE
Ris
FREE

The indicator is based on the materials taken from the book: Bill Williams. Trading Chaos: Applying Expert Techniques to Maximize Your Profit. The indicator values at the top of each bar are calculated based on the location of the Open and Close relative to a third of the bar. The bar is divided into three parts. The lower third of the bar is the number three (3), the middle third of the bar is the number two (2), the upper third of the bar is the number one (1). The first number in the indicato
FREE

Super Copier GG Free Super Copier GG Full Version Super Copier GG Full FREE
Super Copier G&G Free (Symbol USDCHF and EURAUD only, Max three order) Expert Advisor copies orders to several trading accounts (regardless of a broker) if their respective MetaTrader 4 terminals are opened on a single PC/VPS. The EA may copy from multiple (unlimited) initial accounts to a single target one or from a single initial account to multiple (unlimited) target ones. The work of other EAs and manual tradi
FREE
List of buttons to switch between symbols on multiple charts 1. Set x, y coordinates (horizontal, vertical) for list of buttons. 2. Show/hide buttons by clicking button or keypress. 3. The number of columns of the button list. 4. The color of the buttons and the color of the current symbol button. 5. The button list is separated by commas. If the list is empty, the indicator takes the list of symbols in the Market Watch. 6. Set the keypress to show and hide the list of buttons. 7. Multiple Char
FREE

The block of bars is collected under condition of convergence . If the convergence conditions are not met, the block is deleted. More precisely, the condition is the transition of the block of bars from the state of convergence to the state of divergence . Blocks are formed selectively with gaps. Gaps are characterized by the state of divergence of bars. Before removing the block, we find the extreme bars inside the block (min, max). The line connects the extreme bars. The line is drawn on
FREE
Velvet MACD is intended for use with the Velvet advanced ordering layer. It is a modified version of the MACD indicator provided by Metaquotes and all of the data it displays is accurate and verified, when it is detected by the ordering layer. In order to place orders with the Velvet MACD indicator, the ordering layer must be installed and running. Ordering from the Velvet MACD indicator requires that "Velvet Ordering Layer" ( found here ), version 2.0 or higher, be installed and running. Whe
FREE

This indicator calculates average speed of moving average indicator. Here is parameters: BarsToProcess - indicator calculating period; MaPeriod - period of Moving Average indicator; AveragingPeriod - period (MA values) of the basis of which the average value is calculated; MA_Method, MA_Apply_to - using to set MA indicator parameters; Thats all! Good luck.
FREE
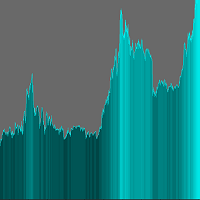
The indicator adds an overlay to the graph to create a histogram.
There are no parameters to set.
On the chart you can choose the color in the upper right corner by clicking on the appropriate brick.
The histogram is shaded depending on the price value.
Remember to set a line chart (shown in the screenshot). ........................... I invite you to purchase.
FREE

Introducing Force Jurik—a powerful indicator designed to enhance trading insights by combining custom moving averages based on Jurik with the MetaTrader 4 indicator, Force Index.
Jurik moving averages are renowned for their precision and smoothness, making them ideal for analyzing price movements in the forex market. They offer traders a reliable method of identifying trends and filtering out market noise, ultimately providing clearer signals for decision-making.
The Force Index, a popular
FREE
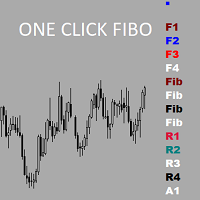
Утилита предназначена для упрощения графического анализа.Настроив один раз , можно сохранить в шаблон,все настройки сохранятся.В настройках меняются уровни фибоначчи , цвета,стили и толщина линий также текстовые метки на кнопках.Есть возможность расширить функционал , добавить временные зоны Фибоначчи ,Фибо арки ,линии по углу ,продление прямоугольных зон до текущей цены.Присылайте рекомендации,все можно осуществить в рамках бесплатной утилиты.
FREE

MP Price Change Indicator is a tool to calculate the price movement by percentage. The Value of this indicator can be adjusted to look back of the percent of price change within certain timeframes. This is a powerful tool when used by other indicators as well, such as ATR and ADR, for understanding price fluctuations and tolerance in different strategies. ___________________________________________________________________________________ Disclaimer:
Do NOT trade or invest based upon the analys
FREE

The risk-to-reward ratio is used for assessing the potential profit (reward) against the potential loss (risk) of a trade. Stock traders and investors use the R/R ratio to fix the price at which they'll exit the trade, irrespective of whether it generates profit or loss. A stop-loss order is generally used to exit the position in case it starts moving in an opposite direction to what a trader anticipated.
The relationship between the risk and reward helps determine whether the potent
FREE
Your feedback is valuable and appreciated.
I appreciate feedback on where the application is weak and what improvements or features would be beneficial.
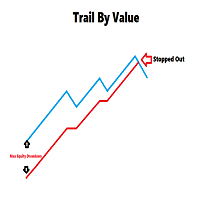
This is a utility for setting trailing stops by value. Trailing stops are great tools for locking in profits as a trade progresses. When trades progress towards potential targets confidence in the trade should be reflected in management of the trade. Market exposure persists for the duration of the trade, and the choice to remain in a trade
FREE

Tool converted from tradingview. A simple indicator that plots difference between 2 moving averages and depicts convergance/divergance in color coded format.
Anything <= 0 is red and shows a bearish trend whereas > 0 is green and shows bullish trend.
Adjust the input parameters as following for your preferred time frame :
4-Hr: Exponential, 15, 30
Daily: Exponential, 10, 20
Weekly: Exponential, 5, 10
FREE
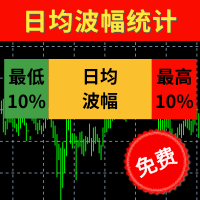
【最低10%】 统计过往100天蜡烛图的波幅并进行排序,最低10%的波幅以点数显示。 【日均波幅】 统计过往100天蜡烛图的平均波幅,并以点数显示。 【最高10%】 统计过往100天蜡烛图的波幅并进行排序,最高10%的波幅以点数显示。 【今日】 今日波幅以点数统计,箭头的位置是今日波幅相对于历史总体波幅的位置。越靠近左侧说明今日波幅越小,越有侧说明波幅越大。 波幅指标最适合用来审视当日距今为止波幅的大小,使用方法如下: 若今日时间尚早而且今日波幅尚较低,说明今日可能行情尚未启动,还有入场机会。 若今日时间尚早但今日波幅已经超过80%,说明今日趋势行情可能已经结束,接下的行情可能反弹。 若今日时间较晚,而且今日波幅已经超过60%,说明今日行情可能已经走完。 当日的止盈点位+当日已完成波幅最好不超过最高10%的波动点数。 当日的止损点位+当日已完成波幅最好超过最高10%的波动点数。 当然该指标是基于过往的100日数据进行统计,并不代表接下来今日的波幅一定不会创新低或者创新高,其作用是给日内交易者的入场时机和日内交易空间提出判断依据。 更多细节请看 http://www.sygdpx.co
FREE

The indicator calculates the angle between the Highs, Lows and Closes of neighboring bars. The angle can be measured in degrees or radians. A linear chart or a histogram is drawn in a subwindow. You can set the scale for the calculation — floating or fixed. For use in the EA, you need to specify a fixed scale.
Parameters Angular measure — degrees or radians. Scale mode for calculation — scaling mode. Free scale — free transformation, the indicator will calculate values each time the chart scal
FREE

The indicator searches for matches in history for a specified range of the latest known oscillated Moving Average data.
Found matches are indicated on the graph as colored fields. Analysis of historical data (the behavior of quotes in history) will help make decisions in trading.
The matches found are updated when a new bar is opened (i.e., the calculation is performed upon opening prices).
The value of the increase accuracy (Accuracy) must be changed with a decrease in the timeframe, and
FREE
This indicator allows to hide Volume (on all MT4 timeframes) from a date define by the user with a vertical line (Alone) or a panel (with "Hidden Candles"). The color of each bar depends if this one is higher or lower of the previous bar. Indicator Inputs: No inputs for this indicator Information on "Volume" indicator is available in this post: https://www.mql5.com/en/forum/134260 ************************************************************* Hey traders!! Give me your feeds! We are a commun
FREE
This indicator allows to hide Bill Williams Fractals (on all MT4 timeframes) from a date define by the user with a vertical line (Alone) or a panel (with "Hidden Candles"). Indicator Inputs: Indicator Color Indicator Width Information on "Fractals" indicator is available here: https://www.metatrader4.com/en/trading-platform/help/analytics/tech_indicators/fractals ************************************************************* Hey traders!! Give me your feeds! We are a community here and we hav
FREE
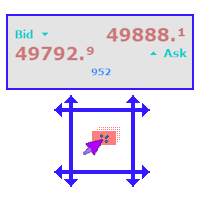
A simple and functional Current Price Panel, which shows magnified Bid, Ask and spread price and can be moved by using the mouse, to any location of the chart window. The functionality included are: Customize Current Price Panel Width and Height, Row and Column gap. Background color, background transparency and border color. Font, its size and color. Move the panel to any location of chart window. Option to show current spread as pips or points. Highlight spread in different color if it crosses
FREE
Real-time spread tracking and monitoring software
Displays spread values in form of histograms on current timeframe of chart Convenient for analyzing spread changes, as well as for comparing trading conditions of different brokers By placing on desired chart, the spread changes at different trading times are displayed
Additionally Fully customizable Works on any instrument Works with any broker
FREE

Spread Data tool will display current spread and average spread. It will record spread for every hour (from 0 to 23) and can give better data about your broker spread. Run it for 2 days or more to get better spread data . Every spread smaller than MinSpread will be recorded as MinSpread Every spread larger than MaxSpread will be recorded as MaxSpread It help to decide what spread to be used when do backtest, EA spread settings, EA that trade in specific time interval, especially for scalping EA
FREE

This is a trend following indicator that identifies optimal entry points in the direction of a trend with an objective stop loss to manage the trade. The indicator allows you to catch trend early and ride it. The Indicator draws resistance line as it detects an Uptrend and draws support line when it detects a Downtrend on the chart. When those levels are broken, that allows you to identify the Trend Direction and Momentum in the direction of prevailing trend which offers optimal entry points in
FREE

The script automatically downloads historical data for all instruments from the "Market Watch" window, on all timeframes from M1 to MN1. It is recommended to use the script before launching multi-symbol and multi-timeframe indicators that work simultaneously with many instruments. Features: To download quotes, the script uses the MQL API only. This is a necessary requirement for publishing programs on the MQL-Market. This method is fast enough, but effective in not all cases. A more reliable (bu
FREE
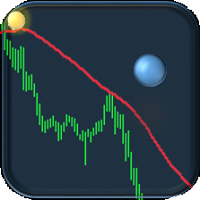
If you are tired of trading, why not have a little fun right in the MT4 terminal? Try this game, the rules are simple - you need to control the ball and take a coin. The ball jumps along the line of the moving average, and it is controlled by arrows or the keys "w a s d". Try to keep the ball from falling out of bounds. There are several levels of difficulty, if at first it’s difficult, you can set a simple level, and when you train, increase difficulty.
When adding a game to a window with a
FREE

This is an original trend indicator. The indicator draws three lines in a separate window. Its values vary from -1 to +1. The closer the indicator is to +1, the stronger is the ascending trend. The closer it is to -1, the stronger is the descending trend. The indicator can be also used as an oscillator for determining the overbought/oversold state of the market. The indicator has one input parameter Period for specifying the number of bars to be used for calculations.
FREE
The script sets Fibonacci levels on the chart using maximums and minimums visible on the chart. The script names Fibo with such timeframe on which it has been launched (Fibo D1 or Fibo M30, etc.), therefore preserving previously constructed levels on different time charts. This instrument will be useful for those who start studying Fibonacci levels and those who need to form these levels in a speedy fashion. The script does not have additional settings. Fibonacci lines can be amended in standard
FREE

Utility for show on charts the visual informations about: - a vertical line at start of each bar of selected timeframe - a vertical line at start of each day - a vertical line at start of each week - vertical lines at start / end of trading sessions selected - bid / ask prices, spread, money value for each point (of 1 standard lot) and last tick time recived" You can enable / disable each information and set the color for each line
FREE

DATE VERSION DESCRIPTION OF CHANGES 2022-08-31 1.00 Initial release. 2022-09-01 1.01 (on the Indicator dialog, but is v1.1 on MQL5.COM) Fixed New York active time 2022-09-03 1.02 (on the Indicator dialog, but is v1.2 on MQL5.COM) Fixed Sydney active on Saturday This indicator will show the active and inactive trading sessions as well as set global variables as whether the trading session is active (1) or inactive (0). Using the iCustom library function, you can invoke this indicator fr
FREE
Indicator that displays the current price and the percentage of loss or gain, compared to the previous day.
The benefits you get : Possibility to choose your favorite crosses. Never redesigns, does not retreat, never recalculates. Works on forex and CFD, timeframe from M1 to monthly. Easy to use.
Parameters : FontSize = 20; font size FontType = "Tahoma"; character type Angle = Bottom_Right; angle view (top right .. top left sect ..) Show_Price = true; view the Bid Show_Var = true; see the d
FREE

A simple risk management tool that closes all open orders if equity drops by a specified percentage. This tool is useful if you are running multiple EAs and multiple charts and pairs in order to control your risk. All orders will close accordingly. Once it hits specified percentage drawdown the closing of all orders cannot be stopped. The EA will reset once all orders are closed, until account equity drops again relative to account balance. Use at your own risk. This is only for MT4. There is o
FREE

The implementation of the impulse system described by Dr. Alexander Elder. The indicator generates signals according to the following pattern: Moving average and MACD histogram increase - green bar, it is forbidden to sell; Moving average and MACD histogram have different directions - gray (or empty) bar, the ban is removed; Moving average and MACD histogram decrease - red bar, it is forbidden to buy.
Indicator Parameters EMA - period of the indicator's moving average MACD Fast - period of the
FREE

Deals Utility is designed to manage any opened and pending order. It can handle orders by adding SL/TP, Trailing or Breakeven.
How to use Apply this Utility to any chart and set input parameters at your discretion. When you open any Market or Pending order, this utility adds SL/TP immediately. It will not process any order with magic number, so other EA's can work with this. It will manage Forex, Metal and Energy symbols. Other EA's can work with this because it will not handle any order with
FREE
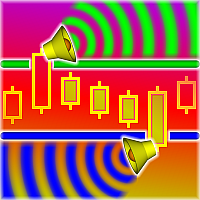
Welcome. This indicator is for alarming the trader by sound when Symbol's price goes above or below certain level(s). It doesn't do any trading. Setting the levels is very handy, you just drag them with the mouse on the chart. You can customize the sounds the Indicator alarms you by (may be useful for office with a number of the terminals running). Also, this product includes an auxiliary Windows application that makes the usage even more handy. This product includes 4 parts: Sounder_TopBottomLe
FREE

The indicator plots an affine chart for the current instrument by subtracting the trend component from the price. When launched, creates a trend line in the main window. Position this line in the desired direction. The indicator plots an affine chart according to the specified trend.
Input parameters Maximum number of pictured bars - the maximum number of displayed bars. Trend line name - name of the trend line. Trend line color - color of the trend line. Black candle color - color of a bullis
FREE

SpreadLive shows the full Spread history of a chart with different colors. It alerts you (MT4, E-Mail and Mobile) when the spread reaches the limit, which you can define in the settings. The menu contains Current Spread , Average Spread and Highest Spread of current chart. The main idea is to use it with an EA and analyze negative profits from the spread history. This helps you to see how your broker varies the spread.
Inputs Spread limit - limit to alert. Type - Show in points or pips. Alert:
FREE

Non-proprietary study of Joe Dinapoli used for overbought/oversold evaluation. Uses of Detrended Oscillator indicator Profit taking. Filter for market entry technics. Stop placement. Part of volatility breakout pattern. Determining major trend changes. Part of Dinapoli Stretch pattern. Inputs lnpPeriod: Perid of moving average Method: Calculation method ********************************************************************************* If you want to know market Overb
FREE

Binary Options Pal Studio is analytical tool for constructing a profitable Binary Options trading strategy, combining technical data and money management systems.
Features Most of indicator parameters are optimizable for best win rate or simulated balance, generating best possible outcome. Daily, hourly ITM statistics are displayed on interactive dashboard, every day of the week and hour can be switched to set up specific time patterns. Trade size, payout, spread and money management systems (
FREE
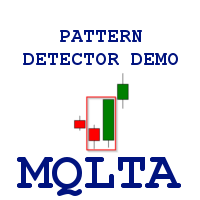
Pattern Detector can detect the most common 1, 2 and 3 candlestick patterns and send notifications when detected. The DEMO version only works on AUDNZD pair. Full product can be found https://www.mql5.com/en/market/product/29190
How does it work Add the indicator to the chart you want to analyze and select which patterns to detect, the indicator will draw the detected patterns. You can also be notified via alert, app and email when a new pattern is detected.
Parameters Indicator Name - Used
FREE

Very usefull expert advisor for ichimoku kinko hyo indicator. this expert advisor will notify you whenever there is a cross over/below the clouds or tenken sen /kijun crossing. All Ichimoku traders know the importance and valuable signals when crosses done below or above the clouds or tenkan and kijun crosses. Now you will be alerted quickly to make benefits from the markets This will help you to be alerted for possible trade action. it will simplify your chart observation and be notified wtith
FREE

The indicator detects market efficiencies and inefficiencies by studying price movements and marks candles where the best efficiencies occurred. The most 'efficient' candles are indicated with a vertical bar histogram. Taller bars represent these candles. The highs and lows of these candles are supply and demand areas, important levels that will be retested in the future. It can be used on all time frames with the same settings.
FREE

TLM Map AM (Trend Line Momentum Map) is an indicator developed based on a set of digital technical analysis indicators described in the article by Vladimir Kravchuk: " Digital indicators in the technical analysis of financial markets ". The indicator displays in a separate window a complex of digital technical analysis indicators such as FTLM and STLM. Recommended for use in conjunction with the RTL Map AM (Reference Trend Line Map) indicator. The indicator has no customizable parameters.
FREE
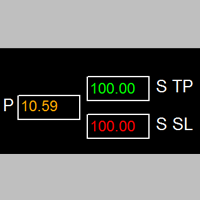
如果产品有任何问题或者您需要在此产品上添加功能,请联系我 Contact/message me if you encounter any issue using the product or need extra feature to add on the base version.
Session TakeProfit StopLoss is basically helping to set the take profit and stop loss in dollar for the total open orders (session). Once the total profit is greater than session_tp or less than session_sl, the EA will help to close all open orders acting similarly to a take profit/stop loss for a single order.
Inputs session_tp: session take profit s
FREE

This EA automatically closes all Open Trades and Pending Orders at your specified Net Profit or Net Loss. The TP and SL for a single trade can easily be set in Meta Trader, on individual basis and on hitting that TP or SL, the trade is automatically closed. However, if you have multiple trades and you want to set a Net TP and Net SL (in terms of profit & loss) for all of them, then Meta Trader cannot help you. Here comes this EA “Net TP Net SL Setter” using which you can set a Net TP and Net SL
FREE
The MetaTrader Market offers a convenient and secure venue to buy applications for the MetaTrader platform. Download free demo versions of Expert Advisors and indicators right from your terminal for testing in the Strategy Tester.
Test applications in different modes to monitor the performance and make a payment for the product you want using the MQL5.community Payment System.
You are missing trading opportunities:
- Free trading apps
- Over 8,000 signals for copying
- Economic news for exploring financial markets
Registration
Log in
If you do not have an account, please register
Allow the use of cookies to log in to the MQL5.com website.
Please enable the necessary setting in your browser, otherwise you will not be able to log in.