Watch the Market tutorial videos on YouTube
How to buy а trading robot or an indicator
Run your EA on
virtual hosting
virtual hosting
Test аn indicator/trading robot before buying
Want to earn in the Market?
How to present a product for a sell-through
Technical Indicators for MetaTrader 4 - 7

A laser sharp and very affordable indicator FOR BEGINNERS AND EXPERTS ALSO AND YOU CAN TRADE THE ZONE BY SIMPLY PRESSING IT! Draws fresh, tested, broken, old, and nested zones up to 3 higher timeframes, and sends Alerts if the zones are touched , entered , or broken, or reversal candle is leaving the zone! NO REPAINT!
After purchase leave a comment or a review and i will send you the user manual and EA designed for the indicator This indicator is using multitimeframe data and chart interacti

Or B ermaui A verage C onvergence D ivergence Cloud , which is an oscillator that shows trend direction and measures its strength in percent. BACD Cloud calculation is as follow: 1- Calculate two exponential moving average. One of them is faster than the other. I will call the first (Fast) and the second (Slow)
2- Find the center between them, where: Center MA = (Fast + Slow) / 2
3- Calculate BACD Line as follow: BACD = 100 * (Fast / Center MA)
4- Calculate the BACD Signal Line, which i

It identifies the pivot, support, and resistance price levels of the selected timeframe and then draws lines onto the chart. FEATURES: Option to specify the Timeframe Period in the PivotSR calculation. Option to display the PivotSR of the last candle, of every candle, or of the current candle. Options for displaying labels, line thickness, and line color. PivotSR can be interpreted as reversal levels or past price reactions that can be used as the basis for current price analysis. Some traders b
FREE

MT5 version | FAQ | EA Universal Breakout Universal Box plots price ranges on the chart which can be used later to trade on a price range breakout. There are many strategies with which you can apply this indicator. The indicator is set by default to mark Asian, European and American trading session ranges on the chart. Ranges are plotted as rectangles, the boundaries of which are the beginning and end time of the trading session, and the levels of maximum and minimum prices for that period.
FREE

The Inversion Fair Value Gaps (IFVG) indicator is based on the inversion FVG concept by ICT and provides support and resistance zones based on mitigated Fair Value Gaps (FVGs). Image 1
USAGE Once mitigation of an FVG occurs, we detect the zone as an "Inverted FVG". This would now be looked upon for potential support or resistance.
Mitigation occurs when the price closes above or below the FVG area in the opposite direction of its bias. (Image 2)
Inverted Bullish FVGs Turn into P
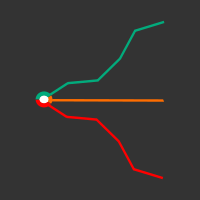
The Spread Ratio indicator allows you to view the ratio between the value of one instrument and another in order to operate with spread trading techniques.
In the image we can see an example of the Spread Ratio indicator on the Brent Oil and Crude Oil instruments. As we see from the image, the Spread Ratio indicator shows the trend of the ratio between these two instruments, allowing us to grasp the misalignments and realignments of the prices.
It is also possible to combine the Spread Rati

BUY INDICATOR AND GET EA FOR FREE AS A BONUS + SOME OTHER GIFTS! ITALO VOLUME INDICATOR is the best volume indicator ever created, and why is that? The Indicator works on all time-frames and assets, indicator built after 7 years of experience on forex and many other markets. You know many volume indicators around the internet are not complete, does not help, and it's difficult to trade, but the Italo Volume Indicator is different , the Italo Volume Indicator shows the wave volume, when market

Was: $49 Now: $34 Blahtech Better Volume provides an enhanced version of the vertical volume bars. Each bar is compared to the previous 20 bars. Depending on its volume, range and volume density it will be assigned a state and colour. Low Volume – Minimum volume High Churn – Significant volume with limited movement Climax Neutral – High volume with unclear direction
Climax Up – High volume with bullish direction Climax Dn – High volume with bearish direction Climax Churn – High vol

It predicts the most likely short-term price movement based on advanced mathematical calculations.
Features Estimation of immediate price movement; Calculation of the real market trend; Calculation of the most important support and resistance levels; Algorithms optimized for making complex mathematical calculations with a minimal drain of system resources; Self-adjusting for better performance, so it’s able to work properly at any symbol (no matter how exotic it is) and any timeframe; Compatib

MT5 Version SMT Divergences MT4
SMT Divergences is one of the most innovative indicators in the market. It offers the possibility of analyzing price divergences between 2 pairs. These divergences highlight and help to foresee what banks and institutions are planning to do. SMT divergences also provides you with a kill zones indicator and the possibility of filtering divergences occurring during these kill zones. The strategy tester is limited in MT4. Contact the author to get your Demo Version

Discover where large institutions are trading and optimize your investments with the Free Anchored VWAP Indicator for MetaTrader 4. Find out the price where large institutions are making trades with our Free Anchored VWAP Indicator for MetaTrader 4! Now you can save your valuable time by automating the plotting of your anchored VWAPs at market tops and bottoms. Our free version allows you to easily view the VWAP in real-time by following the mouse pointer on the chart. With this, you can instant
FREE
The Omega Trend Indicator is an advanced tool that has been specifically designed to detect market trends early, and follow them efficiently. The indicator draws two lines. The main (thicker) Trend Line represents the presumed lower or upper volatility limits of the current market trend. A break in the main Trend Line indicates a potential reversal or shift in the movement of the trend. The Trend Line also indicates the best point to place a stop loss order. In Omega Trend Indicator, the Trend L
FREE

The Katana indicator works like a charm with our other indicator called Trend Forecasting . When you have these 2 indicators, you can use an extraordinary strategy that we provide to you after purchase. Katana is a follow the trend indicator that sends you buy & alert signals. There is several possibilities on how you can use it. 1st Possibility: When market goes above middle line, it's a buy signal. When market goes below middle line, it's a sell signal. You can use it everyday for your ma

Professional Histogram ( PH ) is a highly efficient and reliable tool for trading Forex, CFDs and binary options. PH is easy to use and configure both for beginners and experienced traders. Unlike most indicators, Professional Histogram finds longer trends and gives fewer false signals. When a buy or a sell signal appears, an alert is triggered allowing you to open a position in a timely manner and avoid sitting at your PC all the time. Professional Histogram for the MetaTrader 5 terminal :
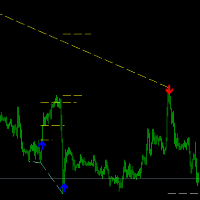
Stock! Now there is a special price for the first 10 buyers. Hurry up. Divergence HiLo is an indicator that identifies highs and lows prices (High end Low) . Based on a special algorithm, the indicator determines the value of divergence or convergence. In addition to divergence or convergence values, the indicator determines the expected take levels profit. The price chart shows divergence lines, possible profit levels and arrows that indicate the formed signal of the indicator in buy or sell.

This simple, yet powerful indicator is very good way to determine actual S/R levels. It's main purpose is making your overview on markets much better.It has built-in arrow signal system, which should be used along with MT indicators for best results.Just try it.
Recommended MT indicators to use along:
Bollinger Bands (default) RSI (period 3, levels 10/90)

Contact me for instruction, any questions! Introduction Triangle chart patterns are used in technical analysis , which is a trading strategy that involves charts and patterns that help traders identify trends in the market to make predictions about future performance.
Triangle Pattern Scanner Indicator It is usually difficult for a trader to recognize classic patterns on a chart, as well as searching for dozens of charts and time frames will take time, and there is also a possibility of a
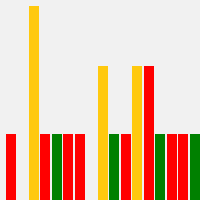
I'm excited to introduce you to the fifth bar on Martin Armstrong's Forecast Array - The Trading Cycle .
This innovative tool represents a transverse form of cyclical frequency analysis, offering a unique perspective on market trends.
The model employs a color-coded system for easy interpretation. In this model, green signals the ideal timing for highs, red indicates ideal lows, and yellow signifies a convergence of highs and lows occurring simultaneously. This intuitive approach allows
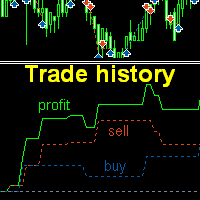
The indicator plots charts of profit taken at the Close of candles for closed (or partially closed) long and short orders individually. The indicator allows to filter orders by the current symbol, specified expert ID (magic number) a nd the presence (absence) of a substring in a order comment , to set the start time and the periodicity of profit reset (daily, weekly or monthly) to calculate the profit chart. The indicator also displays the floating (not fixed) profit of the opened orders at the

Contact me after payment to send you the user manual PDF file. Introduction Introducing the Wolfe Pattern Indicator, a powerful tool designed to help traders identify and capitalize on the elusive Wolfe Pattern in financial markets. This innovative indicator uses advanced algorithms to scan for the Wolfe Pattern in all symbols and time frames, providing traders with a unique edge in the market. How to trade with the Wolfe Pattern The Wolf Pattern is a rare and lucrative trading opportunity that
Great news from today you can test indicator within1 week absolutley for free! FREE version of indicator https://www.mql5.com/en/market/product/41465 We present you an indicator - Insider Scalper by LATAlab developed by the LATAlab team, that allows you to bring scalping trading to a whole new level of quality! With our strategy you can: Insider Scalper by LATAlab displays a hidden tick chart that is not available in the basic tools of the terminal. Automatically detects and draws strong level

The Identify Market State indicator allows you to set the beginning of a new trends and pullbacks on an existing trend. This indicator can be used both for trading on scalper strategies and for long-term trading strategies. The indicator is based on the 14 periodic DeMarker indicator and the 8 periodic simple moving average from this indicator. Statistical studies have shown that the sharp peaks of the DeMarker indicator curve when they drop below its minimum li

Multi-currency and multi-timeframe indicator MACD. The dashboard can display both the Traditional (true) MACD and the MACD which is built into MetaTrader. On the panel you can see the current state of the indicator — the direction of movement of the MACD lines, their intersection and a pop-up window with the indicator chart. In the parameters you can specify any desired pairs-symbols and timeframes. The scanner can also send notifications about lines crossing each other and about lines crossing

This indicator identifies and displays zones, as it were areas of strength, where the price will unfold. The indicator can work on any chart, any instrument, at any timeframe. The indicator has two modes. The indicator is equipped with a control panel with buttons for convenience and split into two modes. Manual mode: To work with manual mode, you need to press the NEW button, a segment will appear. This segment is stretched over the movement and the LVL button is pressed. The level is displayed

The indicator automatically draws the Fibonacci levels based on ZigZag indicator, Trading Sessions, Fractals or Candles (including non-standard timeframes: Year, 6 Months, 4 Months, 3 Months, 2 Months) ( Auto Fibo Retracement ). You can choose any higher time frame for Fibonachi calculation.
The levels are redrawn every time the current bar closes. It is possible to enable alerts when crossing the specified levels. You can also analyze levels in history. To do this, it is necessary to specif

"SOLVE ALL YOUR PROBLEMS FOREVER WITH THIS UNIQUE TRADING SYSTEM!" Buy Trend Reversing PRO Indicator And You Will Get Forex Trend Commander Indicator for FREE !
The one who makes money from the forex market, wins by doing something very simple, he wins 6 out of every 10 trades. Of course for this you need a good indicator and proper money management if you ever hope to become a profitable trader. Anyone who doesn't do so ALWAYS ends up empty handed! Because, I'll say it again: "Traders who don

This dynamic indicator allows you to measure retracements of price between any two points in either direction. It displays the price points, percentages and also displays the extension levels.
User may Modify and Add addition levels and extensions." User may also Add multiple Fibonacci indicators on the chart and change their colors, style and sizes.
Can be used on any timeframe.
This is the only Fibonacci Tool you'll need to measure and trade on Structure.
MT5 Version Available as we
FREE

Индикатор строит блоки заказов (БЗ) по торговой системе (ТС) Романа. Поиск блоков осуществляется одновременно на двух таймфремах: текущем и старшем (определяемым в настройках). Для оптимизации и игнорирования устаревших блоков в настройках задается ограничение количества дней в пределах которых осуществляется поиск блоков. Блоки строятся по правилам ТС состоящем из трех шагов: какую свечу вынесли (что?); какой свечой вынесли (чем?); правило отрисовки (как?).
FREE
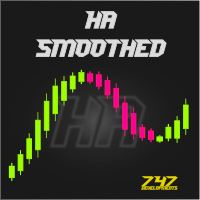
FREE Heiken Ashi Smoothed indicator is fully adjustable, easy to use and comes with possibility to access the indicator via iCustom function so you can use it in your own trading software. Indicator can also pop up alerts when signal changes or send push notifications. For Metatrader 5 version click here: https://www.mql5.com/en/market/product/70825 For detailed information click: >>HERE<< Features
Easy to use Accessible via iCustom Fully adjustable Alerts and Push notifications Possi
FREE

Big summer sale. Save up to 40% on my products. ADR dashboard - save 9$! The intention of the dashboard is to provide a quick overview of the daily, weekly and monthly range of configured assets. In "single asset mode" the dashboard shows you possible reversal points directly in the chart, thus making statistics directly tradable. If a configured threshold is exceeded, the dashboard can send a screen alert, a notification (to the mobile MT4) or an email. There are various ways of using this inf

In the "Masters of Risk" trading system, one of the main concepts is related to places where markets change direction. In fact, this is a change in priority and a violation of the trend structure at the extremes of the market, where supposedly there are or would be stop-losses of "smart" participants who are outside the boundaries of the accumulation of volume. For this reason, we call them "Reversal Patterns" - places with a lot of weight for the start of a new and strong trend. Some of the imp

Was: $69 Now: $34 Blahtech VWAP - Volume Weighted Average Price (VWAP) is the ratio of price to total volume. It provides an average price over a specified time interval. Links [ Install | Update | Documentation ] Feature Highlights
Configurable VWAP Line Sessions, intervals, anchored or continuous Previous day settlement line Standard Deviation bands Alerts at bar close or real time Automatic Broker or Tick volumes Significantly reduced CPU usage
Input Parameters
Expert Advis

Calculation of Lot Size for many traders is a big challenge.
A case that is very important in money management. What many traders ignore.
Choosing an appropriate Lot Size in trades can improve results and it will ultimately lead to success.
This indicator calculates the authorized Lot Size for your trades.
The indicator uses the following values to get the appropriate Lot Size for positioning:
The distance of Stop Loss.
The Pip Value.
The amount of Risk Allowed For Each Trade.
T
FREE
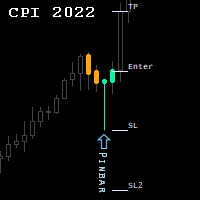
Candlestick Patterns Indicator.
NEW! FREE Candlestick Patterns Expert Advisor > https://www.mql5.com/en/market/product/105634?source=Site +Profile
The Indicator draws colored candlestick patterns, their description and future levels of Stop Loss / Take Profit. Combined with other market analysis, can greatly improve trading results. Indicator can be highly customized by the user including change of colors, fonts, levels, candle sizes etc...
developed, tested and optimized on " VantageM
FREE
This is an Elliot Waves Indicator Arrow for Major Swing's On default settings i have tested this on all Major 28 pairs and i have had great results Check out the comments section for more pictures and details. AFTER PURCHASE PLEASE WRITE A COMMENT SO I CAN SEND YOU Your Free GIFT
(Includes NON REPAINT VERSION OF SIGNAL)
you have a few options of placement and a few different options for colors. this is a very simple and effective signal.

Renko, Heiken Ashi, Ticks Bar, Range Bar. Easy switching, easy setup, all in one window. Place the Custom Chart indicator and view Renko, Heiken Ashi, Tick bar, Range bar charts in real time at real chart. Position the offline chart window so that the indicator control panel is visible. Switch the chart mode by click of a button. Connect to the output chart any indicator, expert advisor without any restrictions. No, it doesn't work in the tester. Yes, you can use an

Connect Indicator is a tool used for connecting indicators between the MQL market and MT4. The connected indicators are made by our group and can be used for other applications, such as sending messages to the Line application or Telegram application. If you have any questions, please don't hesitate to ask us to receive support. Function and indicator buffer Buffer one is the high price of the previous candle. Buffer two is the high price of the previous candle. Usage To connect indicators to fu

The indicator returning pivot point based trendlines with highlighted breakouts . Trendline caculated by pivot point and other clue are ATR, Stdev. The indicator also includes integrated alerts for trendlines breakouts and foward message to Telegram channel or group if you want. Settings · Lookback bar: Default 200 is number of bar caculate when init indicator. · Length: Pivot points period · Slope Calculation Method: Determines how this lope is calcula

The BB Reversal Arrows technical trading system has been developed to predict reverse points for making retail decisions.
The current market situation is analyzed by the indicator and structured for several criteria: the expectation of reversal moments, potential turning points, purchase and sale signals.
The indicator does not contain excess information, has a visual understandable interface, allowing traders to make reasonable decisions.
All arrows appear to close the candle, without redr
Super Trend Pro Its simple. as you see in product picture you can find out how it work. We Use Several MA and use Statistics and Probability inside the code to draw nice, great and pure Trend Detection. Do you like it? Yes me too Here, Super trend pro with 100% non-repainting indicator
Input Parameter is clear and simple.
Inputs Period 1 --------------------------->>>> Use for mathematical calculating
Period 2 --------------------------->>>> MA Period
Indicator Type ------------------->>>>
FREE
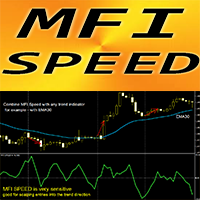
Forex Indicator "MFI Speed" for MT4 The calculation of this indicator is based on equations from physics . MFI Speed is the 1st derivative of MFI itself Money Flow Index (MFI) is a technical oscillator which uses price and volume data for identifying oversold and overbought zones
MFI Speed is good for scalping momentum entries into the direction of main trend Use it in combination with suitable trend indicator , for example standard EMA (as on pictures) MFI Speed indicator

PTS - Divergence Buy Finder by Precision Trading Systems
Precision Divergence Finder was designed to find market bottoms with pinpoint accuracy and frequently does so. In technical analysis, the art of picking bottoms is generally much easier than picking tops this item is designed precisely for this task. After a bullish divergence is identified then it is wise to wait for the trend to turn up before buying. You can use a 10 or 20 bar high to enter or a moving average 15-30 to be rising to id

This strategy is best used for Trend based trading. While market is trending, price still makes smaller ranges. Darvas boxes show breakouts from these small ranges, while still following the original market trend. Detailed Description:
https://www.mql5.com/en/blogs/post/747919
Features:
- Check Darvas Box Breakout - Check Price Above/Below MA or Darvas Box has crossed MA - Min, Max Box Height - Max Distance Between Entry Price and Darvas Box - NRTR Trend Check - Heiken Trend Check - MA Slo

Arrow indicator with trend filter. Generates trend input without delays or delays - on the emerging candle. Suitable for use on any trading tools and timeframes. Easy to use, contains the direction of the trend in the form of a histogram lines and signal generator.
Input parameters
Period Trend Line - Period of the Histogram Line Signal Generator Period - If the period is longer, then the arrows are less Play sound Display pop-up message Send push notification Send email Sound file signal -
FREE

Pivot trading:
1.pp pivot
2. r1 r2 r3, s1 s2 s3 Necessary for traders: tools and indicators Waves automatically calculate indicators, channel trend trading Perfect trend-wave automatic calculation channel calculation , MT4 Perfect trend-wave automatic calculation channel calculation , MT5 Local Trading copying Easy And Fast Copy , MT4 Easy And Fast Copy , MT5 Local Trading copying For DEMO Easy And Fast Copy , MT4 DEMO Easy And Fast Copy , MT5 DEMO
Strongly recommend trend indicators, a
FREE

Extract Candle Power is a real time volume extractor indicator that provides valuable insights into the behavior of sellers and buyers during each candle. By analyzing the volume data, traders can make more informed decisions about market trends and potential reversals, surpassing the capabilities of traditional Moving Average indicators. This powerful tool allows you to extract and analyze the sellers and buyers volume of the current candle, as well as compare it with the volume of previous can
Keltner MTF (Not repaint!!!) is a channel indicator that can display price channels from different timeframes on a single chart of quotes. For example, on the H1 chart, you can see at the same time the Keltner price channel from the M15 and H4 timeframe. This tactic makes it possible to more clearly understand the tendency of price movements, to determine trading goals and points for making deals. How the Keltner MTF Indicator Works The Keltner MTF indicator can be used both - for trading in
This is a SnR tool.
It is built based on the body candle.
It is a multi timeframe indicator.
There is a powerful scalabar for vertical line slides to limit the candle bars.
Color for each line can also be changed.
It can detect:
1. Support && Resistance
2. Support become Resistance && vice versa
3.Support become Resistance become Support && vice versa
It also can be used for trading tools and studies on SnR *New Version avaiable

MACD Scanner provides the multi symbols and multi-timeframes of MACD signals. It is useful for trader to find the trading idea quickly and easily. User-friendly, visually clean, colorful, and readable. Dynamic dashboard display that can be adjusted thru the external input settings. Total Timeframes and Total symbols as well as the desired total rows/panel, so it can maximize the efficiency of using the chart space. The Highlight Stars on the certain matrix boxes line based on the selected Scan M
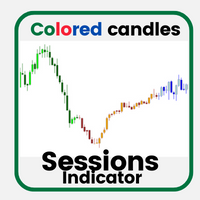
This indicator shows trading sessions using colored candles. It's made for volume profile and supply/demand traders to quickly see when specific candles are formed during different times or trading sessions.
Take a look at the screenshots for a usage example.
Core Features: Different colors for bullish and bearish candles, allowing users to distinguish between bullish/bearish candles.
FREE

The indicator is designed to work on any trading platform. The program is based on proprietary algorithms and W.D.Ganna's mathematics, allowing you to calculate target levels of price movement based on three points with the highest degree of certainty. It is a great tool for stock trading. The indicator has three buttons: NEW - call up a triangle for calculation. DEL - delete the selected triangle. DELS - completely remove all constructions. The probability of achieving the goals is more than 80

Display your Local Time on your charts
Display your local time instead of (or along with) MT4 server time.
Display crosshair which highlights current candle time.
Automatically adjusts based on chart zoom (zooming in or out).
Displays on every timeframe (M1 – Month), and auto-adjusts as chart timeframe is changed.
Handles special ½ hour time zones , such as India.
Renders fast (no lag) as you scroll charts.
Customize the font family, font size, background color, and crossh
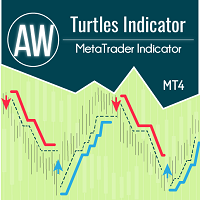
The indicator works according to the Turtle system and classically assumes a time interval of 20 and 55 candles. A trend is monitored over a given time interval. Entry is made at the moment of breakdown of the support or resistance level. The exit signal is a price breakout in the opposite direction of the trend of the same time interval. Advantages:
Instruments: Currency pairs, stocks, commodities, indices, cryptocurrencies Timeframe: Classically D1, also suitable for working with any timefr
FREE
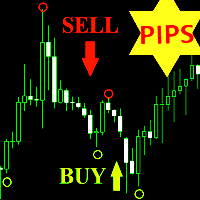
Pips Scalper Indicator - is a forex trading indicator specially designed for traders who are interested in scalping strategy. Scalping is a trading strategy in which a trader attempts to make a positive trade by snippets of small price movements. How to use the indicator? When the indicator draws a green circle on the chart of the currency pair, we open a buy deal and set a short TakeProfit of 20-25 points. In 87% of the signals, the price will go at least 20 pips in the direction of the arrow.

The indicator determines the state of the market (trend or flat) using the upgraded Bollinger Bands of higher timeframes and colors the bars in trend/flat colors. The indicator also gives signals (arrow on the chart + Sound and notification to Mail, Push):
signal at the beginning of every new trend; signal inside the trend (entry at the end of the correction) Signals are never redrawn!
How to use the indicator? The indicator works very well intraday. When using the indicator for intraday (T

Full Stochastic - is Stochastic Oscillator which displays all three essential lines: %K Slow K %D Standard Stochastic Oscillators displays only Slow K and %D.
Why it is important to analyze all three lines in SO? Standard SO users must choose if they want to use fast or slow SO. In case of fast SO traders set the slowing parameter typically to 1 or 2, or if they want to use slow SO, they set the slowing parameter usually to 3 or more. With Full Stochastic you can have both!
Full Stochastic P
FREE

The "M1 scalping signal" is a scalping indicator designed for the M1 timeframe. The indicator displays arrows on the chart indicating price reversal points. A red arrow indicates a price reversal to a sell position, while a green arrow indicates a price reversal to a buy position. It can be used on all currency pairs. Advantages: No Redrawing: The indicator does not redraw signals on historical data, ensuring stable analysis. Ease of Use: It is easy to configure and visualizes important reversal

This indicator has been created for finding the probable reversal points of the symbol price. A small candlestick reversal pattern is used it its operation in conjunction with a filter of extremums. The indicator is not redrawn! If the extremum filter is disabled, the indicator shows all points that have a pattern. If the extremum filter is enabled, the condition works – if the history Previous bars 1 candles back contains higher candles and they are farther than the Previous bars 2 candle, such
FREE
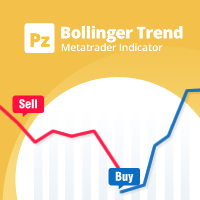
A personal implementation of the famous Bollinger bands indicator as a trend following mechanism, which uses a moving average and the standard deviation to define what a trend is and when it changes. Bollinger bands are usually used as an oversold/overbought indicator only, but in my opinion, the trading approach is more complete using the trend variant as an exit strategy. [ Installation Guide | Update Guide | Troubleshooting | FAQ | All Products ] Easy to trade Customizable colors and sizes It
FREE
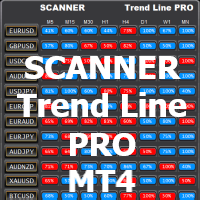
Works with Trend Line PRO indicator and set files made by Optimizer Utility You can download additional programs: here The scanner is developed to get new signals of the Trend Line PRO indicator on all pairs and timeframes from M5 to MN1
For the scanner to work, you should have an indicator. The main advantage of SCANNER Trend Line PRO is the possibility to use an individual set file for each pair and timeframe.
You can automatically set up, change and save settings for each pair in t
FREE

An indicator that displays the Engulfing candlestick pattern. In the settings, you can specify the type of engulfing (body, shadow and combination). It is possible to filter by trend (2 moving averages) and by reversal (RSI and Bollinger Bands). This is a very popular price action pattern. A multi-currency dashboard is available. With it, you can easily switch between charts.
Trading Patterns: Retest by trend. False breakout. Order Block. Other.
EURUSD, GBPUSD, XAUUSD, ... M15, M30, H1.
I

The balance of supply and demand is a simple and effective market analysis method. The supply and demand diagram can show you in advance, even before the trend reversal, where the supply ends and the demand is already emerging, where the demand ends and the supply is emerging, while substantially increasing the probability of making a deal in the right direction and with a high profit factor.
Indicator Signals The indicator uses the price/volume values to generate signals: ED – excess demand.
MT5 Version Available Here: https://www.mql5.com/en/market/product/62376
Telegram Channel & Group : https://t.me/bluedigitsfx
V.I.P Group Access: Send Payment Proof of any of our Paid Products to our Inbox
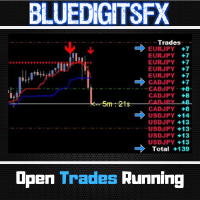
Recommended Broker: https://eb4.app/BDFXOsprey * The Most Sought After Pip Counter for Metatrader ! Features
Will show Currency Symbol in BLUE for Buy positions. Will show Currency Symbol in RED for Sell positions. Will Show pips in BLUE Color for Positive Pips Will Show pips in
FREE

Royal Scalping Indicator is an advanced price adaptive indicator designed to generate high-quality trading signals. Built-in multi-timeframe and multi-currency capabilities make it even more powerful to have configurations based on different symbols and timeframes. This indicator is perfect for scalp trades as well as swing trades. Royal Scalping is not just an indicator, but a trading strategy itself. Features Price Adaptive Trend Detector Algorithm Multi-Timeframe and Multi-Currency Trend Low
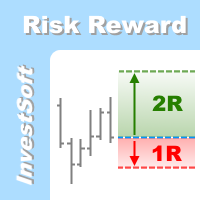
This is the forex visual orders tool & forex position size (lot) calculator with intuitive panel. Risk Reward Ratio Indicator works on all kind of symbols: currency pairs, indices, metals, commodities, cryptocurrencies, etc.
If you want to make sure that Risk Reward Ratio Indicator works on your favorite symbols contact us ( visit our profile ) and ask for 7-day free trial to test this tool without limits. If you want to place orders easier, faster and more intuitive? If you like to mark tr

Graf Mason is a tool that will make you a professional analyst! The method of determining wave movements using inclined channels qualitatively conveys the schematics of the movement of any instrument, showing not only possible reversals in the market, but also the goals of further movements!Destroys the myth that the market is alive , clearly showing the schematics of movements from one range to another! A professional tool, suitable for the medium term with the definition of the current trend!

MACD Intraday Trend is an Indicator developed through an adaptation made of the original MACD created by Gerald Appel in the 1960s. Through years of trading it was observed that by changing the parameters of the MACD with Fibonacci proportions we achieve a better presentation of the continuity of the trend movements, making that it is possible to more efficiently detect the beginning and end of a price trend. Due to its efficiency in detecting price trends, it is also possible to identify very c
FREE

New, more accurate version of the Xmaster indicator. More than 200 traders from around the world have conducted more than 15,000 tests of different combinations of this indicator on their PCs in order to get the most effective and accurate formula. And here we present to you the "Xmaster formula indicator forex no repaint" indicator, which shows accurate signals and does not repaint. This indicator also sends signals to the trader by email and push. With the arrival of each new tick, it constan

MetaForecast predicts and visualizes the future of any market based on the harmonics in price data. While the market is not always predictable, if there is a pattern in the price, MetaForecast can predict the future as accurately as possible. Compared to other similar products, Metaforecast can generate more accurate results by analyzing market trends.
Input Parameters Past size Specifies the number of bars that MetaForecast uses to create a model for generating future predictions. The model i
CME Daily Bullettin Open Interest provides the data on the open interest of futures contracts on the CME for your charts. Open interest is a special type of volume, that shows how many contracts are being held by the market participants at each moment of time. This type of information is available only in futures markets. But now, with this indicator, you can also analyze these data when trading the spot markets, such as FOREX. In addition, the indicator provides data on the open interest for th
Do you know why the MetaTrader Market is the best place to sell trading strategies and technical indicators? No need for advertising or software protection, no payment troubles. Everything is provided in the MetaTrader Market.
You are missing trading opportunities:
- Free trading apps
- Over 8,000 signals for copying
- Economic news for exploring financial markets
Registration
Log in
If you do not have an account, please register
Allow the use of cookies to log in to the MQL5.com website.
Please enable the necessary setting in your browser, otherwise you will not be able to log in.