Watch the Market tutorial videos on YouTube
How to buy а trading robot or an indicator
Run your EA on
virtual hosting
virtual hosting
Test аn indicator/trading robot before buying
Want to earn in the Market?
How to present a product for a sell-through
Technical Indicators for MetaTrader 4 - 39

The R Stoploss Signals indicator is based on a trend following exponential moving average. This forex indicator generates buy and sell trading signals in the form of blue and red lines drawn on the activity chart. Blue colored lines indicate the trend is upwards and this is a signal to buy the currency pair. Red colored lines indicate the trend is downwards and this is a signal to sell the currency pair. A suggested stop-loss line is also included with this forex indicator. For buy signals, put
FREE

This indicator is Demo version of FiboRec and works only on EURUSD This indicator depends on Fibonacci lines but there are secret lines I used. By using FiboRec indicator you will be able to know a lot of important information in the market such as:
Features You can avoid entry during market turbulence. You can enter orders in general trend only. You will know if the trend is strong or weak.
Signal Types and Frame used You can use this indicator just on H1 frame. Enter buy order in case Cand
FREE

Follow the trail of the comet to know the development of the trend. This indicator helps you to determine the evolution of the price depending on how these astronomical objects are shown in the chart. When the comet seems to stop, it opens its tails considerably and warns us of a possible change in trend. On the contrary, when it seems to get speed (looks thin because lines of tail are grouped) demonstrates safety and continuity in trend. The head or comet nucleus will show red or green accordin
FREE

Classic indicator. The Fractals indicator analyzes the price patterns that form on the candlestick chart and display the reversal points of the market trend. The indicator consists of candles, the middle of which is either the highest (up fractal) or the lowest (down fractal). Highs and lows, indicated by the indicator on the chart, are recommended to be taken as points that form support and resistance lines. Unlike the original indicator, where fractals are formed by five candles (high/low in t
FREE

This indicator is an utility for have always under control, how much time is left at the end of the bar setted.
The utility show on the lower right of the chart, the countdown to the end.
When the remaining seconds is = to the seconds set in the input, the color of remaining seconds on chart, change color and play a warning sound to warn you that the bar is about the end. When the remaining seconds is < to the seconds set in the input, the utility play a beep to warn you that the bar is in
FREE
红黄绿简明指示趋势与震荡指标升级版。 使用红黄绿三色来标示上升趋势 、震荡、下跌趋势。 红色表示空头趋势(下跌)。 绿色表示多头趋势(上涨)。 黄色表示震荡区域。 从黄色转变为红色时,行情可能从震荡转变为下跌趋势。一段连续的红色,说明下跌趋势很强。 从黄色转变为绿色时,行情可能从震荡转变为上升趋势。一段连续的绿色,说明上升趋势很强。 指标的上半部分区域和下半部分区域若同步为红色,表明下跌趋势已经形成共振,接下来大概率走出一段空头趋势。 同时,红绿黄分为上下两部分:
若上下部分同时为绿色,表明上涨趋势已经形成共振,接下来大概率走出一段多头趋势。 若上下部分同时为红色,表明下跌趋势已经形成共振,接下来大概率走出一段空头趋势。
若上下同时为黄色,表明当前行情为震荡。 升级版2.0: 新增两条快慢线。 当慢线(Blue/Red线)为蓝色时,视为多头行情。当慢线为红色时,视为空头行情。 当快线(DarkGray线)从下方向上穿过慢线时,作为参考做多信号,激进交易者可进场做多。反之亦然。
参数可调。 //+------------------------------------------
FREE
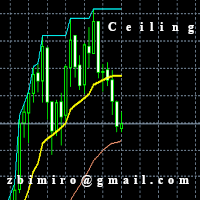
The "Ceiling MT4" indicator has been designed to determine the exit point from the market and it is based on a moving average set in parameters and shows 3 lines. 1. Ceiling lines, that is the highest / lowest value currently achieved on the chart in the horizon set in the "Plafon Horyzon" parameter. 2. The "Signal" line that shows the line shifted to the part specified in the "Signal_Part" parameter is set by default to 2, which means that it is halfway between the moving average and the plafon
FREE

The EA in the form of histogram displays up and down trends. This tool is recommended to be used as a filter. Its readings will help to detect beginning, end, and continuation of a trend. This additional tool will suit any trading system. Parameters Period — indicator period; Bars — number of bars on the history.
FREE
This indicator displays the signals based on the values of the classic DeMarker indicator on the price chart. The DeMarker indicator can be used for determining the overbought or oversold areas on the chart. Reaching these levels means that the market can soon turn around, but it does not give signal, as in a strong trend the market can stay in the overbought or oversold state for quite a long time. As with most oscillators, the signals are generated when leaving these areas. This indicator all
FREE

This indicator determines minimum volumes needed during a candle formed so that it would be higher than current volume's average. Although you can place MAs on your volume indicator, this indicator has non-repaint characteristic so you may not to worry about sudden volume increase. This indiator also draw volume indicator for its own. Input Description: period: Period used for indicator. Must be higher than 1. Output Description: VolumeXover: This indicator's main feature. During the time the vo
FREE
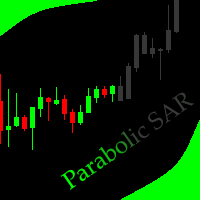
This indicator allows to hide Parabolic SAR (on all MT4 timeframes) from a date define by the user, with a vertical line (Alone) or a panel (with "Hidden Candles"). Indicator Inputs: Step Maximum Color Width Information on "Parabolic SAR" indicator is available here: https://www.metatrader4.com/en/trading-platform/help/analytics/tech_indicators/parabolic ************************************************************* Hey traders!! Give me your feeds! We are a community here and we have the sa
FREE

Indicator support for only: Entry Point to Trend Pro Link indicator support : https://www.mql5.com/en/market/product/70867
Supports all currency pairs declared in the definition. Help investors do not need to open many charts. Notice the DEAL: multiple time frames confluence M15, H1, H4.
Entry Point to Trend Pro The indicator helps investors to identify the earliest and perfect reversal point. Easy to make decision to trade with the trend Price action trading. support resistance
FREE

This indicator will mirror the assets in use in another metatrader, being able to choose the timeframe and a template. This is the Metatrader 4 Client, it needs the Metatrader 4 or 5 Server versions: Metatrader 4 Mirror Chart Server: https://www.mql5.com/en/market/product/88644
Metatrader 5 Mirror Chart Server: https://www.mql5.com/en/market/product/88652 Details of how it works in the video.
FREE

Time to Trade Trading timing indicator is based on market volatility through 2 ATR indicators to determine the timing of a transaction. The indicator determines the times when the market has strong volatility in trend. When histogram is greater than 0 (blue) is a strong market, when histogram is less than 0 (yellow) is a weak market. Should only trade within histograms greater than 0. Based on the histogram chart, the first histogram value is greater than 0 and the second histogram appears, this
FREE

This indicator calculates average speed of moving average indicator. Here is parameters: BarsToProcess - indicator calculating period; MaPeriod - period of Moving Average indicator; AveragingPeriod - period (MA values) of the basis of which the average value is calculated; MA_Method, MA_Apply_to - using to set MA indicator parameters; Thats all! Good luck.
FREE
"Visual Range - Spread Indicator". This Indicator is an Essential Tool for Manual trading. it helps to avoid "off price" and "bad" entries caused by abnormally High spreads. ...................................................................................................................... At the Market Opening and News Reports - the Size of the Spread can go temporarily widely High. The Indicator shows the current Size of the Spread visually on the chart and its distance from the current pr
FREE

MP Price Change Indicator is a tool to calculate the price movement by percentage. The Value of this indicator can be adjusted to look back of the percent of price change within certain timeframes. This is a powerful tool when used by other indicators as well, such as ATR and ADR, for understanding price fluctuations and tolerance in different strategies. ___________________________________________________________________________________ Disclaimer:
Do NOT trade or invest based upon the analys
FREE
The indicator improves the idea implemented in the standard Bulls and Bears indicator. This indicator displays the difference between the High and Low for the current period of time and the values of the channel constructed at the maximum and minimum prices, which are smoothed by Laguerre method. The growth of the indicator values above zero indicates that the High for the current period is greater than the average of the High prices. This situation in most cases indicates an increase in the
FREE
The indicator generates signals for opening positions. The principle of operation is to compare the current closing price with the closing price range for a longer period. The signals are confirmed when the price exceeds the High/Low of the bar where the indicator generated the signal. Maintenance of an open position is carried out on a smaller TF. Indicator signals to open an opposite position on a smaller TF are a signal to close the deal. This indicator does not repaint or not recalculate.
FREE

CCFp (Complex_Common_Frames percent) is a measure of currency strength.
Shows the total rate of change of “short-term moving average” and “long-term moving average” for each currency.
Supports eight major currencies: USD, EUR, JPY, CHF, GBP, AUD, CAD and NZD.
1). Displays the currency name at the right end of the graph.
2). You can change the display color of each currency.
3). Moving average smoothing type (ENUM_MA_METHOD) can be selected.
4). Price constant (ENUM_APPLIED_PRICE
FREE

Trend Panel Limited is an indicator that allows you to know the trend of a pair in a given timeframe using 2 moving averages. You can modify the period of the moving averages. Allows you to select which pairs you want to monitor in the input parameters. You also decide in what time period you want to follow up. In short, TrendPanel gives you the possibility of knowing the trend of a pair in a certain period of time without having to change the chart. Version limitations: You can only select 2 pa
FREE

This indicator is based on the MACD indicator
Also, some candlestick patterns are used in it to identify better signals
Can be used in all symbols
Can be used in all time frames
Easy to use method
Adequate settings
Settings: period: The number of candles used to calculate signals. pFast: Like the MACD indicator settings pSlow: Like the MACD indicator settings
alarmShow: If you want to receive an alert in Metatrader after receiving the signal, enable this setting alarmShowNoti: If you
FREE
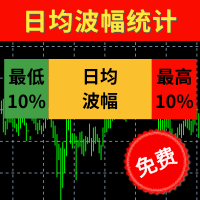
【最低10%】 统计过往100天蜡烛图的波幅并进行排序,最低10%的波幅以点数显示。 【日均波幅】 统计过往100天蜡烛图的平均波幅,并以点数显示。 【最高10%】 统计过往100天蜡烛图的波幅并进行排序,最高10%的波幅以点数显示。 【今日】 今日波幅以点数统计,箭头的位置是今日波幅相对于历史总体波幅的位置。越靠近左侧说明今日波幅越小,越有侧说明波幅越大。 波幅指标最适合用来审视当日距今为止波幅的大小,使用方法如下: 若今日时间尚早而且今日波幅尚较低,说明今日可能行情尚未启动,还有入场机会。 若今日时间尚早但今日波幅已经超过80%,说明今日趋势行情可能已经结束,接下的行情可能反弹。 若今日时间较晚,而且今日波幅已经超过60%,说明今日行情可能已经走完。 当日的止盈点位+当日已完成波幅最好不超过最高10%的波动点数。 当日的止损点位+当日已完成波幅最好超过最高10%的波动点数。 当然该指标是基于过往的100日数据进行统计,并不代表接下来今日的波幅一定不会创新低或者创新高,其作用是给日内交易者的入场时机和日内交易空间提出判断依据。 更多细节请看 http://www.sygdpx.co
FREE

This indicator draws on the chart high and low prices of different periods . And If you want, Indicator can alert you when the current price arrive these levels. Alert Options: Send Mobil Message, Send E-mail, Show Message, Sound Alert Time Periods: M1, M5, M15, M30, H1, H4, D1, W1, MN Inputs: TimeShift: You can set start hour for calculating. And that way you can see levels independently from broker server's time-zone. PipDeviation: You can set price sensibility for alert (Default: 3) Lines
FREE

The Candle GAP indicator is an essential tool for traders utilizing Gap Trading Strategies as it automatically identifies candle gaps for each day of the week. A gap refers to a price level difference between the close and open of two consecutive days. This indicator recognizes four types of gap patterns: Common, Breakaway, Continuation, and Exhaustion. By incorporating this indicator into any chart, traders can validate their signals and enhance their trading decisions. One of the key features
FREE

The indicator displays a grid in the form of a "honeycomb" or regular hexagon. An alternative to the standard grid of the terminal. Description of the indicator settings: color_comb - grid color width - width, for example: 22 for a screen resolution of 1920*1080, 15 for a screen resolution of 1366*768, etc. height - height, for example: 6 for a screen resolution of 1920*1080, 4 for a screen resolution of 1366*768, etc.
FREE
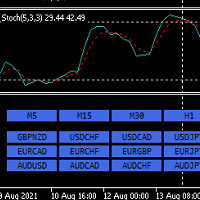
Hello,
This is an easy symbol change panel.
The free version only can change major pairs which are "AUDUSD, EURUSD, GBPUSD, USDCHF, USDCAD, USDJPY, NZDUSD"
The full version can add your symbols.
FULL version here:
https://www.mql5.com/en/market/product/71176?source=Site+Market+MT4+Indicator+New+Rating005
Also, can change the TimeFrame as well.
Symbols must be active on your Market Watch list.
Parameters:
ratio - change the size LineNumber - you can set that how many symbols
FREE

I make this indicator to help you for setting effective stoploss and getting more signals from following trends. This indicator helps to tell the trends and sideway, when 2 lines stand above of blue cloud, it means uptrend. When 2 lines stand above red cloud, it means down trend, the other else, it means sideway market. For taking order, you have to wait the arrows. You also need to see the cloud position, if the cloud's res, you have to wait the yellow arrow for selling order. If the cloud's bl
FREE

The MAtrio indicator displays three moving averages on any timeframe at once with a period of 50-day, 100-day, 200-day. After attaching to the chart, it immediately displays three moving averages with the parameters of simple (SMA) moving average SmoothingType50 , simple (SMA) moving average SmoothingType100 , simple (SMA) moving average SmoothingType200 . Accordingly, with the price type ValuePrices50, ValuePrices100, ValuePrices200 , by default, the price is Close price everywhere. All parame
FREE

Fast T3 MA Trend indicator derived from T3 moving averages. This indicator is part of the T3 Cloud MA indicator and is posted here on its own. Buying/Selling opportunities above/below line. The MA line can also be used as dynamic support/resistance for more aggressive entries. Use default values for best settings. The number of look back bars is user defined. This indicator can be used in combination with other strategies such as price action. Suitable for all time frames.
FREE
Parabolic Sar easy mode, remake the original p.sar indicator making it more easy to read for novicians traders and experimented traders looking to reduce the time analizing the charts, you can make your own strategy modificating the periods and fusioning it with others indicators like RSI ,stochastic or what you want,its one indicator runs better on high time charts like H4 or D1.
FREE

Utility for show on charts the visual informations about: - a vertical line at start of each bar of selected timeframe - a vertical line at start of each day - a vertical line at start of each week - vertical lines at start / end of trading sessions selected - bid / ask prices, spread, money value for each point (of 1 standard lot) and last tick time recived" You can enable / disable each information and set the color for each line
FREE
Velvet MACD is intended for use with the Velvet advanced ordering layer. It is a modified version of the MACD indicator provided by Metaquotes and all of the data it displays is accurate and verified, when it is detected by the ordering layer. In order to place orders with the Velvet MACD indicator, the ordering layer must be installed and running. Ordering from the Velvet MACD indicator requires that "Velvet Ordering Layer" ( found here ), version 2.0 or higher, be installed and running. Whe
FREE

Introducing Force Jurik—a powerful indicator designed to enhance trading insights by combining custom moving averages based on Jurik with the MetaTrader 4 indicator, Force Index.
Jurik moving averages are renowned for their precision and smoothness, making them ideal for analyzing price movements in the forex market. They offer traders a reliable method of identifying trends and filtering out market noise, ultimately providing clearer signals for decision-making.
The Force Index, a popular
FREE

Useful indicator that incorporates three moving averages, for your favorite trading strategy. Moving averages are fully configurable, Period, Method, Color, Etc Just place it on your favorite timeframe.
The benefits you get : Never redesigns, does not retreat, never recalculates. Works on forex and CFD, timeframe from M1 to Monthly. Easy to use. Convenience for your trading.
FREE

The indicator plots an affine chart for the current instrument by subtracting the trend component from the price. When launched, creates a trend line in the main window. Position this line in the desired direction. The indicator plots an affine chart according to the specified trend.
Input parameters Maximum number of pictured bars - the maximum number of displayed bars. Trend line name - name of the trend line. Trend line color - color of the trend line. Black candle color - color of a bullis
FREE

Description A universal colored multicurrency/multi-symbol indicator of moving averages: Moving Average, Double Moving Average, Triple Moving Average . The indicator is drawn in a separate window, so below the main trading chart a user can see the development of another financial instrument. It is very useful when considering the combined values of various moving averages for different financial instruments below the main trading chart. The indicator may be used with any broker, irrespective of

Please contact me at telegram https://t.me/smartforex7 After purchasing SmartForex Indicator then Use This Indicator...................... SMART EXIT PROFIT LINE Indicator is very Helpful with SmartForex Indicator ........................................ SMART EXIT PROFIT LINE Indicator Attach with SmartForex Indicator after then Red Line Show Exit buy Profit , Green Line show Exit Sell Profit................
FREE

MA Digital Indicator Suitable for multi time frame
Buy Call: When the Red, Blue and Steel blue line crossed above the dark violet line. Sell Call: When the Red, Blue and Steel blue line crossed below the dark violet line.
Happy trade!!! this indicator is suitable for all time frame, but our recommended time frame to use 1hour and 4 hours, suitable for any chart.
FREE

Free version of https://www.mql5.com/en/market/product/44606 Simple indicator to calculate profit on fibonacci retracement levels with fixed lot size, or calculate lot size on fibonacci levels with fixed profit. Add to chart and move trend line to set the fibonacci retracement levels. Works similar as default fibonacci retracement line study in Metatrader. Inputs Fixed - select what value will be fix, lot or profit (available in full version, lot is set on free version) Fixed value - value t
FREE

This is an original trend indicator. The indicator draws three lines in a separate window. Its values vary from -1 to +1. The closer the indicator is to +1, the stronger is the ascending trend. The closer it is to -1, the stronger is the descending trend. The indicator can be also used as an oscillator for determining the overbought/oversold state of the market. The indicator has one input parameter Period for specifying the number of bars to be used for calculations.
FREE

This classic "old school" MAGIC MACD indicator gives you the cross of the parameters you set. Standart setting is (12,26,9) . The arrows give you a possible change of trend. Be careful and do not use this indicator as a single signal source.
FREE version Please feel free to check out our other REX indicator series. We do have other free indicators.
"OLD BUT GOLD"
FREE
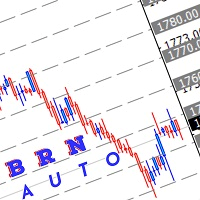
Use this indicator to draw multiple horizontal line to nearest round number Range for round number can be adjust manually depend how user want to use it Selection of colour also can be adjust manually Hope this indicator can help somebody in their trading.
How to use this: Mostly I use this indicator for break, retest and entry. example:- current price XAUUSD :1740.00 which mean the closest level are 1750.00 and 1730.00 Wait for price to break this level. then wait for retracement if price mak
FREE
Добрый День, Всем. Решил выложить свой индикатор, предложить на просмотр. Я трейдер, Вадим Сергеевич Лепехо. Индикатор не стандартный, сделан не по канонам. Индикатор рисует маржинальные зоны на графике, пока полет нормальный. Но строит зоны по индикатору AO(Awesom) конкретней по фрактальным зонам индикатора AO. Зоны стандартные 1/4, 1/4, и НКЗ. Пример привожу по EURUSD + в картинках. На данный момент 14.10.23 - нкз=1920 пипсов(192 пункта) предлагаю преобразить до 192пипсов(19.8пунктов). Поясняю
FREE

This indicator smoothes the value of CCI (Commodity Channel Index) and reduces its volatility. By using this indicator, the fluctuations created by the CCI indicator are reduced. The smoothed CCI value is placed in a buffer that you can use in your EA and strategy. Leave me a comment if you want By using this indicator, you no longer need to use the Moving Average indicator on the CCI indicator.
FREE

---> Check all the other products <---
The Multi Time Frame Chandelier Channel is a good synthesis of the chandelier trailing stop and let you analyze the trend.
Enter when the price breaks one of the two lines, then trail using the opposite line. Ideal for scalping, entering after the dot appears.
Plenty of customization: Choose the lookback period, the longer, the slower Choose the Time Frame to use (must be greater or equal your chart TF Play around with the options to get the
FREE
The purpose of this new version of the MT4 standard indicator provided in your platform is to display in a sub-window multiple timeframes of the same indicator. See the example shown in the picture below. But the display isn’t like a simple MTF indicator. This is the real display of the indicator on its timeframe. Here's the options available in the FFx indicator: Select the timeframes to be displayed (M1 to Monthly) Define the width (number of bars) for each timeframe box Alert pop up/sound/ema
FREE

This Dashboard is free to download but is dependent on you owning the Advanced Trend Breaker . Get the indicator here: https://www.mql5.com/en/market/product/66335
The Dashboard will show you on a single chart all the timeframes (M1 to Monthly) with their own status for the indicator: Advanced Trend Breaker
all time frame and all symbol: smart algorithm detects the trend,Support and resistance, filters out market noise and find breaker of entry signals!!!
!!!
How to unders
FREE

Footmarks Pro Footmarks Pro is a MetaTrader 4 Essential Indicator that create round number or sweetspot on chart with "Button". Parameter Indicator Name - Footmarks Pro Pair Selection - 250 points / 500 points / 1000 points Sweetspot Setting Sweetspot Line Color Sweetspot Line Style Sweetspot Line Thickness Sweetspot Button Setting Button Axis-X Button Axis-Y Thanks...
FREE
The presented indicator displays in the form of colored candles the signals of the intersections of four RSI indicators of different periods. The candle turns red when the values of the first indicator are less than the values of the second indicator and the values of the third indicator are less than the values of the fourth indicator. The candle turns blue when the values of the first indicator are greater than the values of the second indicator and the values of the third indica
FREE

This indicator allows to hide Ichimoku Kinko Hyo (on all MT4 timeframes) from a date define by the user, with a vertical line (Alone) or a panel (with "Hidden Candles"). Indicator Inputs: Tenkan-sen Kijun-sen Senkou Span B Information on "Ichimoku Kinko Hyo" indicator is available here: https://www.metatrader4.com/en/trading-platform/help/analytics/tech_indicators/ichimoku ************************************************************* Hey traders!! Give me your feeds! We are a community here
FREE

ON Trade Pivots is A technical indicator that Draws all Pivot levels depending on time frame that defined in settings.
Notes It will be good tool for all traders who use pivot levels in their trades. Let me inform you that this indicator draw this level as buffers not as objects then you can connect it easily to EA. This indicator allow you to find pivots levels for any time frame not only daily you are free to choose time frame from settings.
Parameters Use_System_Visuals - Enable /Disable
FREE
This indicator is a modification of the classic Parabolic support and resist (PSAR) indicator. The indicator has two customizable ranges, which allows you to identify long-term and short-term trends. The indicator has the ability to generate signals and send notifications about them to email and the terminal. A time-tested product that allows you not only to determine entry/exit points, but also reasonable levels for placing protective stop orders.
FREE

This is a regression tree indicator for MT4/MT5.
This indicator classificate nodes on the time period so that the deviation becomes smaller,
and displays regression line and channel for each node.
It's free!
Attached CartDemo.ex4 and CartDemo.ex5 is a Demo version and has the following limitations:
Method is RandomForest only
Maximum number of bars is 200
Maximum number of trees is 2
Maximum tree depth is 2
Calculated waste lines are shown
Not display correlation coefficients
Fu
FREE

Rua Power Currency This is an indicator that measures the strength of each currency based on current data. Indicator allows selecting timeframe to calculate the power of money. High timeframes like H4, H1, D1 are often used to identify trends. Smaller timeframes are often used to fight Scalping. Input parameters: Seconds: Time to refresh the data x: coordinates x y: y coordinates Timeframe: timeframe retrieves data Period: Period A product of Ruacoder.
FREE

The presented indicator uses the Laguerre filter to build an oscillator. The indicator has the possibility of double additional smoothing, which can be useful for small values of the Gamma parameter. The indicator gives three types of signals: Exit of the oscillator from the overbought / oversold zone; The oscillator crossing the middle of the value between the overbought/oversold zones; The oscillator enters the overbought/oversold zone. On fully formed candles, the indicator does not redraw.
FREE

This indicator displays elements of the trading system described by Alexander Elder. This indicator uses the idea of opening sell deals in the period of MACD (or OsMA) falling below zero and opening buy deals when the indicator values rise above zero, in case this fall or rise coincide with the Moving Average direction. The thick and thin histograms correspond to the values of MACD and OsMA. If a histogram is above 0, the indicator value is greater than 0. If it is below, the indicator value is
FREE
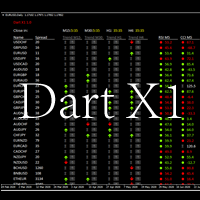
Scanner type indicator, allows you to view information about all the active symbols in metatrader 4. You can see the size of the spread, trend in M5, M15, M30, H1, H4. It also allows to open a chart on the selected symbol and timeframe. Also, you can see the time left to close the current candle.
Finally, you can view the value of the indicators: RSI, CCI and Estocasty. But the green color indicates a possible uptrend and the red color a possible downtrend.
FREE
This indicator collects and organizes spread data. It is an organic add-on to my news robot, ExpertNews , which can be downloaded here .
You can also watch a video about news trading using the ExpertNews robot. It is available on youtube .
Unfortunately, it is not possible to place the robot in the mql5.com store, because the automatic validation of ExpertNews by the mql5 service ends in failure. In reality, there are no errors in the robot.
Testing fails due to the fact that the advisor
FREE

ADR 10 mostra l'intervallo medio di pips di una coppia Forex, misurato su un numero di 10 giorni . I traders possono utilizzarlo per visualizzare la potenziale azione dei prezzi al di fuori del movimento medio giornaliero.
Quando l'ADR è al di sopra della media, significa che la volatilità giornaliera è superiore al normale, il che implica che la coppia di valute potrebbe estendersi oltre la sua norma.
L'ADR è utile anche per il trading di inversioni intraday. Ad esempio, se una coppia di
FREE

Stat Monitor is a good information indicator.
Benefits of the indicator: The indicator provides useful information - the current spread, the cost of one lot of the symbol, trading leverage and the recommended lot size for trading. You can use the indicator on the MetaTrader 4 trading platform of any broker. The indicator provides useful information.
Version of the Stat Monitor indicator for MetaTrader 5 I wish you all good luck in trading and stable profit!
FREE
Pattern Detector can detect the most common 1, 2 and 3 candlestick patterns and send notifications when detected. The DEMO version only works on AUDNZD pair. Full product can be found https://www.mql5.com/en/market/product/29190
How does it work Add the indicator to the chart you want to analyze and select which patterns to detect, the indicator will draw the detected patterns. You can also be notified via alert, app and email when a new pattern is detected.
Parameters Indicator Name - Used
FREE
This indicator displays DeMarker oscillator data for two different periods. The position of the histogram above zero indicates an increase in prices. The location of the histogram below zero indicates a fall in prices. On fully formed chart bars, the indicator is not redrawn. At the same time, the indicator values at 0 bar (the current bar, the bar that has not finished forming yet) may change. Thus, the indicator values at 0 bar should be ignored.
- Sale subject to all conditions:
Indica
FREE
This indicator gives the highest and lowest information of the currency you have selected and the day you selected. It also shows the average. In this way, you can find out the profit / loss probability of your transactions for the same days. Reported: Average points per week Average points per year Lifetime average points Note: It does not provide you with buy / sell signals. Shows average points only
FREE

Introducing Austin Bands—an innovative indicator designed to enhance your forex trading strategy by applying moving averages to the MetaTrader 4 indicator, Bollinger Bands.
Bollinger Bands are a popular technical analysis tool that consists of a middle band (usually a simple moving average), an upper band (calculated by adding a specified number of standard deviations to the middle band), and a lower band (calculated by subtracting a specified number of standard deviations from the middle ban
FREE

RSI Scanner, Multiple Symbols and Timeframes, Graphical User Interface An indicator that scans multiple symbols added from the market watch and timeframes and displays result in a graphical panel. Features: Multi symbol Multi timeframe Alerts and Notifications Live Monitoring Sorting modes One click to change symbol and timeframe Inputs for RSI and scanner settings
FREE
Track your overall trades! Monitor New Fox is an excellent indicator, which displays your current profits, being them monthly, weekly, and daily, that is, all profits obtained when you opened the mt4. Our brand new Monitor New Fox indicator is able to unlock all advanced features of MetaTrader 4. This indicator can graph with simple data key meta trader account data (Balance, Equity, Free Margin, Current Profit/Loss, Profit/Loss total, amount of open position(s) and size, etc.) and all this in a
FREE

Digital filters are (simplified) a way to smooth data. Unlike traditional moving averages, a digital filter will be more effective in most cases. This indicator allows you to identify the difference between the current price and its expected value calculated by the adaptive digital filter. Divergence moments are moments of price movement that can be used to open a trade. The indicator not only visually displays such moments in a separate window, but also allows you to send notifications to the u
FREE

SYMBOL POWER based on inputted 5 time frames and Compared to 20 Other Symbols !! Great Indicator YOU DON'T HAVE TO SHIFT ON ALL TIME FRAMES FOR EACH CURRENCY PAIR TO CONCLUDE ITS TREND AND ITS POWER YOU HAVE IT ALL IN ONE TABLE , 20 CURRENCY PAIR WITH 5 TIME FRAMES ALSO , COMPARE BETWEEN CURRENCIES STRENGTH AND ALERTS THE STRONGER /WEAKER PAIR BASED ON 5 TIMEFRAMES CALCULATIONS ALEERTS enable /disable using 5 time frames M5 M30 H1 H4 and D1 ( latest version You SELECT you own 5 timeframes fr

The indicator reads the current spread and displays it on the chart. The maximum value, the minimum value, the value at the time of opening the bar and the maximum value divided by 10 are displayed separately.
The indicator does not remember these values so the data will be lost if there is a change in the timeframe.
The indicator is useful for analyzing market volatility, comparing the spread between brokers and different types of accounts. By default: Red line - maximum spread; Green bar
FREE
Learn how to purchase a trading robot from the MetaTrader Market, the store of application for the MetaTrader platform.
The MQL5.community Payment System supports transactions via PayPal, bank cards and popular payment systems. We strongly recommend that you test the trading robot before buying, for a better customer experience.
You are missing trading opportunities:
- Free trading apps
- Over 8,000 signals for copying
- Economic news for exploring financial markets
Registration
Log in
If you do not have an account, please register
Allow the use of cookies to log in to the MQL5.com website.
Please enable the necessary setting in your browser, otherwise you will not be able to log in.