Watch the Market tutorial videos on YouTube
How to buy а trading robot or an indicator
Run your EA on
virtual hosting
virtual hosting
Test аn indicator/trading robot before buying
Want to earn in the Market?
How to present a product for a sell-through
Technical Indicators for MetaTrader 4 - 29

Developed by Etienne Botes and Douglas Siepman, the Vortex Indicator consists of two oscillators that capture positive and negative trend movement. In creating this indicator, Botes and Seipman drew on the work of Welles Wilder and Viktor Schauberger, who is considered the father of implosion technology. Despite a rather involved formula, the indicator is quite straightforward to understand and easy to interpret. A bullish signal triggers when the positive trend indicator (VI+ green line) crosse
FREE

Exclusive Arrival: Presenting for the First Time . This is your secret weapon for predicting which way the wind will blow with the next market shift. It assists you in developing your trading strategy by predicting the direction of the next candle. Compatible with forex, stocks, and cryptocurrencies on all timeframes, but higher timeframes are recommended. MT5 Version - https://www.mql5.com/en/market/product/108937/ How does it work ? It's pretty neat. The algorithm separates green and red can
FCK Trade Report This indicator was developed by Fx Candle King. BEFORE CHOOSE CUSTOM PERIOD, GO TO TERMINAL WINDOW (ctrl+T), right click on ACCOUNT HISTORY and CHOOSE ALL HISTORY. This report searches the filtered data in your ACCOUNT CURRENT & HISTORY TRADE, Select your timespan for the report open and closed trades etc... Chose the report type - List only OPEN orders / List only CLOSED orders / List both OPEN and CLOSED orders
FREE

The Visual Result Calculator Indicator is a powerful tool designed to enhance your trading experience on the MetaTrader platform. This intuitive and user-friendly indicator allows you to visualize potential profits or losses on a trading chart, helping you make better-informed decisions and manage your trades with precision. The Indicator displays a dynamic line on the trading chart, representing the potential profit or loss of a trade based on the start and end of the line. Simply click and
FREE

ICT Kill zone and Macros Indicator mark and display the following zone times on the chart: Kill zones Kill zone Forex Asian
London Open New York Open London Close Central Bank Dealing range
Kill zone Indices Asian London Open New York AM New York Lunch New York PM Power Hour
Macros London 1 London 2 New York Am 1 New York AM 2 New York Lunch New York PM 1 New York PM 2
Silver bullet London Open New York AM New York PM
Sessions Asian London New York
Chart The display of Kill zone ,

Our team has finally achieved the expected result.
We have created artificial intelligence for binary options trading. Don't believe? Many users have already rated it positively. The results will surprise you too. This indicator broadcasts signals for a binary option through a telegram channel. All signals are reliable and of high quality.
Read more !!! ATTENTION !!!
You didn't dream !!! HOW TO EARN RIGHT NOW? The most successful signal channel for binary options Students,
FREE
This is a general purpose indicator that displays colored lines at fixed and customizable price intervals, entered as parameters. It offers universal, constant, and familiar price ranges that allow quick and precise price analysis of a currency pair. With default parameters, this indicator implements The Quarters Theory , as described originally by Ilian Yotov . [ Installation Guide | Update Guide | Troubleshooting | FAQ | All Products ] Easy to use No optimization needed Customizable price inte
FREE

The Currency Strength Breakout indicator monitors eight currencies across M1, M5, M15, M30 & H1 time frames all in the same window.
Trade the strongest currency against the weakest with alerts for pullbacks giving you the opertunity to enter the trend. Please note: I have made the decision to give this Indicator away and many more for free with limited support so that I can concentrate on Custom EA.
View More Products - https://www.mql5.com/en/users/robots4forex/seller#!category=1
Monitoring
FREE

This is one of my first indicators. Slightly improved. The indicator is based on point and figure chart, but their period is equal to ATR indicator values. Parameters: ATRPeriod - ATR period for calculation of steps. XOPips - manual pararmetr, ATR ignoring. Note: The indicator uses closes price, thus it is recommended to consider completed bars. There is a more visual, with the display of lines on the chart and alerts, paid version of XOatrline
FREE
Concept:
This indicator will help you find Spike Bar. 1/ Check Yesterday Range (Open-Close ) 2/ Check Today pips: Price from Daily Open to current price (Bid/Ask) Then alert for you when the pips range of current candle is equal to or greater than the user defined minimum range. This indicator is related to Strategy: Daily Range Spike and Pull Back, you can find it on FFX forum
FREE

This indicator is designed based on the Moving Origin indicator
When the moving origin indicator breaks the price, this indicator gives a signal
It is useful for better viewing of signals and analysis on them
Attributes: Can be used in all symbols Can be used in all time frames Too many signals Simple and quick settings Easy way to work
Settings: period: like moving average settings alarmShow: If you want to receive an alert in Metatrader after receiving the signal, enable this setting
a
FREE
The Indicator automatically draws trend lines ( Support & Resistance Lines) when attached to any opened chart with any time frame. Button controls with on(green)/off(red) are provided to display the Support & Resistance lines of short, medium, long, very long, v.v.long trends. For ex: to display only short, long term trend lines, make sure that the short and long buttons are in green color and the remaining 3 buttons in red color. This free version works only with EURJPY pair. Please buy paid ve
FREE

The VMA is an exponential moving average that adjusts its smoothing constant on the basis of market volatility. Its sensitivity grows as long as the volatility of the data increases. Based on the Chande's Momentum Oscillator, the VMA can automatically adjust its smoothing period as market conditions change, helping you to detect trend reversals and retracements much quicker and more reliable when compared to traditional moving averages.
FREE

This indicator shows the realistic and precise trend. The plotted line as a trend indicator is the best secure place to set the stop-loss.
In case that trend is bullish you will see the plotted line under the candles and in the case of the bearish market, the plotted line is on the upper side of candles. Buy paid version of this indicator which it is Statistical Support Resistance .
FREE

A simple and highly effective Strength and Weakness currency indicator that can be used to aid your fundamental and technical analysis for winning trade decisions.
The indicator is very easy to use and can be applied to all time frames.
FX Tiger uses an advanced algorithm to calculate a score table for all major currencies. Each major currency will have a score from 7 to -7. A score of 5 and above indicates currency strength and a score of -5 and below indicates currency weakness. Once you
FREE
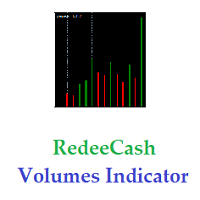
Version History : Date Version Changes 6/20/2022 1.00 Initial release 6/21/2022 1.10 Add global variables for Minimum (SYMBOL_volume_min) and Maximum (SYMBOL_volume_max) History Volumes Description : RedeeCash Volumes Indicator is the Volumes indicator that you have come to trust for market entry and exit with the added benefit of exposing key metrics as global variables. Including global variables in an indicator permits easier interaction with expert advisors (EA) and scripts. When attaching
FREE

The Point-Percent Price Channel (PPPC or PP Price Channel) indicator is designed to display on the chart a channel whose width is specified both as a percentage of the current price and in points. Its appearance is presented on slide 1. When the market moves up, the upper border of the channel is built at the price of High candles. In this case, the lower boundary follows the upper one at a strictly specified distance. When the price touches the lower border of the channe
FREE

This indicator continuously changes the color of candlestick borders and bodies, as well as the color of volumes in real time. The indicator is easy to use. The palette of colors is diverse. This product is a graphical solution, so it is difficult to describe what it does by text, it is easier to see by downloading it, besides the product is free. The indicator is suitable for bloggers who want to create a beautiful picture of a chart for video editing or traders who want to make their chart al
FREE
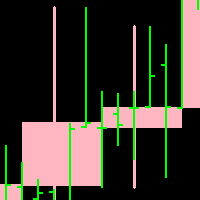
Candleline: candleline indicator. According to the specified period, draw the candle line of the specified period on the current chart. In addition, the new candlelight line is superimposed with the candlelight line of the current chart.
Note: the period of the current chart must be less than the period of the candle line to be drawn.
For the specific effect of self drawing candle line, please see the attached picture below. Parameter: 1.TimeFrame; 2. NumberOfBar; 3.Up candle
FREE

1. Monthly, weekly and daily pivots are calculated with the beginning and ending data for each period. 2. This provides an easy line on the chart to identify where the pivots are and reduces error of calculation. 3. The indicator will help define very quickly the major pivots for the instrument even if you do not understand how to calculate the pivot. 4. You can also compare weekly and daily pivots so that you can better understand the position of price. 5 This indicator will help you trade more
FREE
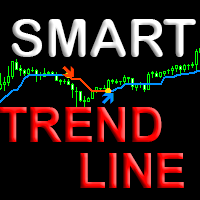
Indicator with an innovative algorithm for determining the direction of the trend. Shows the best results for determining the trend on any currency pairs, stocks, cryptocurrency without redrawing the result. It will help you immediately determine the profitability of the current pair and timeframe. Uses Price action patterns in conjunction with the author's unique algorithm. Suitable for both beginners and professionals for all types of trading. How to choose a profitable timeframe and optimize
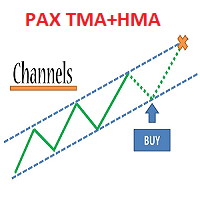
Trade system "PAX Multi TMA/HMA 8"
it is a ready-made trading system for trading on any instrument and any timeframe.
Completely ready for manual trading and use in robots.
Not redrawn.
It is convenient to work on timeframes M30, H1, H4.
Tested on metals, currency pairs, oil, international stocks, Russian stocks, cryptocurrencies, monetary and cryptocurrency indices.
What the trading system consists of:
1. The main channel of price movement named Medina. May be of 3 colors: red

This indicator helps you to find overbought and oversold prices based on William %R. Input Description: Wperiod: Period for %R indicator. OverBoughtLevel: Define the overbought level for %R. Must in between 0 and -50. OverSoldLevel: Define the oversold level for %R. Must in between -50 and -100. middle_value: When true, indicator also draw the middle points between upper and lower line. shift: Set an additional offset to the indicator.
Several Notes: Set 0 and -100 as Overbought and Oversold le
FREE

Rua Pinbar This is an indicator to help you quickly identify pinbar candles in the chart. Can be used on any currency pair and any time frame you want. This indicator is often used to determine entry points. You can refer to the product here: https://www.mql5.com/en/users/phamruacoder/seller
A product of Ruacoder Get code indicator and robot (EA) as required.
FREE

Convenient drawing of parabolic channels by four points (two lower and two upper extremums). Additional control keys: N (New) - Start drawing a new channel. C (Clear) - Deletes the current channel. By default, the current channel is the last channel. But you can click on the line of any channel to make it current. Click on the gear in the upper right corner to set some parameters for all channels or the current channel. All work is visible from the animated Gif.
Do not forget to express your w
FREE

This indicator allows you to manipulate the visibility of the chart in real time. The right side is hidden from the user. The virtual timeline can be moved to any place on the chart. Also, the indicator works on a closed market. If you are using visual analysis for trading, then this indicator is a great tool to test your strategy. It will allow you not to peep into history and be honest with yourself in analysis.
Good luck!
FREE
Every experienced trader knows that the trend lines should be paid the special attention in Forex trading. But plotting trend lines takes time, and there can be many of them on the charts… Do you want to learn how to quickly and easily automate this process? Then read on. There is a solution — smart and reliable trend line indicator, the Automatic Trendline . All you need to do is attach the indicator to the chart, and it will draw all possible trend lines for you. You just have to admire the re

Because style matters I know how annoying it is to click properties every time to change the candle’s color, the background to light or dark, and put or remove the grid. Here is the solution with one click: Three customizable buttons to choose the candle style that traders want. One button to switch between Day and Night mode. One button to show or hide the Grid on the charts. *****On the settings, you can choose where the buttons should be displayed on the screen***** Please consider checking
FREE
ATR on Prices is simply an ATR indicator that plot a line for Resistance and Support using the Average True Range calculation. You can set the ATR daily periods, to be calculated. As well you can set the reference price to add and subtract the ATR measure to obtain the ATR Top and ATR Bottom lines, using the Open Price (that is fixed) or the Middle (HL/2) price (that will vary on the day) Or adding the ATR to the daily low and subtracting it from the daily high . You can use full ATR measure or
FREE

Ska ZigZag Line indicator determines the overbought and oversold regions within a trend. The indicator determines the overbought region by the candlestick high and the oversold region by the candlestick low in a form of a line. To utilize the full strategy i recommend using "Ska ZigZag Line" together with "Ska ZigZag BuySell". NOTE: This indicator is a line based indicator. HOW TO USE: Sell Signal; Place a sell trade when the Ska ZigZag BuySell indicator arrow appear on top of the Ska ZigZag Lin
FREE
The R Stoploss Signals indicator is based on a trend following exponential moving average. This forex indicator generates buy and sell trading signals in the form of blue and red lines drawn on the activity chart. Blue colored lines indicate the trend is upwards and this is a signal to buy the currency pair. Red colored lines indicate the trend is downwards and this is a signal to sell the currency pair. A suggested stop-loss line is also included with this forex indicator. For buy signals, put
FREE

After 7 years I decided to release some of my own indicators and EAs for free.
If you find them useful please Show support with a 5-star rating! Your feedback keeps the free tools coming! See other my free tools as well here
_________________________________ Volume Moving Average (Volume MA) Indicator for Advanced Forex Market Analysis Introducing the Volume Moving Average (Volume MA) Indicator, meticulously developed in MQL4, a pivotal tool for enhancing your forex trading str
FREE

Important!! ZO Trend MTF can't work on MN and W1 timeframe. /*--------------------------------------------------------------------------------------------------------------------------------------------------------------------------------------------- ZO TREND : https://www.mql5.com/en/market/product/49138 ZO Trend MTF an indicator used to search for entry point. With the session candle algorithm on many timeframe, ZO Trend creates an area for traders find good Entry Point. ZO SYSTEM BASIC SET

This indicator draws regular bullish and bearish divergences in real-time onto the charts. The algorithm to detect those divergences is based on my 10+ years experience of detecting divergences visually. The divergences are drawn as green and red rectangles on the charts. You can even do forward testing in the visual mode of the strategy tester. This FREE Version is restricted to EURUSD and GBPUSD. The full version without restrictions is here: https://www.mql5.com/en/market/product/42732
Para
FREE

Rainbow MT4 is a technical indicator based on Moving average with period 34 and very easy to use. When price crosses above MA and MA changes color to green, it’s a signal to buy. When price crosses below MA and MA changes color to red, it’s a signal to sell. The Expert advisor ( Rainbow EA MT4) based on Rainbow MT4 indicator, as you can see in the short video below is now available here .
FREE
Seamlessly switch between different pairs from one window, while maintaining your current chart template across all pairs. This tools simply obtain all pairs in your market watch window and grant you the ease of switching between them from one window while maintaining your current chart setup and all loaded indicators and chart objects across all the pairs available in your market watch window.
FREE

This indicator can display 1 or 2 MACD indicator on different time-frames and settings. Uses EMA for calculation. The active indicators can give visual and sound alert on zero-level-cross if the user choose that option. Alert can be set on one or both active indicator, even if the time-frame, and the period different on each. When alert set to both, the two MACD histogram must be on the same size of the 0 level to get an arrow. There is a display panel with buttons on the main chart, what is sho
FREE
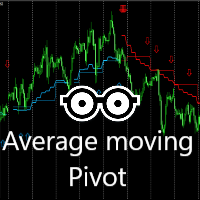
This indicator is very effective for trading everyday. A combination of moving averages and 2X Pivots calculation to produce a very convincing signal everyday. Blue colour signals a buy opportunity. Follow the arrows for possible buy points. The Blue pivots and average line, serves as possible support. Red colour signals a sell opportunity. Follow the arrows for possible sell points. The Red pivots and average line, serves as possible resistance. Best use on the 15 minutes, 30 minutes or 1 hour
FREE

The Choppy Market Index (CMI) is an indicator of market volatility. The smaller the value of the indicator, the more unstable the market. It calculates the difference between the closing of the last bar and a bar n periods ago and then divides that value by the difference between the highest high and lowest low of these bars.
Features Easily separate trends from the market noise The indicator is non-repainting. Returns CMI values through buffer. (see below)
Inputs Period: The number of perio
FREE

I recommend you to read the product's blog (manual) from start to end so that it is clear from the beginning what the indicator offers. This multi time frame and multi symbol indicator scans for engulfing and tweezer formations. The indicator can also be used in single chart mode. Combined with your own rules and techniques, this indicator will allow you to create (or enhance) your own powerful system. Features Can monitor all symbols visible in your Market Watch window at the same time. Ap

I recommend you to read the product's blog (manual) from start to end so that it is clear from the beginning what the indicactor offers. This multi time frame and multi symbol indicator scans for pin bars. Combined with your own rules and techniques, this indicator will allow you to create (or enhance) your own powerful system. Features
Can monitor all symbols visible in your Market Watch window at the same time. Apply the indicator to just one chart and instantly monitor the entire market.

Record Session High Trader uses the concepts of within candlesticks trading to gauge when a trend might be wearing out and therefore ready for reversal or pause simply by looking at the candles. We call it a record session high when we get 8 or more previous candles that have higher closes. We call it a record session low when we get 8 or more previous candles that have lower closes. We don't rely on the typical Oscillation Indicators for recognizing overbought or oversold but more we rely on lo
FREE
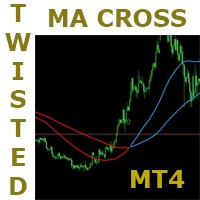
This is a very simple but very powerful strategy. It has a lot of potential. This strategy is based on the popular moving average crossover but with a very interesting twist to it. It has some mechanisms to delay signals untill direction is clear and confirmed. Follow the indication colors and arrows for trade ideas It has a potential winning rate of somewhat greater than 70%. Try it in all timeframes and determine which one is good for you. ===========
FREE

This is a unique tick chart indicator for MetaTrader 4 platform. The software is capable to graphically display the last 100 ticks and in addition to that it displays the current spread, bid / ask and time values in an elegant IceFX style dashboard. The indicator is an efficient tool for traders using M5 or even M1 timeframe.
Indicator parameters: Corner - corner of panel CornerXOffset - horizontal offset from the corner CornerYOffset - vertical offset from the corner ChartType - type of cha
FREE
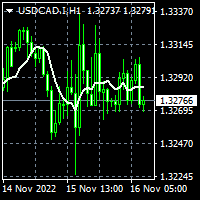
To download MT5 version please click here . Metatrader users are limited to few moving average types. Therefor I decided to create a package consisting of all MAs I knew. This package suggests 12 different types: { SMA, EMA, DEMA, TEMA, WMA, VWMA, SMMA(RMA), HullMA, LSMA, ALMA, SSMA, TMA } You can configure them via input tab. This is a non-repaint indicator with light load. To implement them I referred to standard libraries of pine script.
FREE

This indicator is an interpretation of the values of the classic indicator - RSI. A filter is used to smooth the sharp fluctuations of the indicator values, eliminating the weak changes and focusing the trader's attention on strong fluctuations of values. The indicator is not redrawn on completed bars. For greater efficiency of this indicator, it should be used in conjunction with the indicators that identify the trend direction, as well as support/resistance levels. Signals: Histogram crossing
FREE

This indicator calculates how much has an instrument won or lost in percentage terms on each bar displayed in the chart. [ Installation Guide | Update Guide | Troubleshooting | FAQ | All Products ]
Identify market patterns Find decisive price movements Be suspicious about overbought/oversold situations It is an extremely easy to use indicator... The blue histogram represents winning bars The red histogram represents losing bars The gray line represents the average win/loss per bar
Labels are
FREE
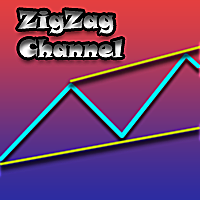
Exclusive Channel on Zig Zag is a channel indicator for the MetaTrader 4 terminal. This indicator plots a channel based on the peaks of the standard ZigZag indicator. If you trade using the ZigZag indicator or channels, then Exclusive Channel on Zig Zag will suit you perfectly.
Advantages of Exclusive Channel on Zig Zag The indicator is perfect for scalping and intraday trading. Suitable for beginners and experienced traders. Works on any financial instruments and markets. Works on all timefra

The indicator marks the points on the chart where the standard ZigZag indicator has drawn its top or bottom. With this indicator, you can easily understand where the top or bottom was formed, and where it was redrawn. The indicator gives an alert when a new point appears. Warning! Parameter Applied Price - expands the possibilities of building the indicator. It is possible to build at OPEN, CLOSE and standard HIGH/LOW prices. Input parameters ----------- Depth - period of the ZigZag ind
FREE

Hello. Another free indicator from Sepehr! ;) You can determine the trend with this tool. Using crosses of two Moving averages, you can say that the trend is going to be bullish or bearish; A fast-moving average and a slow one. When the fast-moving crosses up the slow-moving, it's going to be an uptrend and when it crosses down the slow-moving, it means that you are going to have a downtrend. That's easy ;) Hope to enjoy it Sepehr(Faran)
FREE

This creative simple indicator will provide a precise framework for market sentiment within technical analysis of different timeframes. For instance, for traders like me that uses "Mark Fisher" strategy regularly, this is a perfect indicator for having an insight to markets from short term to long term point of view, using Break points of candles' lows and highs and perfect to combine with "Price Action" . For more options and modifications you can also edit the low timeframe candles withi
FREE
Indicador Gratuito desarrollado por Mr Beast Inversiones Mr Beast : Gestión de riesgo profesional. Brindo a la comunidad la entrada a productos de M Beast. Echar un vistazo a mis señales y expert advisors. Descuentos de hasta 70% Diclaimer: La negociación en Forex, CFD y Opciones conlleva un riesgo de pérdida sustancial y no es adecuada para todos los inversores. El alto grado de apalancamiento puede actuar en su contra y también en su favor, Antes de decidirse a operar en productos tan apalanca
FREE

The implementation of the impulse system described by Dr. Alexander Elder. The indicator colors the bars according to the following pattern: Moving average and MACD histogram increase - green bar, it is forbidden to sell; Moving average and MACD histogram have different directions - blue bar, the ban is removed; Moving average and MACD histogram decrease - red bar, it is forbidden to buy.
Indicator Parameters EMA - period of the indicator's moving average MACD Fast - period of the fast moving
FREE

Draws Daily, Weekly and Monthly pivots and the respective supports and resistances levels (S1, S2, S3, R1, R2, R3). Ideal for placing stop losses and/or using as a break-out strategy. Features Unlike other pivot indicators in market you get very clean charts. Pivot levels are plotted irrespective of timeframe, on which you trade, i.e. M1, M5, M15, M30, H1,H4 or Daily timeframes. Pivot levels do not change when you change timeframe. Fully customizable options. If you are looking at Fibonacci
FREE
Analyzing of multiple charts has always been one of the biggest challenges for professional traders. However, this can be overcome by increasing the number of monitors. But we'll give you a simple, cost-effective solution here.
A simple Solution ISO Charts Organizer (Chart Clipper) allows you to categorize a large number of open charts without having to increase the number of monitors and easily access them all quickly or enjoy auto switching feature.
All features that you need Charts can be

Gold Pro MT4 is a trend indicator designed specifically for gold and can also be used on any symbol. The indicator does not redraw and does not lag.
Free Dashboard : monitor All pairs and timeframes here: https://www.mql5.com/en/market/product/60431 SETTINGS Factor 1: use to calculate different methods of drawing indicator line Factor 2: use to calculate different methods of drawing indicator line AlertByPopup - true/false popup alerts. AlertBySound - true/fals
This Dashboard is free to download but is dependent on you owning the Flag Trend Pro MT4 indicator. Down load the indicator: Flag Trend Pro
The Dashboard will show you on a single chart all the timeframes (M1 to Monthly) with their own status for the indicator: Gold Pro MT4
all time frame and all symbol: smart algorithm detects the trend, filters out market noise and gives entry signals!!!
How to understand the status: symbol - Fill All the Pair what you want. M1, M5, M1
FREE

BeST_ADX Scalping Strategy is an MT4 Strategy of an Entry and Exit Signals Indicator based on the ADX values that is an excellent tool for scalpers to scalp the currency market multiple times a day for profit .
It is built mainly for scalping purposes although it can also be used as a breakout indicator . Its Signals produce a complete and standalone trading system of impressive results . The indicator comes with a new enhanced Real Time Updated Info and Statistics Panel that can improve its ov

This indicator resolves an unrecognised defect in the Commodity Channel Index Oscillator (CCI). The CCI is based on a high pass filter calculated by subtracting the p-period simple moving average of a price signal (usually typical value) from the price signal itself. Then, the result is divided by the absolute mean deviation of the same period. The frequency response of a signal minus its simple moving average is shown in the first screen shot (in Blue). (see my free indicator : Q n D Frequency
FREE

This is Fibo Expansion. You can use it, as profit target at any level... It use price Highs and Lows and price between... It is simple and easy to use... No Input menu, just drag it on your chart and it ready to use... The blue and red dot color indicate it direction... It also use as the same as fractal high and low price as the points to construct the levels... No more analysis to choose the points..
FREE

Harami is a two candle pattern with recent candle formed inside the previous candle's high and low . It represents indecision in the market and is used for breakout price action trading strategy. This indi fires all signals to a dashboard on the chart including pop_up alert, push to phone notification and email. Harami has two types, bullish and bearish pattern. Enter long for bullish Harami and enter short for bearish Harami. Inputs : Currency Symbols: EURUSD,GBPJPY,USDJPY,USDCAD (default) , u
FREE

Check out other great products from https://www.mql5.com/en/users/augustinekamatu/seller
This indicator is the best so far at determining the currency strength of each pair. It provides stable values and is highly adaptive to market changes. It is a great tool to add to your arsenal to make sure you are on the right side of the trend at all times. No inputs required, it is simple plug and play. A Winning Trading Strategy This article describes the components and logic needed to develop a tr
FREE

The purpose of this new version of the MT4 standard indicator provided in your platform is to display in a sub-window multiple timeframes of the same indicator. See the example shown in the picture below. But the display isn’t like a simple MTF indicator. This is the real display of the indicator on its timeframe. Here's the options available in the FFx indicator: Select the timeframes to be displayed (M1 to Monthly) Define the width (number of bars) for each timeframe box Alert pop up/sound/ema
FREE

The gravity line indicator to which the price always returns. This is a kind of center of attraction and a magnet for price. Allows you to trade on the trend and on pullbacks. It works on all timeframes, on any currency pairs, metals and cryptocurrency Can be used when working with binary options
Distinctive features Does not redraw its values; Price always returns to the line of gravity; Based on the laws of balance; It has simple and clear settings; It works on all timeframes and on all symb
FREE

Necessary for traders: tools and indicators Waves automatically calculate indicators, channel trend trading Perfect trend-wave automatic calculation channel calculation , MT4 Perfect trend-wave automatic calculation channel calculation , MT5 Local Trading copying Easy And Fast Copy , MT4 Easy And Fast Copy , MT5 Local Trading copying For DEMO Easy And Fast Copy , MT4 DEMO Easy And Fast Copy , MT5 DEMO
Strongly recommend trend indicators, automatic calculation of wave standard and MT5 ve
FREE
The indicator shows the High and Low levels of candles for timeframes selected in the settings. It is recommended to use it on smaller timeframes to determine the levels of higher timeframes.
Parameters TYPE_LINE - type of the line (short based on the bar time, or long for the entire chart) ============= TF 1 ============= block of lines for the first timeframe TF_1 - timeframe of the first block of lines Bars_1_from=1 - Bar of the beginning of the line of the corresponding Timeframe. Bars_1
FREE

Wicks UpDown Target GJ
Wicks UpDown Target GJ is specialized in GJ forex pairs.
Choppy movement up and down on the opening range every day. Trading breakouts on London session and New York session is recommended.
Guideline Entry Strategy Idea:
Step 1 - Breakout Forming (Warning! Trade on London Session and New York Session) Step 2 - Breakout Starting (Take Action on your trading plan) Step 3 - Partial Close your order & set breakeven (no-risk) Step 4 - Target complete Step 5 - Don't tr
FREE

The purpose of this new version of the MT4 standard indicator provided in your platform is to display in a sub-window multiple timeframes of the same indicator. See the example shown in the picture below. But the display isn’t like a simple MTF indicator. This is the real display of the indicator on its timeframe. Here's the options available in the FFx indicator: Select the timeframes to be displayed (M1 to Monthly) Define the width (number of bars) for each timeframe box Alert pop up/sound/ema
FREE

KF Trix V1.00 The triple exponential average (TRIX) indicator is an oscillator used to identify oversold and overbought markets and is also a momentum indicator. The triple smoothing of moving averages is designed to filter out price movements that are considered insignificant or unimportant. About Software details and MQL login link Copyright 2022, Forex KRAL
FREE

Candle size oscillator is an easy to use tool to figure out candle size from highest to lowest price of each candle. It's a powerful tool for price action analysts specifically for those who works intraday charts and also a perfect tool for short term swing traders. Kindly note that you can also edit the Bullish and Bearish candles with different colors.
#Tags: Candle size, oscillator, price action, price range, high to low, candle ticks _________________________________________________________
FREE
MetaTrader Market - trading robots and technical indicators for traders are available right in your trading terminal.
The MQL5.community payment system is available to all registered users of the MQL5.com site for transactions on MetaTrader Services. You can deposit and withdraw money using WebMoney, PayPal or a bank card.
You are missing trading opportunities:
- Free trading apps
- Over 8,000 signals for copying
- Economic news for exploring financial markets
Registration
Log in
If you do not have an account, please register
Allow the use of cookies to log in to the MQL5.com website.
Please enable the necessary setting in your browser, otherwise you will not be able to log in.