Watch the Market tutorial videos on YouTube
How to buy а trading robot or an indicator
Run your EA on
virtual hosting
virtual hosting
Test аn indicator/trading robot before buying
Want to earn in the Market?
How to present a product for a sell-through
Technical Indicators for MetaTrader 4 - 17

Simple Trading System Update !!! Follow this link to see our 2024 Strategy !!! ( Download the EAs scanner )
INTRODUCTION : The strength meter is an trading tool that is used to identify trending and consolidating markets based on the percentage rate.
HOW TO USE IT :
You can use this indicator with Deal Trading Trend >> Click Here << To use this trading tool to identify trending and consolidating markets (the most important part)
FREE

The Supertrend Line indicator shows you the trend using calculation based on the ATR.
How does it work? The Supertrend draws a line following the current trend, this line is the result of calculation made with the ATR. A Line under the candle means a likely bullish trend A Line above the candle means a likely bearish trend
How to trade with CSL indicator Buy when the Supertrend line is below the price, Sell when the Supertrend line is above the price. It is strongly suggested to use this ind
FREE

*This is TradingView indicator converted to mql4*
The SuperTrend V indicator is a popular technical analysis tool used to identify trends and potential trend reversals in financial markets. It is based on the concept of the SuperTrend indicator but incorporates additional features and variations. The SuperTrend V indicator uses a combination of price action and volatility to determine the trend direction and generate trading signals. Here are the key components and features of the indicator:
FREE

Trend Filter Pro
Trend filter indicator.
Very good filter for your trading system, I recommend to use it together with - System Trend Pro and Professional Trade Arrow
The indicator no repaint!!!
Settings:
Change the Period parameter for better filtering ( default is 90)
Any questions? Need help?, I am always happy to help, write me in private messages or
In Telegram: https://t.me/Trader35_Admin
FREE

The indicator looks for buying and selling zones, where a deal can be opened with a minimal stop loss and a better Risk Reward Ratio. The indicator is based on qualitative search of the Double top/Double bottom pattern. This version works only on USDCAD! The full version of the indicator can be purchased here - https://www.mql5.com/en/market/product/29820
Indicator operation principle Looks for local tops/bottoms which can potentially become a Reversal zone It waits for an impulse movement tha
FREE
MTF Fair Value Gaps Alerts indicator is based on Fair Value Gaps (FVG), Volume imbalance (VI) and Gaps. This indicator will create 2 arrows pointing to the left showing the area of the FVG, VI and Gaps and will never repaint after the candle has been closed .
Inputs: TF (Timeframe of the Alert For Current timeframe use CURRENT)
barshilft : the barshift needs to be the same timeframe as the above TF. barshift format (CURRENT, M1, M5, M15, M30, H1, H4, D1, W1, MN) Send Email: Audible Alert Push
This program will make analysing multiple timeframes more convenient.
It will help to sync all charts in a different Timeframe sync charts to show same symbol, same specific time period and sync drawing objects Show on all charts at the same time
How to use it >> https://youtu.be/NEHUW7v1h1c In this edition there are only 6 object types that can be synced all chart. Drawing Object Type Support : Vertical/Horizontal Line, Trendline, Rectangle, Arrow, Fibo-Retracement
Additional Featu
FREE

Draw and Sync Objects Multiple Charts 1. Draw objects by key press. ( You must: 1. Press Function key => 2. Click where you want to draw => 3. Draw it => 4. Press ESC to complete). (If you don't want to draw after pressing function key, you must press ESC to cancel). 2. Developing : Sync selected objects to multiple charts by button. 3. Developing: Hide objects that do not belong to the current symbol (Objects drawn with this indicator will belong to the symbol they are plotted
FREE
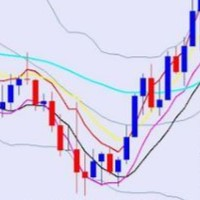
BBMA Terdiri dari indikator BB dan 5 Moving Averages, BBMA Oma Ally (OA) merupakan sistem trading buatan seorang trader asal Malaysia bernama Oma Ally. Setelah melalui penelitian dan pengujian selama bertahun-tahun, beliau membantu banyak trader sejak 2010 dengan sistem ciptaannya ini.
Di kalangan trader Indonesia sendiri, BBMA OA sudah mulai populer sejak beberapa tahun lalu. Saking populernya, sistem trading ini sampai mempunyai komunitas khusus gabungan trader dari beberapa negara.
Men
FREE

Double top and bottom indicator is a pattern scanning indicator which scans the tops and bottoms using zig zag pattern. When it find price bouncing back from the same point twice after a long trend then it generate arrow signals whenever the last resistance points is broken for double bottom and last support price broken for double top. Unlike other top bottom scanner it does not give only 1 signal. it alerts user when ever the last support /resistance is broker from double top/bottom pattern un
FREE

Head and Shoulders Pattern Indicator - Your Key to Recognizing Trend Reversals Unlock the power of pattern recognition with the "Head and Shoulders Pattern Indicator." This cutting-edge tool, designed for MetaTrader, is your trusted ally in identifying one of the most powerful chart patterns in technical analysis. Whether you're a novice or an experienced trader, this indicator simplifies the process of spotting the Head and Shoulders pattern, allowing you to make informed trading decisions. Key
FREE

The R Inside Bar indicator for Metatrader 4 provides simple to use price breakout levels based on inside bars. It works on pure price action and does not repaint whatsoever, and pops up in the main MT4 chart window in the form of 2 colored horizontal lines above and below the actual inside bar. The green horizontal line acts as resistance and the red line acts as support. Long & short trade idea
Open a buy order if the candlestick closes above the green inside bar line and the overall trend is
FREE
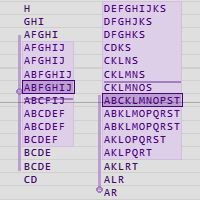
Market Profile is a graphic representation that shows price and time information as a distribution. The benefits of Market Profile include: Determine amount of time, number of ticks and volume traded at specific price levels or price ranges during a period Identify prices perceived as fair by the market Identify support and resistance levels to anticipate future price movements Each group of letters shows the price or price range where trades occured, usually in the 30 minutes chart timeframe. T

Please check the " What's new " tab regularly for a complete and up-to-date list of all improvements + parameters. FREE indicator for my trading utility Take a Break . This indicator allows you to manage multiple other EAs with just one Take a Break EA instance. Simply specify the corresponding Chart Group in the indicator(s) and Take a Break EA settings and you are good to go.
Setup example (Indicator + EA)
You want Take a Break to manage 3 other EAs: EA1 on EURUSD, EA2 on EURGBP, EA3 on G
FREE

This indicator uses the Zigzag indicator to identify swing highs and swing lows in the price chart. Once it has identified the swing highs and swing lows, it can use them to determine potential support and resistance levels. A support level is formed when the price drops and bounces back up from a swing low, indicating that there is buying pressure at that level. A resistance level is formed when the price rises and reverses downward from a swing high, suggesting selling pressure at that leve
FREE

This indicator is a simple tool to spot a possible trend.
When the ribbon below the price bars, It will turn to Green color and the trend is seen to be bullish When the ribbon above the price bars, it will turn to Red color and the trend is seen to be bearish. It can be used a either Entry Signal Exit Signal or trailing stop, so it is very versatile. By default color : Green is UP trend and Red is Down trend and this work perfect with Bar4Colors.ex4
FREE

This automated DOJI BAR FINDER INDICATOR can be utilized to manage trades and identify potential areas of support and resistance for both buying and selling. It is designed to identify zones for Sell/Buy trades and can be effectively used in conjunction with other indicators, such as order block indicators, and more. Currently designed for MT4, it will later be adapted to function on MT5. We also offer the opportunity to customize the robot according to your trading strategy. https://t.me/FXTSPr
FREE

Daily pivot are relatively important in trading. This indicator have options to select 5 commonly use pivot point calculations. User input Choose Pivot Point Calculation ( Method Classic, Method Camarilla, Method TomDeMark, Method Fibonacci or Method Woodies. ) Choose Applied Timeframe for the calculation (M5, M15, H1, H4, D1, W1 etc) Can be attached to any timeframe Choose color of Pivot point For MT5 version, please refer here: https://www.mql5.com/en/market/product/38816
FREE

Defining Range ( DR ) and Implied Defining Range ( IDR ) indicator
Show DR and IDR ranges on the chart for Regular , Overnight and After Sessions
for more information how DR and IDR work and the high probability watch : https://www.youtube.com/@themas7er or https://twitter.com/IamMas7er
Remember to set set your chart TimeZone when you attach indicator to the chart under indicator settings / inputs
Volume Imbalance : https://www.mql5.com/en/market/product/91165?source=Site+Pr
FREE

Great utility tool where you can monitor in real time the Laverage of your account and the spread of the symbol This will know how to accurately identify the data, to be able to know, for example, if you have a Prop Firm account, to know the correct Laverage and if the spread is manipulated, etc. to make a precise lotage
Combination of leverage and spread indicator. Tools for automating checking the leverage and spread on your trading account. Working in All broker forex stock. Useful to mon
FREE
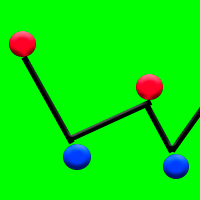
Dot scalp - shows price reversal points with 93% accuracy. Does not redraw points. Works well during sideways price movement when the market is flat. The indicator draws the points of price reversal or pullbacks on the chart.
How to use this indicator in trading? Add the Dot scalp indicator to the chart. Also download on the Internet any channel indicator that shows the channel on the chart. Wait for the sideways movement of the price, this is when the channel indicator draws a channel in t

ITS FREE I Recommend www.CoinexxBroker.com as a great broker and the one I personally use Asia session 1:00 to 9:00 (6pm est to 2 am est) Eur means London Session 10:00 to 18:00 (3 am est to 11 am est) USA means New York Session 15:00 to 23:00 (8 am est to 4 pm est) Session indicator highlights the start of each trading session. You can show all sessions or edit the settings to only show the hours you want highlighted (Asia) means Asian Session ,(Eur) means London Session , (USA) means New
FREE

RoundNumbers indicator is a simple and powerful psychological price levels. Trader usually use these levels as a Support and Resistance (SnR). Indicator Input: Levels - Numbers of levels drawn on chart. Default 30 levels. BoxSize - Box size drawn on each levels, indicate buffers around levels. Default value 1pips (10point) above and below each levels. ZoneSize - Distance between each levels, default value 10pips (100point). Style & Colours - User inputs customization.
For MT5 version, please r
FREE

O indicador criado por Didi Aguiar, o mestre das Agulhadas!
O padrão do indicador é o cruzamento de três médias móveis simples. Média rápida, período 3. Média normalizada, período 8. Média lenta, período 20.
Quando as três médias se cruzam próximas o suficiente, acontece a agulhada! Pela posição das médias é possível identificar: Agulhada de compra, agulhada de venda, ponto falso e beijo da mulher aranha.
Quer saber mais? Procure pelo site dos robôs oficiais da Dojistar: tradesystembots.co
FREE

If you like this project, leave a 5 star review. Follow on instagram: borelatech Trading large volumes requires us to look at multiple instruments/charts to
find new opportunities, this indicator will help you by plotting specific
levels by the multiple of a number or its suffix and update them automatically
as the price changes, a task that would otherwise be tedious. For example, on GBPUSD, you could have 4 instances of the indicator on the
chart to plot: Each 0.01 intervals with line leng
FREE

The purpose of this new version of the MT4 standard indicator provided in your platform is to display in a sub-window multiple timeframes of the same indicator. See the example shown in the picture below. But the display isn’t like a simple MTF indicator. This is the real display of the indicator on its timeframe. Here's the options available in the FFx indicator: Select the timeframes to be displayed (M1 to Monthly) Define the width (number of bars) for each timeframe box Alert pop up/sound/ema
FREE
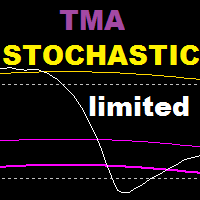
TMA Stochastic is an indicator based on stochastic oscillator and tma bands indicator , this indicator is based on a reversal strategy . Recommended time frame : 15 and above Recommended settings : lower values for scalping , higher values for swing trading WORKS ONLY ON EURUSD , GET THE FULL VERSION : https://www.mql5.com/en/market/product/108378 ======================================================================= Parameters : tma history : how many bars back to show tma bands on stochas
FREE

The ZUP is based on two ideas. Idea 1 - combine a variety of methods for identifying extremums (minimums and maximums) on the market price charts in a single indicator. Idea 2 - make it possible to easily bind various graphical tools, which allow to analyze the market behavior, to the identified extremums. To implement the first idea , the following has been made in the indicator. Included multiple ZigZag algorithms. Standard ZIGZAG algorithm. The basis of this algorithm is taken from the ZigZag

"Capture the sleeping and waking alligator." Detect trend entrance/exit conditions - this indicator can also be tuned according to your trading style. You can adjust a confidence parameter to reduce false positives (but capture less of the trend). This is based on a modification of the Alligator indicator by Bill Williams, an early pioneer of market psychology. 2 main strategies: either the " conservative" approach to more frequently make profitable trades (at a lower profit), or the " high r
FREE
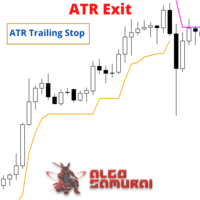
The ATR Exit indicator uses the candle close + ATR value to draw trailing stop lines (orange under buys, magenta over sells) that advance with the trend until the trend changes direction. It uses a multiple of the Average True Range (ATR), subtracting it’s value from the close on buy, adding its value to the close on sell. Moreover, the trailing stop lines are generated to support the order’s trend direction (long or short): In an upward trend, the long trailing stop line (orange line under bu
FREE

Pullback Viewer is designed to show valid pullback points in a bearish or bullish trend.
What is considered a valid pullback?
A valid pullback needs to have a body close outside the previous candle high (in a bearish trend ) or previous candle low (in a bullish trend ). If the candle wicks out the previous candle, it's not a valid pullback.
Pullback must liquidate the previous candle with a clean candle body close.
When is this indicator useful?
It's useful to under
FREE

This indicator is not only for trading but also for learning, thanks to it, you can learn to identify trend, support and resistance.
You've probably heard about the Dow trend theory, where higher highs and higher lows indicate an uptrend, and lower highs and lower lows indicate a downtrend. This indicator determines this trend based on the Dow Theory. You just need to enter a number representing the number of candles between extremes. The optimal solution is the number 3 (H1 TF), unless you
FREE
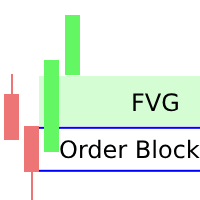
I've combined two trading strategies, the Order Block Strategy and the FVG Trading Strategy, by utilizing a combination of the FVG indicators and Order Blocks. The results have been surprisingly effective.
This is a two-in-one solution that makes it easy for traders to identify critical trading zones. I've optimized the settings so that all you need to do is install and trade; it's not overly complex to explain further. No need for any usage instructions regarding the trading method. You shou

In the trading world, a trend that follows a 45-degree angle is considered sustainable. However, accurately measuring this critical angle remains a challenge as there is no clear method described. Traders can only guess how it is calculated, how many candle counts there should be, and what the appropriate chart zoom is.
We have solved this problem and defined all the conditions logically, and now presenting you Trend Angle 45. It is a tool that visualizes the 45-degree trend line based on a

The indicator draws levels for every day. If you enter yesterday's green zone - buy, and if you enter yesterday's red zone - sell.
Stop 20 pips. Target 20 pips or more.
Just place your orders and wait.
Pairs to trade: EUR/USD No special skills required. The algorithm calculates everything by itself.
The success rate is good. Simple, but yet effective! Check the demo!

This indicator draws the prior Highs and Lows for multiple timeframes, and can display potential Take Profit and Stop Loss levels. In Rob Smith's # The Strat terms, these are potential entry points, or alternatively potential targets for open positions. I like to use them in both ways. On a lower timeframe, say 5 minutes to get a good entry on a daily or weekly level, and then as a potential target. Very small stops required giving an excellent risk/reward ratio. Please watch the DEMO video

This indicator will draw a label above or below each candle based on Rob Smith's The Strat as they develop over time on your chart.
As price evolves, a candle can switch between three states. When the candle first opens, if it sits completely within the previous candles high and low, then it will start as a Type 1. As time moves on, if it breaks either the high or low of the previous candle, it will be come a type 2, and should the price action be volatile and directionless, it may then

Time Range Separator is a useful tool to display a separator period on your platform. You could go in the properties of the indicator, select the desired range and that's ALL. We believe it is a useful and necessary that we wish to share with you for free all our followers.
Input Values: TimeFrame Period Separator GMT_Hour (ex. +1 or -1) to move the lines at Period Time +/- tot hours in input Hide_dates to show or hide the datetime on vertical lines VLine_Color = Vertical Color Line VLine_Styl
FREE

Or ( BD% ) which is a volatility index that measures volatility in percent rather than points. The idea of BD% is to make an index depending on the Classic Standard Deviation (CSD) that moves between 0 and 100 percent.
You can use BD% to compare volatility for the same security in different time periods or different time-frames. In addition, you can use BD% to compare volatility between different securities in different markets in terms of percent rather than points.
HOW TO USE "BD%"
I

This is a volume profile where you can customize the time period you want. You can do this with a line or choose automatic functions such as showing the volume from the last time period. The indicator also shows the maximum volume value (VPOC - VOLUME POINT OF CONTROL) and the average value, colors and settings you can adjust as you like, there are many possibilities. If you need an indicator that shows the constant volume time frames there is ...HERE... Volume Profile is an advanced charting

This is Free product you are welcome to use for your needs! Also I very appreciate your positive feedbacks! Thanks a lot! // More great Expert Advisors and Indicators are available here: https://www.mql5.com/en/users/def1380/seller // Also you are welcome to join to profitable , stable and reliable signal https://www.mql5.com/en/signals/1887493 Forex Indicator Spread Display for MT4 , Trading Support . Spread Display indicator shows current spread of forex pair where it is attached. I
FREE
This indicator shows you the angle of the moving average according to your settings in a separate window. It also shows the angle written on the chart, which can also be adjusted. The main features and input variables provided include: MAPeriod: This is the period for your moving average. The default MAPeriod is 5. LookBack: This is a very important variable. It allows you to set the look back bar, from which the angle will be measured. For example, if your LookBack is 5, then indicator will cal

5/10 copies at 30$ ---> next 50$ // MT5 version Forex Vigor is a technical indicator that assesses the momentum strength of the 8 primary currencies (EUR, GBP, AUD, NZD, USD, CAD, CHF, JPY). The indicator relies on mathematical calculations that measure the lack of correlation among 28 currency pairs. To calculate their values, it analyses the percentage difference between the closing prices using the Linear-weighted averaging method (LWMA) plus a statistical system that eliminates values that

PURCHASE THIS INDICATOR AND GET OUR SECRET BONUS! Why is TREND Important? This is one of the biggest questions asked by beginner traders. Trend is important because that is primarily when the market moves the most. When a market has good volume, many banks, hedgefunds and large institutions are participating and driving price up or down in strong trends. THIS IS THE PERFECT TIME TO TRADE. The uGenesys Multi-Trend Indicator was specifically designed to identify when a trend has started in the ma

This indicator shows the breakeven line level for the total number of open positions of the current symbol with P/L value and total volume. This indicator is helpful to decide the exit level when using a trading grid strategy. The style of the breakeven line is customizable to choose the color, line shape and font size of the positions description. Send mobile notification when crossing a positive P/L target
FREE

If you trade Forex, having detailed information about the currency strength and currency pairs correlation can take your trading to new heights. The correlation will help to cut your risk in half, and strength analysis will help to maximize the profits. This indicator provides a hybrid approach for selecting the most appropriate currency pairs using the strength analysis and currency pairs correlation.
How to use the Currency Strength Analysis
Suppose your trading strategy provides a buying o

The Supply and Demand Zones indicator is one of the best tools we have ever made. This great tool automatically draws supply and demand zones, the best places for opening and closing positions. It has many advanced features such as multi timeframe zones support, displaying the width of zones, alert notifications for retouched zones, and much more. Because of market fractality, this indicator can be used for any kind of trading. Whether you are a positional, swing, or intraday trader does not ma
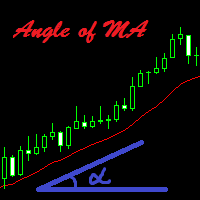
The indicator calculates the inclination angle of the Moving Average and displays the result on the screen. Users can select the start and end points to measure the inclination of the MA. It is also possible to set the angle value, and if the inclination angle exceeds the specified value, the indicator will play a sound alert and display a message on the screen.
Configurations Left_Shift_of_MA=1; - Shift of the MA to calculate the inclination angle (start point) Right_Shift_of_MA=0; - Shift of

Volatility Limit Trend Indicator (VLT), an original indicator by this developer, is a trend indicator based on setting a fixed volatility limit as a percentage of price. Volatile price is allowed to wander between two channel lines defining the fixed volatility about a central line. The price crossing one of the channel lines defines an exceeding of the allowed volatility, and ushering in one of two situation : either a continuation or a reversal of trend. The first buffer of the indicator (not
FREE

This is an unconventional version of the Heiken Ashi Smoothed indicator implemented as lines rather than a histogram. Unlike a usual histogram, the indicator draws the readings of the two moving averages in the form of colored lines.
Example If the candle crosses two indicator lines upwards, a trend is assumed to be changing from bearish to bullish. If the candle crosses two indicator lines downwards, a trend is assumed to be changing from bullish to bearish. The indicator is good at displayin
FREE

Inspired from, Time is the most important factor in determining market movements and by studying past price records you will be able to prove to yourself history does repeat and by knowing the past you can tell the future. There is a definite relation between price and time. - William Delbert Gann
CITRA BOT is a Price Action/Price Pattern detection Indicator which uses historical data to validate a current pattern or profile to predict the probability of hitting future resistance or support l

The Th3Eng PipFinite indicator is based on a very excellent analysis of the right trend direction with perfect custom algorithms. It show the true direction and the best point to start trading. With StopLoss point and Three Take Profit points. Also it show the right pivot of the price and small points to order to replace the dynamic support and resistance channel, Which surrounds the price. And Finally it draws a very helpful Box on the left side on the chart includes (take profits and Stop loss

. Simple Trading System Update !!! Follow this link to see our Strategy !!! (With auto trade indicator)
Description This is an indicator Free Version and showing only history signals, Not real time. Binary Deal Trading Indicator is an indicator on MT4 for Binary Option Trading. It forecasts the overbought / oversold level, Reversal and Fractal point. This indicator will help you to decide a reversal price on any time frame (Recommend M1, M5 and M15). The expiry time is 5-15 minutes after re
FREE

The Pivot Indicator is a vital tool for technical analysis used by traders in the financial markets. Designed to assist in identifying potential reversal points or trend changes, this indicator provides valuable insights into key levels in the market. Key features of the Pivot Indicator include: Automatic Calculations: The Pivot Indicator automatically calculates Pivot Point, Support, and Resistance levels based on the previous period's high, low, and close prices. This eliminates the complexity
FREE

The trends that you see on the charts are not always trends or, more precisely, trends on which you can make money. The point is that there are two kinds of trends: 1) true trends that are caused by fundamental economic reasons that are stable and, therefore, can provide a reliable profit for the trader; 2) and there are false trend sections that only look like a trend and arise due to chains of random events - moving the price (mainly) in one direction. These false trend sec

The Breaker Blocks with Signals indicator aims to highlight a complete methodology based on breaker blocks. Breakout signals between the price and breaker blocks are highlighted and premium/discount swing levels are included to provide potential take profit/stop loss levels.
This script also includes alerts for each signal highlighted.
SETTINGS
Breaker Blocks
Length: Sensitivity of the detected swings used to construct breaker blocks. Higher values will return longer te

This is the only Indicator you need to navigate TIME and PRICE . Here I present to you: ICT Killzone Gem Indicator . This indicator will SAVE YOU TIME marking up the charts so you can FOCUS more on your Trades. You can customize it however you like. There is also a toggle switch where you can toggle on or off a specific part so that you can make your charts clean. Watch the video for a Full Explanation . Leave a Review about your experience with this Indicator : ) Inside the Indicator:
2

The "Scalper Arrows" indicator is designed for the scalping method of trading within trend directions.
Operating principle of the indicator.
Large arrows indicate the direction of the trend.
Red arrows - for bearish direction, Green arrows for bullish.
Within a bullish or bearish trend, there is an algorithm for generating scalping signals in the form of small arrows.
Also, trend direction lines are drawn in the direction of the trend, and small arrow signals are generated in their direct

This is a modified Fractals indicator. It works similar the original Bill Williams' indicator, and is additionally enhanced with the possibility to change the top radius, in contrast to the standard radius of 2 bar. Simply put, the indicator checks the top and if it is the minimum/maximum in this radius, such a top is marked by an arrow. Advantages Adjustable radius. Use for drawing support and resistance levels. Use for drawing trend channels. Use within the classical Bill Williams' strategy or
FREE
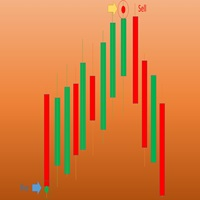
Wave Entry Alerts Oil is a custom indicator developed by Azad Gorgis for MetaTrader 4. This indicator is designed to provide alerts based on ZigZag patterns, specifically tailored for trading on the Oil (XIT/USD) symbol.
Key Features: - Chart Window Indicator: The indicator is designed to be displayed on the main chart window. - Arrow Signals: The indicator generates arrow signals on the chart, indicating potential reversal points based on ZigZag patterns. - Customizable Parameters: Traders c
FREE

Stop searching for and trying new indicators! Get Winshots Massive FX Profits indicator and set yourself apart from the crowd. Years of trading experience led us to the building of this all in one indicator! Trade like the pro with Winshots Massive FX Profits!
This indicator uses the following methodologies to help you become a more consistent profitable trader:
- MARKET VOLUME PROFILE
- DAILY CANDLE OUTLINE
- ATR LEVELS
- DAILY PIVOTS LEVELS
- PRICE CYCLES ANALYSIS
What is VOLUME P
NOTE : This Free version only works for the EURUSD & AUDUSD Symbol !
MT4 Version Available Here: https://www.mql5.com/en/market/product/43555
MT5 Version Available Here: https://www.mql5.com/en/market/product/50048
Telegram Channel & Group : https://t.me/bluedigitsfx
V.I.P Group Access: Send Payment Proof to our Inbox
Recommended Broker: https://eb4.app/BDFXOsprey *All In One System Indicator, Breakthrough solution for any Newbie or Expert Trader! The BlueDigitsFx Easy 123 Sy
FREE
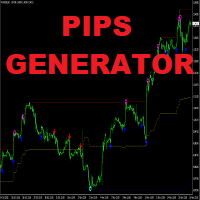
Apollo Pips Generator is a channel based indicator which provides entry signals in the direction of the trend. The indicator provides multiple entry points so you can always find a trading opportunity to profit on. The tool also provides you with clear exit signals in a form of stars. ALL SIGNALS DO NOT REPAINT! The indicator can be used with any forex pair and time frame. The indicator provides all types of alerts including PUSH notifications. PLEASE CONTACT ME AFTER PURCHASE TO GET TRADING IN

M1Arrows is a MT4 trend arrows Indicator
* Smart Scalper Setup (M1) :: Signal 5 Main 20 + Signal 20 Main 80 + Fibonacci ZigArcs 20
(Screenshot1) Add the indicator with first setting,
then add it again to the same graph with other settings.
You can add as many as you want, but 2 M1Arrows in just one graph is enought
Never open orders againt the slow setting trend
Do not open more than 3 orders per slow setting trend
It will work better in Europe/USA markets, * M15 Day Trade Setup: Sig
FREE

Ichimoku Trend Finder is a multi symbol multi timeframe trend dashboard that helps traders to monitor and identify potential market trends from one chart. This panel scans the Ichimoku Kinko Hyo indicator in 28 configurable instruments and 9 timeframes for classic Ichimoku trend signals with a deep scan feature to scan all market watch symbols (up to 1000 instruments!).
Download Demo here (Scans only M1 and M5) Settings description here MT5 version here
After the purchase, don't fo

IceFX SpreadMonitor is a special spread logging indicator which displays the current, minimum/maximum and average spread values. These values are set to be visible even after a reboot. Also, SpreadMonitor could save all the desired spread values to .csv files for later analysis of the results.
Indicator parameters: SpreadLowLevel - low level of spread (show value in green color) SpreadHighLevel - high level of spread (show value in red color) BGColor - background of panel SpreadNormalColor - c
FREE

Do you like scalping? Th is indicator displays information about the latest price quotes received from the broker. [ Installation Guide | Update Guide | Troubleshooting | FAQ | All Products ]
Identify tick trends easily A blue row means the price has increased A red row means the price has decreased Customizable colors and font sizes Display your desired amount of rows The indicator is non-repainting
Parameters Rows: amount of rows with data to display in the chart Font size: font size of th
FREE

SYMBOL POWER based on inputted 5 time frames and Compared to 20 Other Symbols !! Great Indicator YOU DON'T HAVE TO SHIFT ON ALL TIME FRAMES FOR EACH CURRENCY PAIR TO CONCLUDE ITS TREND AND ITS POWER YOU HAVE IT ALL IN ONE TABLE , 20 CURRENCY PAIR WITH 5 TIME FRAMES ALSO , COMPARE BETWEEN CURRENCIES STRENGTH AND ALERTS THE STRONGER /WEAKER PAIR BASED ON 5 TIMEFRAMES CALCULATIONS ALEERTS enable /disable using 5 time frames M5 M30 H1 H4 and D1 ( latest version You SELECT you own 5 timeframes fr
We Trade Live Trend Candle Stick can help identify potential trend in the market when trading, spot market trends and predict future prices. We Trade Live Trend Candle Stick has a smoother look, as it is essentially taking an average of the movement. candles will stay RED during a downtrend and Green during an uptrend . We believe It's useful for making candlestick charts more readable and trends easier to analyse. As a breakout trader you are looking for trades that are ‘breaking out’ of
FREE

Big summer sale. Save up to 40% on my products. PAAIOS - save 20$! PAAIOS stands for Price Action All In One Solution. And that is the purpose of the Indicator. It should give you a tool to improve your trading decisively because you get the crucial information at a glance. The indicator simplifies the search for strong signals. It shows trend lines, demand and supply zones from freely selectable time frames. Below you will find a short description of the functions of the indicator. Please re
The MetaTrader Market is the only store where you can download a free demo trading robot for testing and optimization using historical data.
Read the application overview and reviews from other customers, download it right to your terminal and test a trading robot before you buy. Only on the MetaTrader Market you can test an application absolutely free of charge.
You are missing trading opportunities:
- Free trading apps
- Over 8,000 signals for copying
- Economic news for exploring financial markets
Registration
Log in
If you do not have an account, please register
Allow the use of cookies to log in to the MQL5.com website.
Please enable the necessary setting in your browser, otherwise you will not be able to log in.