Something Interesting in Financial Video February 2016
Forum on trading, automated trading systems and testing trading strategies
Something Interesting in Financial Video August 2013
Sergey Golubev, 2013.08.16 10:17
How to Confirm and Identify Trend using Moving AveragesIn this video, we focus on how to confirm and Identify the Trend on your charts with moving averages. We also discuss how to use the confirmation of trend on multiple time frames for your intraday setups.
Dale's Wrap Up: Cable Catchup
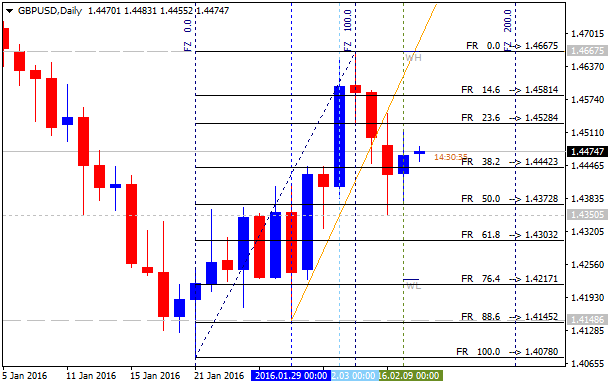
This is very short video about some thinking concerning GBPUSD price movement using simple trading setup.
Forum on trading, automated trading systems and testing trading strategies
Something Interesting in Financial Video July 2015
Sergey Golubev, 2015.07.15 08:44
How To Trade News Events: Consumer Price Index (CPI)
Consumer Price Index (CPI) measures the price that consumers pay for those goods. Released at 8:30 am eastern standard on approximately the 15th of each
month, the Consumer Price Index (CPI) is a measure of the changes in
prices paid by urban consumers for a fixed basket of goods and services.
The question that naturally arises when hearing this is wouldn’t those
two numbers be the same or at least move in tandem with one another?
The answer to that question is not necessarily, for the following
reasons:
- The PPI is designed to measure the entire marketed output of US producers which includes goods and services purchased by other producers. (The CPI includes only goods purchased by consumers)
- Imports are excluded from PPI but included in CPI
-
Taxes paid as part of the purchasing price by the consumer are not included in PPI but are included in CPI.
The important thing to understand here is that while changes in PPI
are normally looked at as having predictive power as to changes in the
CPI, a rise or fall in the PPI does not necessarily mean the same rise
or fall in the CPI. As this is the case, and as the CPI is the end
price paid by the consumer, this number best represents the level of
inflation in the US economy.
In addition to showing fluctuations in price for different areas of
the country, the CPI also shows the fluctuation in price for different
groups of products such as housing, transportation, medical care etc.
This allows traders to see not only the price fluctuations of the
overall economy but also for different areas of the economy.
There are two main CPI numbers reported which are the CPI for Urban
Wage Earners and Clerical Workers (CPI-W) and the CPI for all Urban
Consumers (CPI-U) which basically give two separate numbers for the
price increases experienced by working people and the price increases
experienced by all consumers.
As with the PPI the Consumer Price Index is also presented without
volatile food and energy included. This “Core CPI” number or CPI-U
minus food and energy is the most widely followed number.
Forum on trading, automated trading systems and testing trading strategies
Something Interesting in Financial Video November 2013
Sergey Golubev, 2013.11.01 06:47
188. Trading the E Mini S&P Futures Contract=============
Why Leverage is the Biggest Advantage and the Biggest Disadvantage
The main advantage and disadvantage in futures trading is the leverage involved. (You can hold a very large amount of a commodity for a small deposit so any gains and losses are multiplied.) This is the main difference between futures trading and, say, speculating with stocks and shares.
For example, you have $3000 to invest. You could buy $3000 of shares in an Oil Mining Company, buying them outright. Or this $3000 may be sufficient margin (a goodwill "security bond") to buy a couple of Crude Oil futures contracts worth $30,000.
The price of Crude Oil drops 10%. If this effects the price of your mining stocks by 10%, you would lose $300 (10% of $3000). But this 10% fall on the value of your Crude Oil futures contracts would lose $3000 (10% of $30,000). In other words, all of your initial stake would be lost trading the futures rather than only 10% of your capital trading the shares.
But, with Stop-Loss Orders you will always know how much money you are risking in any trade.
A Stop Loss Order is a pre-determined exiting point which automatically exits your position should the market go against you. In the above example, you may only decide to risk $1000 on the Crude Oil futures contracts. You would place a stop loss just under the market price and if the market dropped slightly, your position would be exited for the $1000 loss.
So Leverage is great if the market goes in your predicted direction - you could quickly double, treble or quadruple your initial stake. But if the market goes against you, you could lose a lot of money just as quickly. All of your initial stake (your margin) could be wiped out in a few days. And in some cases, you may have to pay more money to your broker if the margin you have put up is less than the loss of your trade.
How to Protect Profits with Stop-Loss Orders
As mentioned above, losses can accumulate just as quickly as profits in futures trading. Nearly every successful trader uses Stop-Loss Orders in his trading to ensure profits are 'locked in' and losses are minimised.
How do Stop-Losses work?
A stop-loss is usually placed when a trade is entered, although it can be entered or moved at any time. It is placed slightly below or above the current market price, depending on whether you are buying or selling.
For example, say Pork Bellies is trading at $55.00 and you think prices are about to rise. You decide to buy one Pork Bellies contract, but you don't want to risk more than $800 on the trade. A one-cent move in the market is worth $4.00 on a pork bellies futures contract so, therefore, you would place your stop at $53.00 (200 cents away from the current price x $4 per point = $800).
You can also move a stop-loss order to protect any profits you accumulate.
Taking the Pork Bellies example: Two weeks later, bellies are now trading at $65.00. You are now up $4000 (1000 cents of movement x $4). To protect these profits, you can raise your stop-loss simply by calling your broker. Say you place it at $63.00, you have locked it a profit of at least $3200 and now risk $800 to your new stop level.
But what if the market went against you? Going back to the original position when you bought at $55.00 with a stop at $53.00: what happens if the market suddenly tumbles down to $51.00 during the day? Your trade would automatically be 'stopped out' at your stop level of $53.00 for an $800 loss. The fact that the market closed the day at $51.00 is irrelevant as you are now out of the market. (Had you not used a stop-loss and viewed the market at the end of the day, you would have large losses on your hands!)
The same would happen if the market reached $65.00 and you had raised your stop to $63.00: If the market fell from here, say to $62.80, you would be stopped out at $63.00 and would have a profit of $3200. Even if the market suddenly reversed here and rose to $79.00, this would be irrelevant as you are now out of the market.
This last example would be annoying because if you hadn't been stopped out, you would now be $9600 in profit. But you were stopped out at your $63.00 stop. The market only went 20-cents under this and reversed!
It is for this reason that some traders don't use stops: they have been stopped out in the past JUST when the market was about to go their way.
The solution is not to abandon using stops as this is EXTREMELY RISKY. The solution is to use stops effectively.
(In fast moving markets it is sometimes impossible for brokers to get your orders exited exactly on your stop loss limits. They are legally required to do their best, but if the price in the trading pit suddenly jumps over your limit, you may be required to settle the difference. In the above scenario, the price of Pork Bellies could open trading at $62.50, fifty cents through your stop at $63.00. Your broker would have to exit your trade here and, in fact, you would lose $1000, $200 more than your anticipated $800.)
Where to Get Market Information
Commodity prices can change direction much faster than other investments, such as company stocks. Therefore, it is important for traders to stay on top of market announcements. Professional traders may use a wide number of techniques to do this, using fundamental information and technical indicators.
Fundamental data may include government reports of weather, crop sizes, livestock numbers, producer’s figures, money supply and interest rates. Other fundamental news that could affect a commodity might be news of an outbreak of war.
Technical indicators are mathematical tools used to plot market prices and behaviour patterns on a graph. These can include trend lines, over-bought and over-sold indicators, moving averages, momentum indicators, Elliott wave analysis and Gann theory.
Some traders use just one of these basic methods religiously, disregarding the other completely. Others use a combination of the two.
Many investors, especially smaller investors, devise their own trading method or purchase one from another trader. (Be careful not to buy a system that has been over-optimised and curve-fitted to fit past data. Many times, I have seen systems claiming 80%+ winning trades on past data, but when I have run the system on current prices, the results are breakeven at best!)
They normally paper trade the method (i.e. they follow the markets but only pretend to place the trades) for a few months to make sure the method works for them before placing any actual trades.
Tracking price charts and keeping up with fundamental data is a difficult full-time job – some large organisations employ dozens of staff to follow market moves. And some traders, especially those on the market floor, may only hold a position for a few hours or even minutes.
So where does this leave the small, independent investor who would like to trade in the lucrative futures markets?
Many trade on a daily or weekly basis, i.e. they note or 'download' market prices at the end of each trading day and make their decisions from this data. Often, they will leave a trade on for at least a few weeks (possibly months). This is a much SAFER way of trading because any fluctuations are ridden out and less panic-buying or selling is involved.
============
Mean Reversion Strategy
Forum on trading, automated trading systems and testing trading strategies
Something Interesting in Financial Video July 2013
Sergey Golubev, 2013.07.18 16:47
41. How to Use the Average True Range (ATR) To Set StopsIn our last lesson we looked at determining how much you are willing to risk on any one trade as the first step in developing a successful money management strategy. Now that we have established this, in today's lesson we are going to look at some of the different ways that you can then set your stop, which fit within this initial criteria.
As we learned in last lesson, risking more than 2% of total trading capital on any one trade is a major reason for the high failure rate of most traders. Does this mean that when setting a stop we should simply figure out how many points away from our entry represents 2% of our account balance and set the stop there? Well, traders could obviously do this and to be honest it would probably be a lot better than most of the other money management strategies I have seen, but there better ways.
Although many traders will look at other things in conjunction, having an idea of the historical volatility of the instrument you are trading is always a good idea when thinking about your stop loss level. If for instance you are trading a $100 stock which moves $5 vs. a $100 stock that moves $1 a day on average, then this is going to tell you something about where you should place your stop. As it is probably already clear here, all else being equal, if you put a stop $5 away on both stocks, you are going to be much more likely to be stopped out on the stock which moves on average $5 a day than you are with the stock that moves on average $1 a day.
While I have seen successful traders who get to know a list of the things they are trading well enough to have a good idea of what their average daily ranges are, many traders will instead use an indicator which was designed to give an overview of this, which is known as the Average True Range (ATR)
Developed by J. Welles Wilder the ATR is designed to give traders a feel for what the historical volatility is for an instrument, or very simply how much it moves. Financial instruments that exhibit high volatility move a lot, and traders can there fore make or lose a lot of money in a short period of time. Conversely, financial instruments with low volatility move a relatively small amount so it takes longer to make or lose money in them all else being equal.
As with many of the other indicators we have studied in previous lessons, Wilder uses a moving average to smooth out the True Range numbers. When plotted on a graph it looks as follows:
What you are basically seeing here is a representation of the daily movement of the EUR/USD. As you can see when the candles are longer (which represents large trading ranges and volatility) the ATR moves up and when the candles are smaller (representing smaller trading ranges and volatility) it moves down.
So with this in mind, the most basic way that traders use the ATR in setting their stops is to place their stop a set number of ATR's away from their entry price so they have less of a chance of being knocked out of the market by "market noise".
- Free trading apps
- Over 8,000 signals for copying
- Economic news for exploring financial markets
You agree to website policy and terms of use
Please upload forex video you consider as interesting one. No direct advertising and no offtopic please.
The comments without video will be deleted.