Problem backtesting with EA.
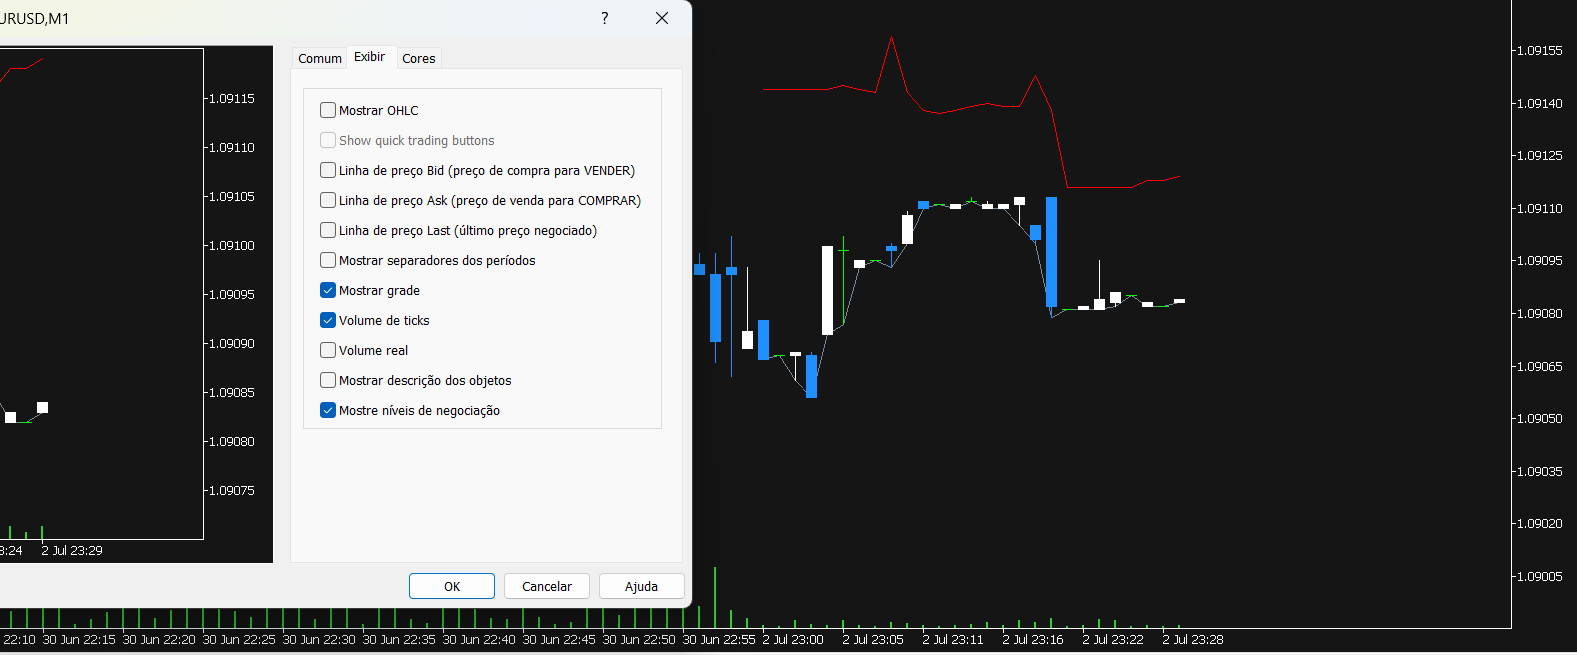
Diogo Alves: whenever I open the backtest and select the option visual mode these two lines appear on my chart.
Your image show where your order opened and where the Bid is.
It's not the bid, I'm talking about the red one above the price and one very next to the price. The text is in portuguese sorry.
Files:
lines2.png
45 kb
Diogo Alves: I am backtesting an EA and for some reason whenever I open the backtest and select the option visual mode these two lines appear on my chart. One above the price and one very next to it. I tried using other experts but it didn't disappear. Can someone help me?
They represent the extreme Bid (lowest) and Ask (highest) prices for the candle.
EDIT: The "feature" does not seem to be documented nor is there a way to enable/disable it.
You are missing trading opportunities:
- Free trading apps
- Over 8,000 signals for copying
- Economic news for exploring financial markets
Registration
Log in
You agree to website policy and terms of use
If you do not have an account, please register
I am backtesting an EA and for some reason whenever I open the backtest and select the option visual mode these two lines appear on my chart. One above the price and one very next to it. I tried using other experts but it didn't disappear. Can someone help me?