How do i change this indicator code to make the HTF candle color based on bull or bear candle?
How did you get it to work, am I missing something?
what are you missing?
I was asking how to change the indicator color
i have no idea what i am doing ha ha
That code is about 5 levels too high for me to understand...
The indi works great... i can copy code and compile it
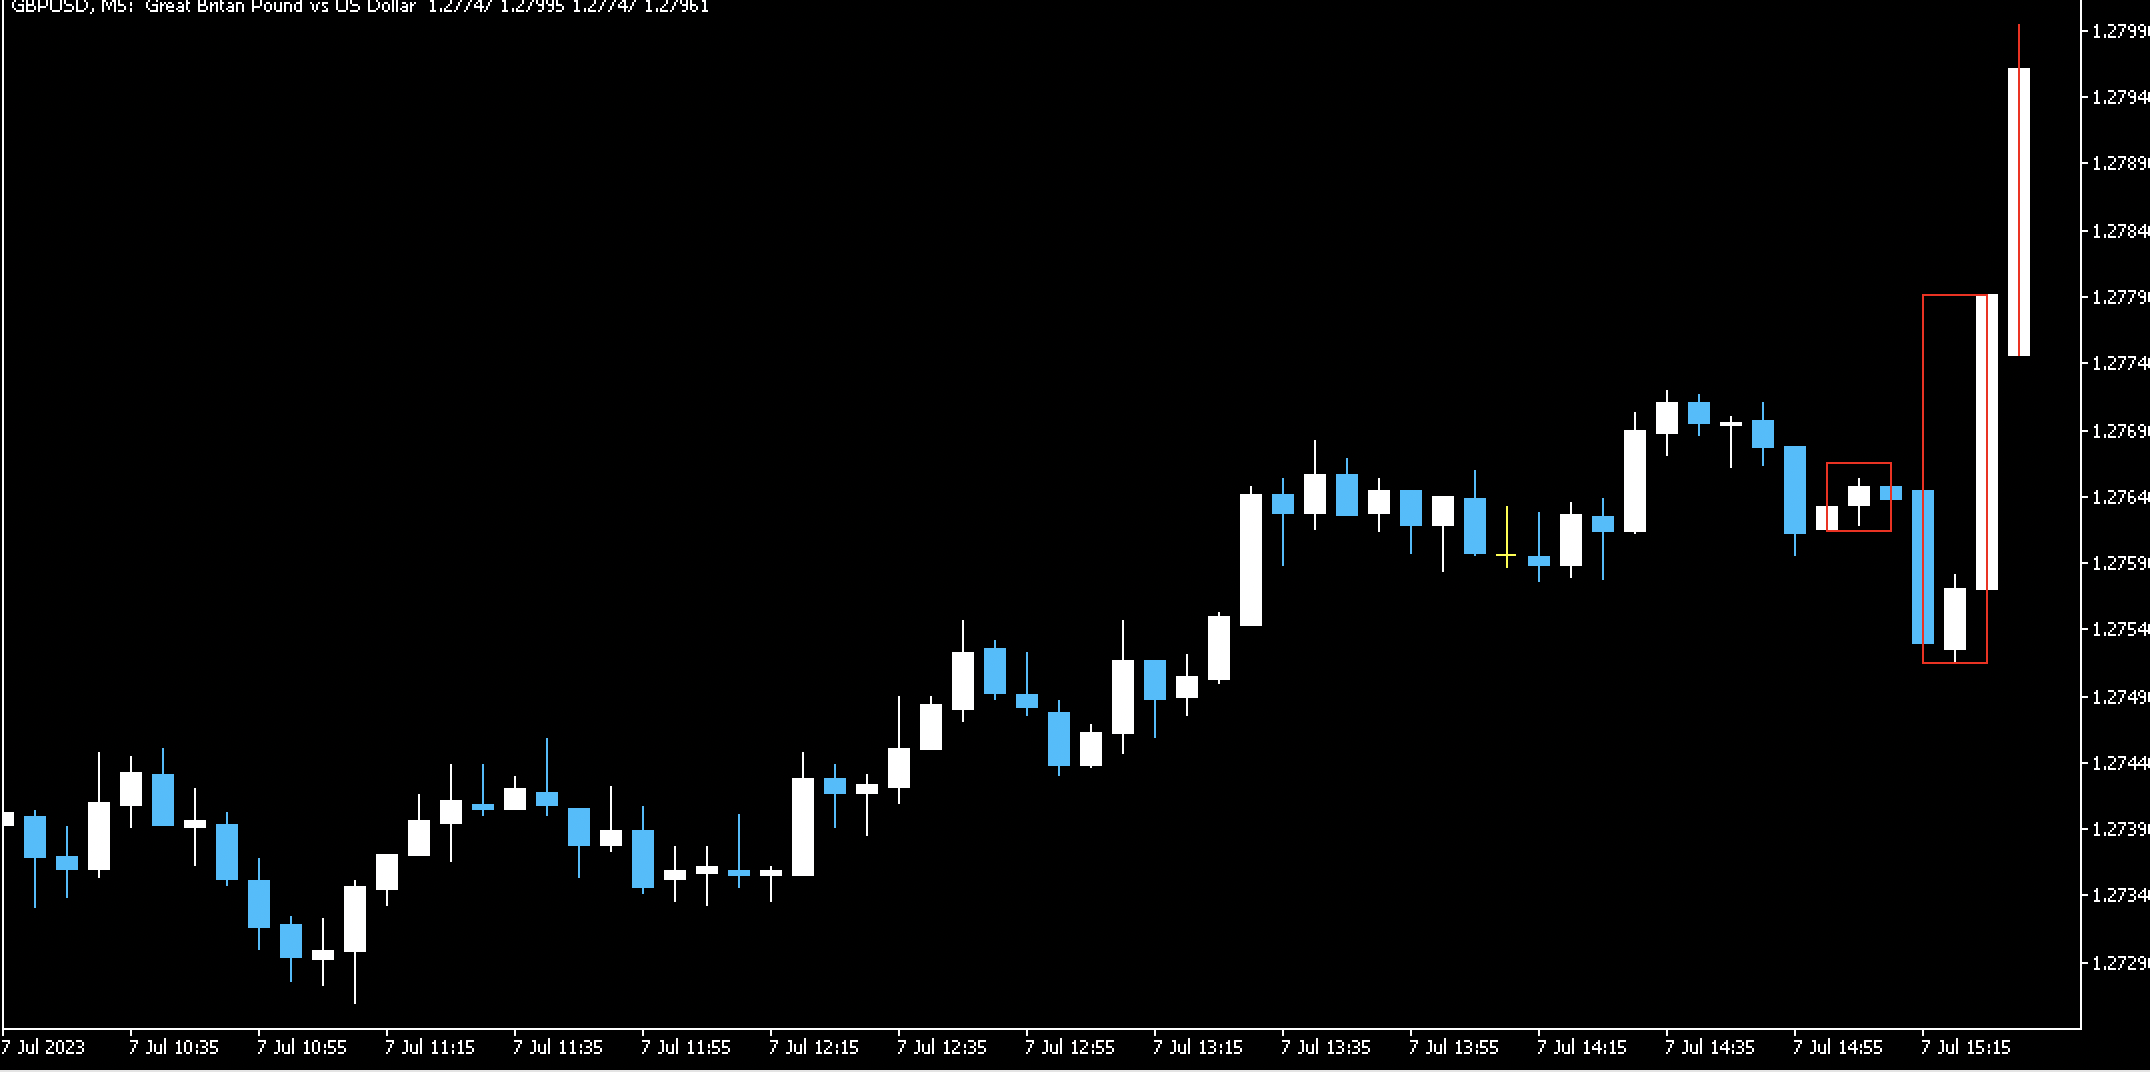
I just wanted the HTF candles to reflect the color of the direction they are
Eg.. the 2nd one here to be Green not red
what are you missing?
I was asking how to change the indicator color
i have no idea what i am doing ha ha
That code is about 5 levels too high for me to understand...
The indi works great... i can copy code and compile it
I just wanted the HTF candles to reflect the color of the direction they are
Eg.. the 2nd one here to be Green not red
Edit: Oh I get it now, it seems to work only in TF 1Min...
Okay, does it show the rectangles right away or only after some time?
Edit: Oh I get it now, it seems to work only in TF 1Min...
if does show up as its going and as the new candles are being printed.
i think u need to be in a lower timeframe than the HTF setting you choose...
Eg. u need to be in 1m or 5min chart to show 15min HTF candles...
or u need to be in 15min or 1hr chart to show daily HTF candles.
I see what u mean by the logic..
so it needs to know open > close is red rectangle and close > open is green rectangle
as high and low is always the same regardless of whether the candle is bullish or bearish.. a high is always a high and a low is always a low
thanks
- Free trading apps
- Over 8,000 signals for copying
- Economic news for exploring financial markets
You agree to website policy and terms of use
https://www.mql5.com/en/code/39683
this is an awesome indi for my strat as i can use these HTF candles over the top of my LTF chart
However i need to know whether the HTF candle is Bull or Bear ... and this just paints it all red
i think i need to change these but im not sure what exactly i need to change.....
Full code is below with author's details