detecting when a trend is ending ?
-
Until you can state your requirements in concrete terms, it can not be coded.
- What about the lower left corner? It is identical to your red box. Do you want to enter there? What's the difference?
-
Until you can state your requirements in concrete terms, it can not be coded.
- What about the lower left corner? It is identical to your red box. Do you want to enter there? What's the difference?
Thanks for your answer.
1. in (more) concrete terms: is there a indicator that indicates when an (big) uptrend is slowing down ?
2. at the lower left corner there is no previous big trend
[EDIT] the lower left corner would be a nice time to enter, yes... but I am looking for an indicator that tells you when NOT to enter (long)
I now have my own idea of which indicator to use, but before sharing it, I will wait a bit to see if there is any proposal :)
Ending trends can be detected by ZigZag indicator. Although a little lagging, but if the legs of ZigZag get smaller than the previous leg, this can be an indication of an ending trend. Also Tops and Bottoms of ZigZag can be used for range definitions.
I am not sure I understand what the legs of the zigzag are
But on tradingview I set the price deviation of the zigzag to 1% and got this:
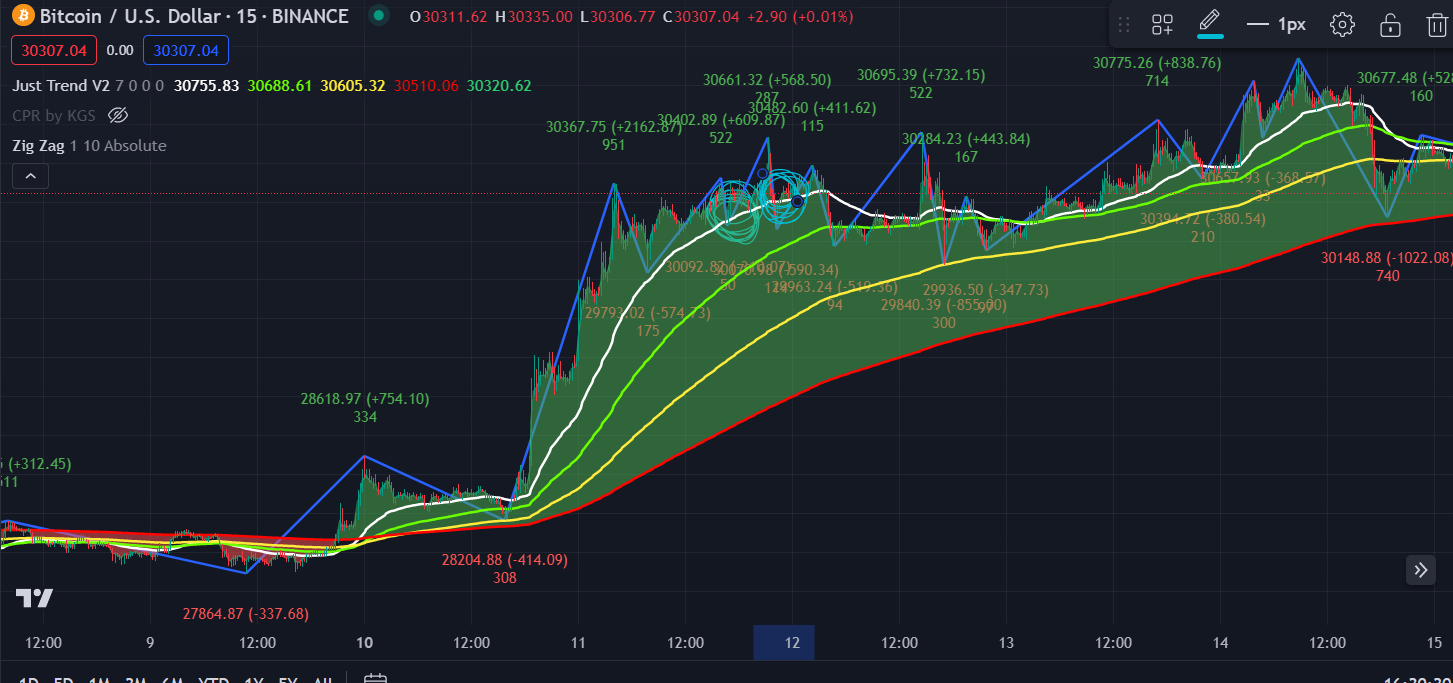
it seems like if the zigzag crosses the weakest SMA downward it's a good indication not to enter.
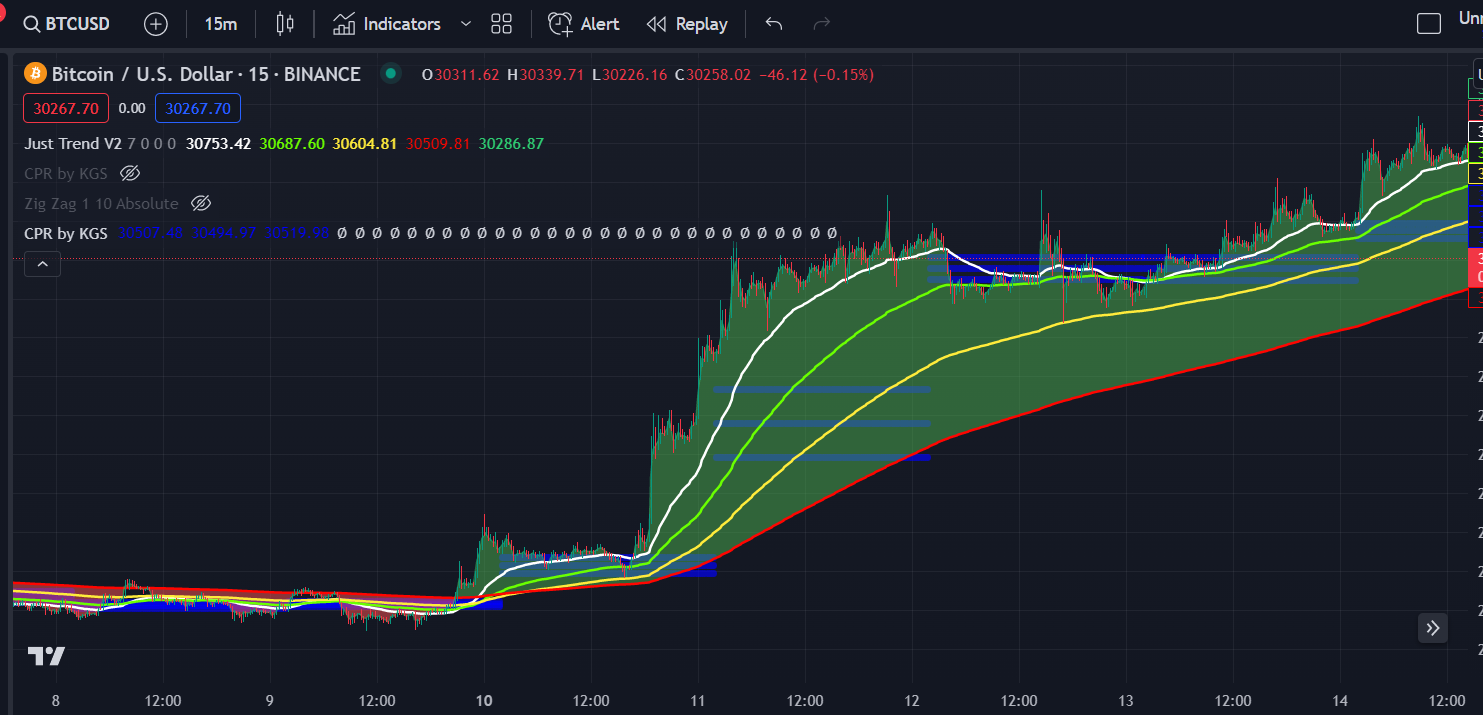
My idea was to use Central Pivot Range.
In this video https://www.youtube.com/watch?v=5yVnbVE-vZ0&ab_channel=SwitchStats it is explained quite clearly. In particular the width between each line (lines are shown by groups of 3) is important, and a narrow CPR (3 lines close to each other) may indicate that a trend is going to happen. Whereas a wide CPR may indicate that the trend is already happening (and so it would be too late to enter).
To be even more precise, I could enter only if the lines are close to each other AND if the price if above them.

- 2023.03.26
- www.youtube.com
My idea was to use Central Pivot Range.
In this video https://www.youtube.com/watch?v=5yVnbVE-vZ0&ab_channel=SwitchStats it is explained quite clearly. In particular the width between each line (lines are shown by groups of 3) is important, and a narrow CPR (3 lines close to each other) may indicate that a trend is going to happen. Whereas a wide CPR may indicate that the trend is already happening (and so it would be too late to enter).
To be even more precise, I could enter only if the lines are close to each other AND if the price if above them.
Thanks for your reply.
For me, an indicator gives you a probability that something will happen, so of course it's never to be trusted 100%.
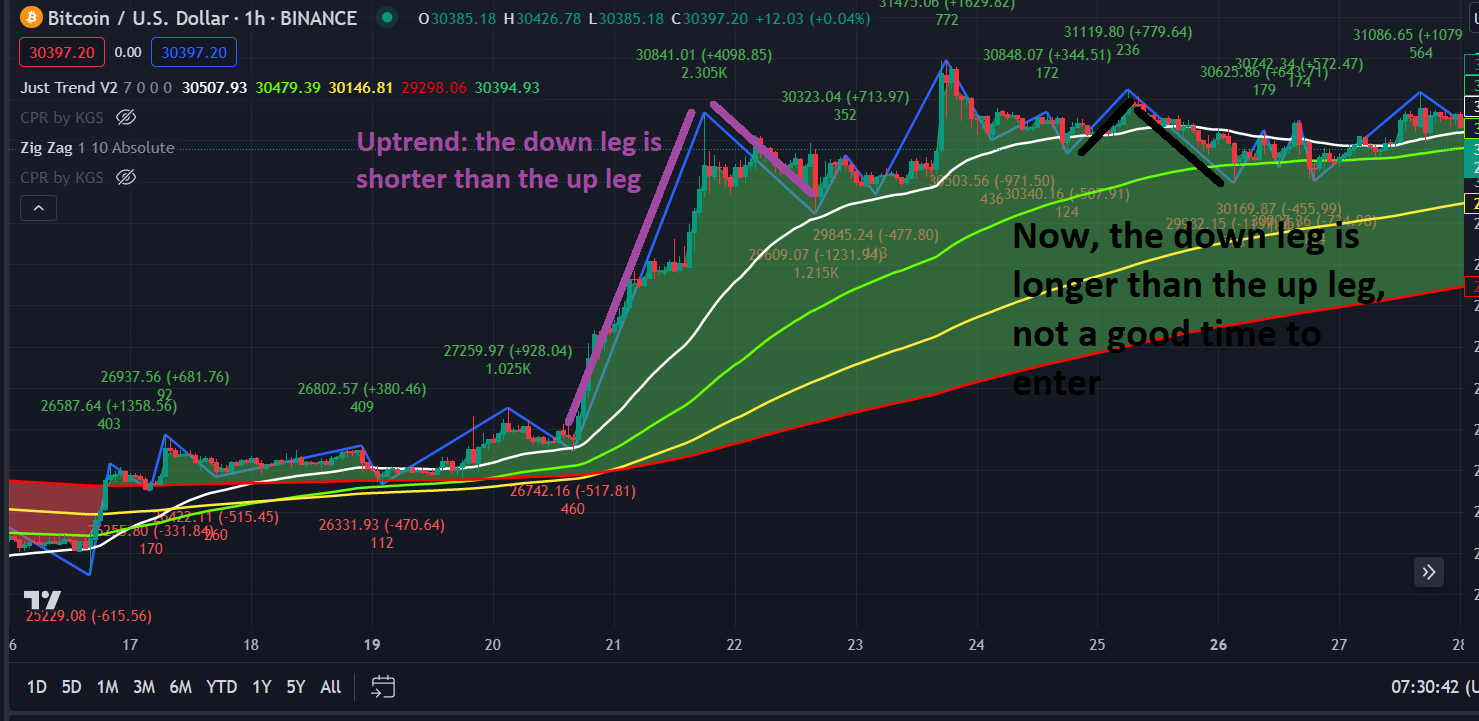
In general I agree with your argument that ZigZag relies on actual price and therefore is more reliable, in a sense, than an indicator with a lag (e.g. MAs). Here is an illustration of your comment on legs:
Regarding Ichimoku and why you would classify it as "working on pure price action", I am not sure to understand. Maybe, the fact that past minimum and maximum price is used to calculate the cloud, might make the latter more reliable than a MA, I don't know.... But min/max price is also used in CPR... so, which one is more reliable than the other, I still don't know :)
Regarding the use of MAs, you say that it's a question of optimization, I guess you mean that it can be used to set the level of entry or exit.
The EA I am building is an experiment where I want to test first the most obvious (in the sense "popular", but also easy to understand, it's a "bit" like the Occam's razor) indicators to decide when to enter and when to exit. When I look at a chart with MAs, my first intuition is to say : "the price does not go in all directions, there are trends, and when you are in a trend, the probability of staying in it on the next candle is higher than the other way around, and this should be made used of".
[EDIT]
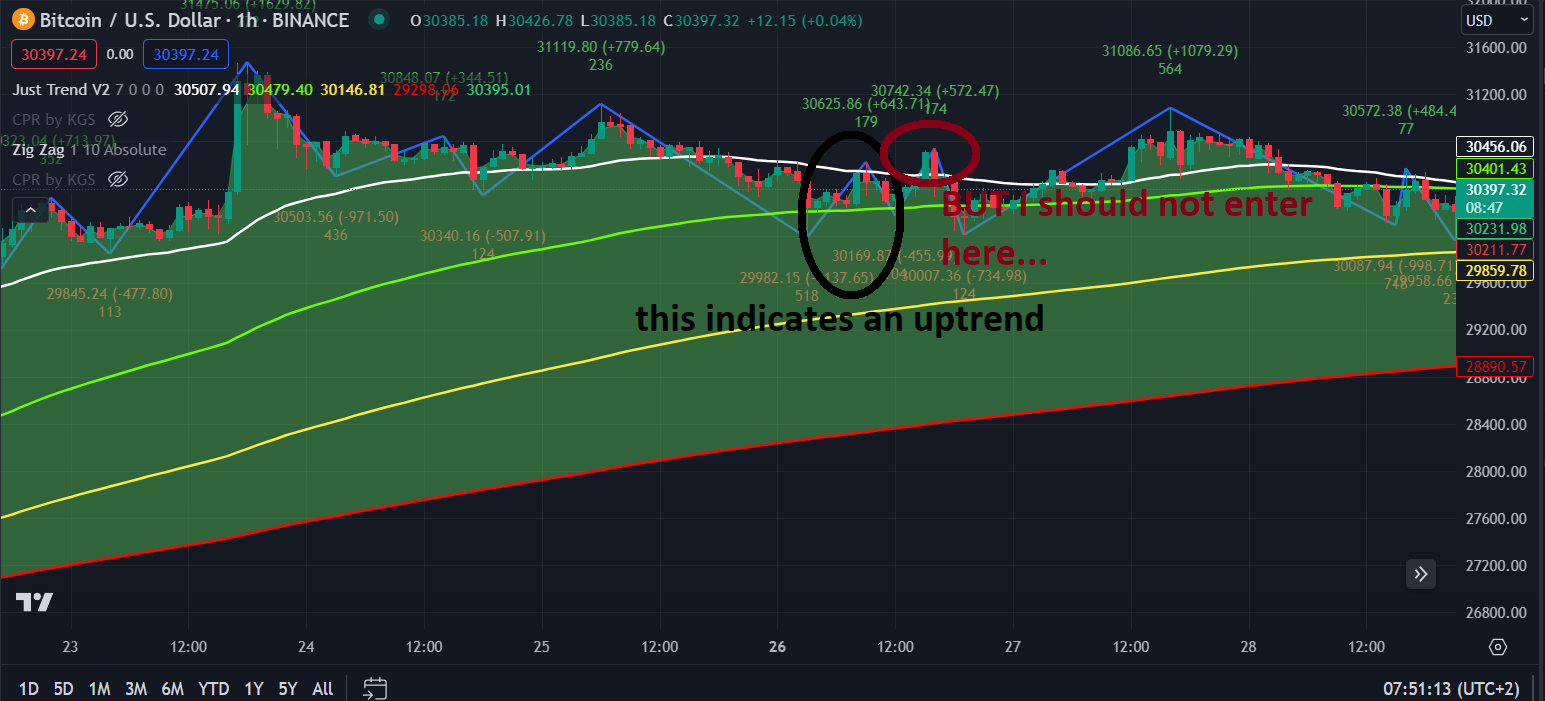
Using ZigZag seems promising, I have the idea of using it this way in my EA: when the last up/down legs (triangle that point to the top) is an "uptrend one" (like the black one of the picture), then it is allowed to enter long. If not, then it is not allowed. But as you can see on the picture above it does not work in this example.
Thanks for your reply.
For me, an indicator gives you a probability that something will happen, so of course it's never to be trusted 100%.
In general I agree with your argument that ZigZag relies on actual price and therefore is more reliable, in a sense, than an indicator with a lag (e.g. MAs). Here is an illustration of your comment on legs:
Regarding Ichimoku and why you would classify it as "working on pure price action", I am not sure to understand. Maybe, the fact that past minimum and maximum price is used to calculate the cloud, might make the latter more reliable than a MA, I don't know.... But min/max price is also used in CPR... so, which one is more reliable than the other, I still don't know :)
Regarding the use of MAs, you say that it's a question of optimization, I guess you mean that it can be used to set the level of entry or exit.
The EA I am building is an experiment where I want to test first the most obvious (in the sense "popular", but also easy to understand, it's a "bit" like the Occam's razor) indicators to decide when to enter and when to exit. When I look at a chart with MAs, my first intuition is to say : "the price does not go in all directions, there are trends, and when you are in a trend, the probability of staying in it on the next candle is higher than the other way around, and this should be made used of".
[EDIT]
Using ZigZag seems promising, I have the idea of using it this way in my EA: when the last up/down legs (triangle that point to the top) is an "uptrend one" (like the black one of the picture), then it is allowed to enter long. If not, then it is not allowed. But as you can see on the picture above it does not work in this example.
Hi everyone,
Everyone is busy with indicators why?
Think about it
what is trading about??
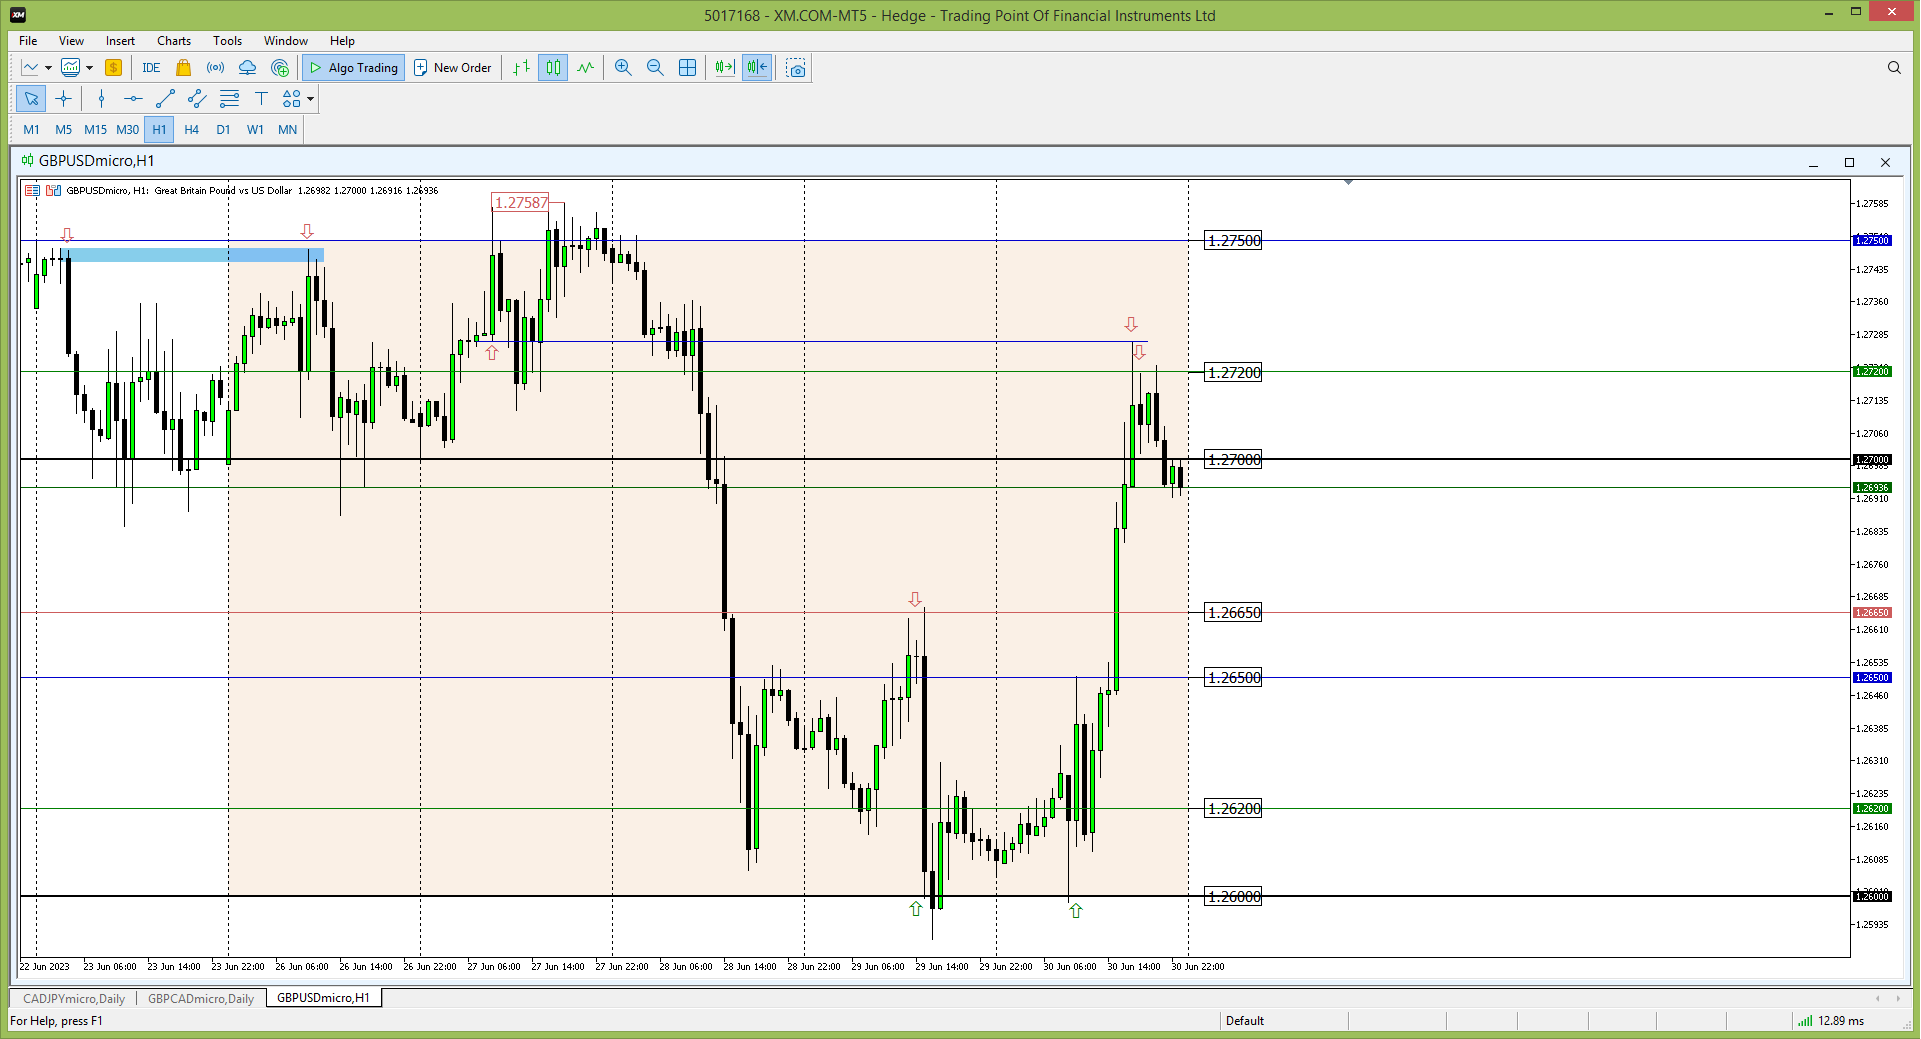
I am attaching a GBUS chart for last week on the 1 hour.
I appreciate your opinion on it.
- Free trading apps
- Over 8,000 signals for copying
- Economic news for exploring financial markets
You agree to website policy and terms of use
Hello,
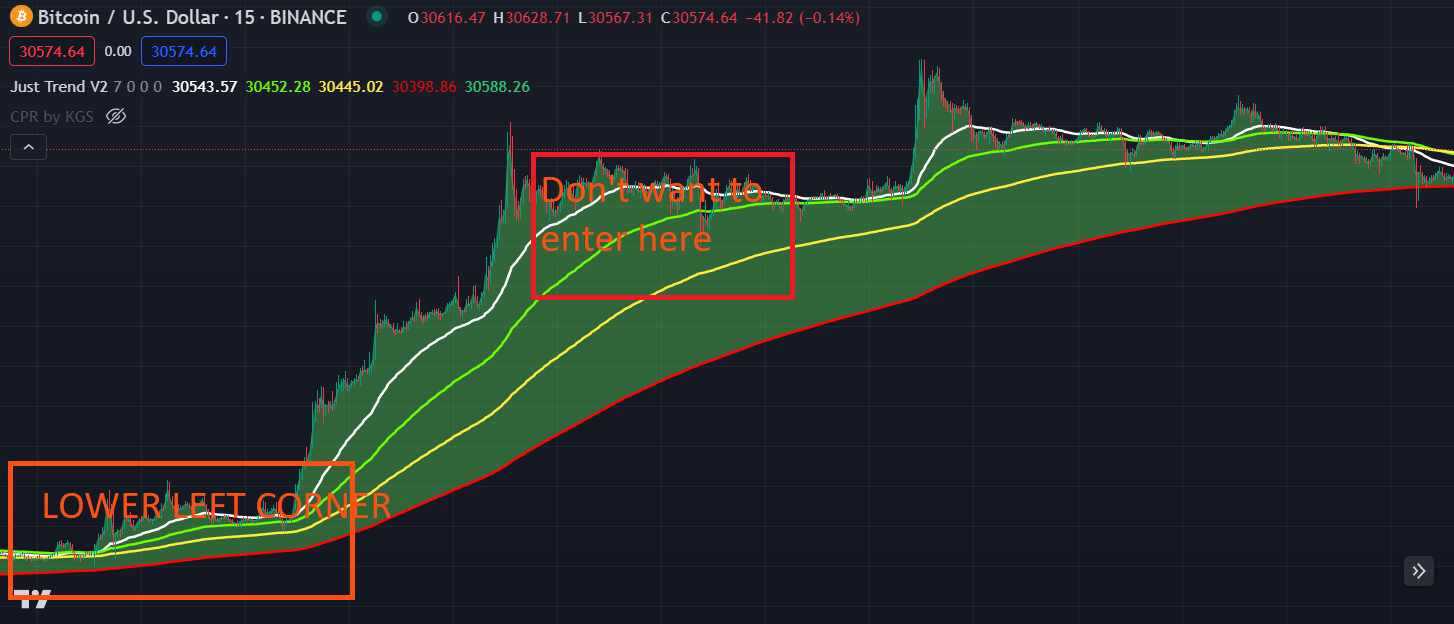
I am implementing an EA based on smooth moving averages (the four colored lines below) and I want to have another indicator to prevent to enter (long) when price starts to falter (i.e. to slow down, to be "out of breath" etc.)
Best way to illustrate this is with a chart:
So, is there an indicator that correspond to this : "the MA lines have diverged (following a big uptrend), but now, they are getting closer to each other (meaning the trend is "out of breath")"
(the indicator that you can suggest can also not be related to MAs lines, I just want it to indicate a faltering trend).
Thanks
Aymeric
p.s: I used tradingview for the picture here, but for my EA, of course, I use MT5