Not a bad Trend Reversal pattern. Maybe someone can make an indicator?
Firstly, thank you very much for undertaking to do this.
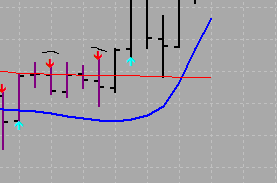
All true, but some signals are missing. Attached are two pictures, arrows are missing signals, taken from euroyen, 4 Aug. 1900 - 5 Aug 1200 Alpari time, 30m.
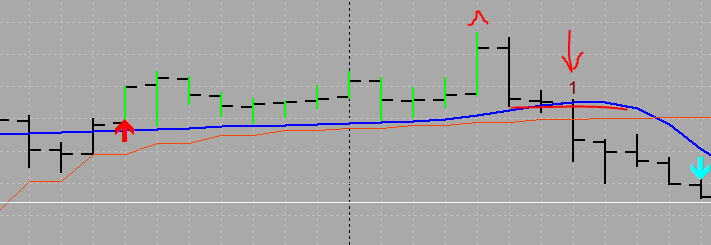
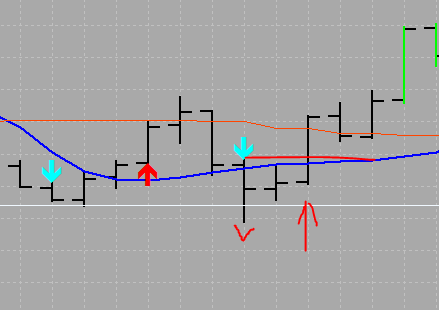
In the second picture, the second signal bar (with the blue arrow) is simultaneously a setup bar (local low).
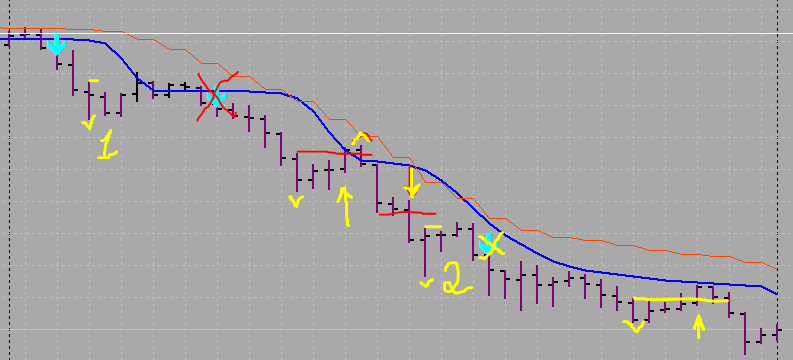
Actually, I forgot to add - two signals cannot be directed in the same direction in series. That is, only alternating up-down-up, etc. is possible. Here is an example on the trend (euroyen, Aug 11, 30m), I crossed out the unnecessary arrows and drew the necessary ones. 1 and 2 are places where there was "almost" a signal, but nevertheless price closed above the high fractal. So, the pattern is not a bullshit, it has some logic :) It keeps the trend :)
I cannot understand the logic of the code, but if I have a desire to improve the code, I'm ready to continue the discussion. The pattern is good :)
You see, I can't understand the logic of the code, but if you want to make the turkey a little bit smarter, you're welcome to continue the discussion. The pattern is good :)
It will be much more effective if the first bar is a daily max/min. but otherwise there are a lot of false signals.
Not so much.
What you suggest is just one way to filter the signal. I can think of a few more ways - the reversal is near the Fibo level, stochastic is pointing in the direction of the reversal, the trend on a higher timeframe coincides, etc. etc. I personally find "false signals" useful and would like to see them on the chart as well - I don't see anything criminal in adding in the middle of a daily range at the beginning of a New York session.
Actually, if the indicator will be implemented, it will be easier to determine whether the signal appeared on the daily high or low just by looking at the chart, if you are ready to take only such a signal into account.
The more signals, the more false.
Something is still not working correctly. This signal, for example, should not be present, nothing below the low level has closed.
And there shouldn't be two signals in a row, although it's not critical, you can fill up on them :)
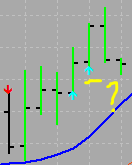
The first picture shows a typical Pin Bar (Pinocchio) pattern, but the entry will be at the close of the bar indicated on the picture as #2
It could be a non-pinbar. This is not the essence of the pattern, though candlestick patterns, of course, enhance the signal.
Here are 2 totally left signals down on the Eurodollar today. There is no close below the low anywhere. I'll try to look at the code now, maybe I'll get the hang of it... :)
Then a clarification of the ToR. (At what distance from the current bar will we look for low/high?
And I see that the arrows can be drawn in both directions?
- Free trading apps
- Over 8,000 signals for copying
- Economic news for exploring financial markets
You agree to website policy and terms of use
Recently I came across a signal like this, which indicates a possible trend reversal. I liked it a lot. I wouldn't trade on it exclusively (except scalp, but I don't do that), but it's good as an additional tool. I may have the nerve to ask - may be there is a kind soul who will translate it into turkey? Sometimes it is easy to find with my eyes and sometimes difficult.
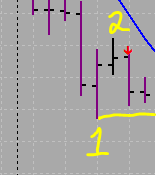
The pattern is as follows: we look for a fractal, but not metatrader's one where a bar should be higher/lower than DUAL on both sides; a candlestick above the adjacent right and left ones is enough here. In other words, we find the local maximum (candlestick #1 in the picture), and pay attention to the next candlestick (#2) as well. One of them will be lower (in the example, the second one) - this is our level we are looking for. Now we wait for the candle that will CLOSE below this level (candle #3), and open down. Ahem, or rather, consider opening downwards. As such.
Clearly, when trending downwards, everything is mirrored in reverse.
It would be better to paint bars # 1 and #3 or to attach an arrow with a bell... ...even without a bell, if only this pattern could be automatically marked somehow. I was told by my mother to learn how to program, but I didn't listen.