the case was like this:
Mikheev: And you build a mechanical trading system according to your entry-exit criteria, test it on history and show the results. For starters
JLY: Algorithm is not for a robot.
---
No more questions.
I understand that it is potentially possible, i.e. programmable) But my skills are not enough, although I imagined how it should work automatically.
The algorithm is for manual trading, but for a robot it's almost the same, only in more detail.
The strategy belongs to the people) If you want to program it, it is very interesting what will work, maybe there are some deficiencies or vulnerabilities in the algorithm in prinpiple.
Thank you all for your attention)
Description here.https://onlinebroker.ru/forum/index.php?PAGE_NAME=read&FID=32&TID=10689
Discuss and ask me questions here)
If a strategy, then there are trading rules (when exactly to open sell or buy), and trading stats. Otherwise I just see one theory. Would you be able to start trading this system on Monday? In the mode "chart with a brief explanation - then you open a position", then again "chart with a brief explanation - close a position" (in real time, with real open - closed positions) ... that would make more sense ... But this way I see not a strategy, but a theory, sorry.
The algorithm is the same for both robot and manual trading. For example (just as an example):
we open a sell when [something there] crosses [something there] on bar 1 (for example) compared to bar 2 (for example).
The algorithm is the same for a robot as it is for manual trading.
Not so. The difference is in the formalisation. Sergeev is right:
JLY: The algorithm is not for a robot.
And here the author has not a system, but a theory of technical analysis.
For example a quote from this system:
Входы:
-Behind the point of a new "flat trend line extension". Stop Loss behind the initial (minimum) point of the "widening flat trend line". Take profit at the opposite level (extremum) of the flat.
This is technical analysis. And if it is trading, the algorithm should be as clear as for the robot. Otherwise, no one will be able to trade using this system.
That "algorithm is not for a robot" is what I was quoted from the link)
I think that before writing a robot trader you need to write a base and not to race a demo account. The base is drawing the trend line and its endpoint and identifying the flat extremums. And only then buy and sell signals, Take Profit and Stop Loss. For the manual trading algorithm is used together with drawing trend lines and flat extremums. You see, mathematically it is difficult to calculate, we need a graphic visualization in the form of an indikator.
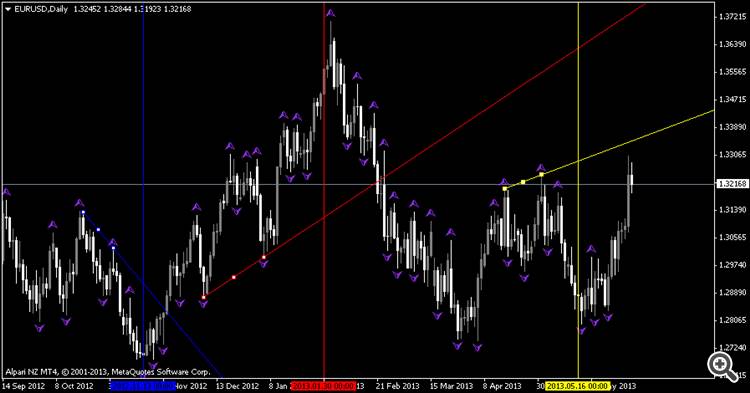
We need points to plot the trend line and we need points of flat extrema. Three trend lines: flat trend, regular trend and rebound trend.
We take points, e.g. a fractal. To draw a regular trend line, we need a flat breakdown signal.
In the picture: blue line - regular trend line, red line - flat trend, yellow line - breakout trend. The vertical lines show the end of the trend.
When drawing a line naturally the price after the second point must not touch the trend line. After, for a flat trend line this touching may be a signal of "widening of the flat trend line".
A rebound trend line is drawn on the basis of 2 points. If the third maximum or minimum point is found, it will be the flat's opposite extremum. If the opposite extremum is broken, the usual trend line will be drawn. And if the rebound signal at the second point is not confirmed, it will be a breakout signal that will be used to draw a regular trend line.
It goes something like this)
If we talk about the indicator, the indicator is there - it builds the trend line and the levels of suppo and resistances according to the bars specified in the settings (horizontal lines on the chart). The indicator was made for Metatrader 3, then it was transferred to MT4 and now it's in MT5 CodaBase here MaksiGen_Range_Move MTF - and I traded it - I have a 48-sheet branch in English section of our forum ... I mean I have traded it (I apologize, I have traded on minutes :) ).
All lines on the charts were drawn not by me, but by the indicator (it is multitime).
In my previous posts I meant - on what bars all lines are drawn. The indicator has it in its settings. And you - it's just somehow streamlined. And so on. So, in order to trade (and if it is a system, you or someone traded on it, and there is a statement and trade rules) - you have to be more specific.
That is - this system, which in the Russian forex known as Paramon system, and in English forex - as MaksiGen system, and it was created when there was only MetaTrader 3 (MT4 was not yet).
The indicator was translated into MT5 CodeBase:
I'm not criticising ... I'm just offended by the word 'strategy' in the title of the thread :) As far as I'm concerned - a strategy is a trading system with defined rules, which have been verified by trading (there's MT Statment), and anyone can replicate it according to these rules (I'm talking about manual trading). What you have here is just an idea.
Yes, I agree - an idea based on good theory and solid knowledge ... but underdeveloped ... idea so far ...
- Free trading apps
- Over 8,000 signals for copying
- Economic news for exploring financial markets
You agree to website policy and terms of use


Description here.https://onlinebroker.ru/forum/index.php?PAGE_NAME=read&FID=32&TID=10689
Discuss and ask me questions here)