Machine learning in trading: theory, models, practice and algo-trading - page 1740
You are missing trading opportunities:
- Free trading apps
- Over 8,000 signals for copying
- Economic news for exploring financial markets
Registration
Log in
You agree to website policy and terms of use
If you do not have an account, please register
and color the clusters on the graph later, if you can... it's hard in python
to see the length of the clusters, how they alternate, etc.
I made three.
Is it the same for you?
No, I have a beauty, I showed you... I don't know why) something someone is doing wrong
traine
test
show me a fragment of the sample, which returnees you took and how
show me a fragment of the training sample, what returns you took and how
Take increments 5 and 25 for clustering
and then use the cumulative one. 1. On the Eurobucks hourly. Test and traine by year.
take increments 5 and 25 for clustering
and then use the cumulative one for increments. 1. On the eurobucks hourly. Test and trace by year.
Let's do it tomorrow, I have my eyes full
I feel dumbLet's do it tomorrow, because my eyes are already popping out of my head.
I feel dumb.There will be strictly one curve upwards, one horizontal and one downwards, there is no other
it's like a test case
What we see, the more stable the period, the more round. That is, I can take wavelets, for example, and get the same picture.
In general, it does not work very well. The picture below has good periods (2 and 3), but they are not very smooth and make the circle fall apart.
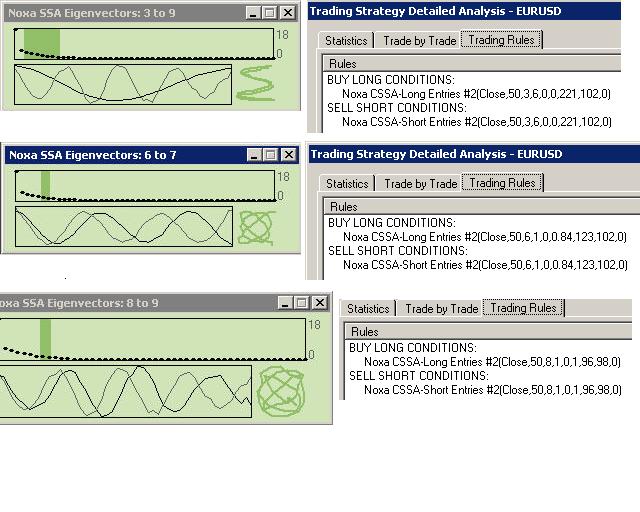
It sayshere that cssa is an ssa built on a neural network prediction. That's what I wrote before, lag can be eliminated only by prediction. In usual ssa most likely instead of prediction they duplicate last known price, but in cssa they build prediction with neural network.I have to go to sleep, I felt that I was dumb... The sad thing is that you are always predicting the past and adding up the past too, although on new data. For example if you found an "up trend cluster", the cluster itself will appear only after this trend has happened, post factum, the red dot is the moment when the cluster appears
and then you put it all together and you get a nice picture of an up trend.
but it's post factum, you know?
The cluster will say "trend" when the trend has already happened.
Max, it's bullshit with those clusters, it's good that I went to bed, I felt that I was dumb... The sad thing is that you are always predicting the past and adding up the past too, although on new data. For example, if you found an "up trend cluster", the cluster itself will appear only after this trend has happened, post factum, the red dot is the moment when the cluster appears.
and then you put it all together and you get a nice picture of an up trend.
but it's post factum, you know?
The cluster will say "trend" when the trend has already happened.
they should be relatively long and rarely change
they should be relatively long and rarely change
Okay, but you'll always be behind on the window size for the cluster
OK, but you will always be behind on the size of the window for the cluster
I don't really know, I'm too lazy to think about it... or should I?