Trouble with conditional line color
Same as any colored line indicator. Look in the CodeBase. If you assign to one color buffer, make the other color buffer(s) EMPTY_VALUE. Then connect to the previous bar.
HOW CAN I hide CONNECTION lines of plots? (ttt) - MQL4 programming forum (2016)
For MT4 I use:
- One buffer has the value, color set to CLR_NONE so not shown on chart, (but in data window and pop up.)
- Two buffers, one color each, with SetIndexLabel(i, NULL) so they don't show in data window.
- Then you need to connect the lines on color change. downBuffer[i]=value[i]; if(downBuffer[i+1]==EMPTY_VALUE) downBuffer[i+1]=value[i].
Thanks. I've been working on this and am running into some confusing behavior. When try to have MT4 color in the previous bar (I've tried a couple different methods, including the one you suggest here) there are some spots where unexpected bars get colored in.
I've spent a while playing around with it and am totally stumped as to why.
The operators for [i] and [I+1] both work as expected – but ONLY if I try to print one OR the other onto the indicator. If I try to output them both onto my indicator there are unexpected lines that get filled in.
My condition is (RSIFast>RSISlow && RSISlow>EMA).
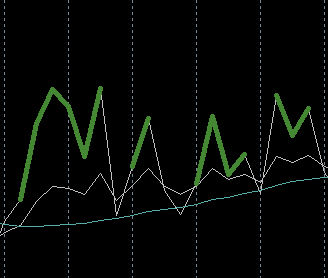
The operator UpBuffer[i] = iRSI(Symbol(),0,RSI_FastPeriod,PRICE_CLOSE,i); gives me the result you see in attachment 1.
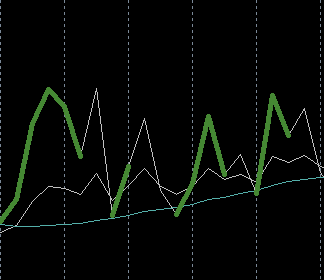
Operator UpBuffer[I+1] = iRSI(Symbol(),0,RSI_FastPeriod,PRICE_CLOSE,i+1); gives me the result you see in attachment 2.
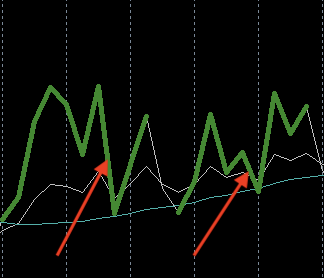
But both operators together give me the result you see in attachment 3. I've pointed arrows at the lines that shouldn't be filled in – they aren't present in either image 1 or 2, but somehow they appear when I try to include both operators on the chart. This happens regardless of whether I give them their own for statements, if statements, or include them in the same if statement as shown in the code snippet just below.
Any ideas what's happening here?
-
Here's the section of code I'm working with
for(i=0; i < limit; i++)
      {if (iRSI(Symbol(),0,RSI_FastPeriod,PRICE_CLOSE,i) > iRSI(Symbol(),0,RSI_SlowPeriod,PRICE_CLOSE,i) && (iRSI(Symbol(),0,RSI_SlowPeriod,PRICE_CLOSE,i) > iMAOnArray(RSISlowBuffer,0,MA_Period,0,MA_Method,i)))
      {StrongBuyFastBuffer[i] = iRSI(Symbol(),0,RSI_FastPeriod,PRICE_CLOSE,i); StrongBuyFastBuffer[i+1] = iRSI(Symbol(),0,RSI_FastPeriod,PRICE_CLOSE,i+1);
      }}
Your profile rating is probably still too low. It's an anti-spam measure. You will have access to it once you reach a certain minimum rating level.
Do all you can to improve your "achievements" and wait 24 hours for the rating to update.
EDIT: I remember once reading a post about it having to be at least 100 before it allows you you post images, but I'm not certain of that.
- Free trading apps
- Over 8,000 signals for copying
- Economic news for exploring financial markets
You agree to website policy and terms of use
Hi all.
I've been cobbling together an indicator that overlays two RSIs and a moving average.
So good so far. Next I'm trying to get basic conditional coloring working.
When RSIFast > RSISlow I want to color the line green, and vice versa.
This is working, kind of, but it's skipping any segments where a crossover occurs. I want it to color in the line for the bar that just happened, according to their relative value at bar close. See attached screenshot for a visual.
How can I do this?