print of same point changed moving averages
How on earth do you expect us to know? Ask the author of the Indicator!
How on earth do you expect us to know? Ask the author of the Indicator!
it is native indicator

Ok, its a native indicator, but you have stacked so many of them in a template with many different settings of which we know nothing about. We cannot read your mind or look into what setup you have. All we can do is speculate or try to guess.
Maybe the underlying data has changed, or something else has been updated. Many brokers don't keep historical data for M1 very long.
If the Moving Averages are based on "Exponential" or "Smoothed", then loosing earlier data can have an impact on the results, especially for very long periods. "Simple" and "Linear Weighted" are less prone to such loss of earlier data.
EDIT: Also, your chart's max bar count can have an impact. It should be at least as long as the period of your Moving Averages, and at least 3-4 longer in case of "Exponential" or "Smoothed".
Ok, its a native indicator, but you have stacked so many of them in a template with many different settings of which we know nothing about. We cannot read your mind or look into what setup you have. All we can do is speculate or try to guess.
Maybe the underlying data has changed, or something else has been updated. Many brokers don't keep historical data for M1 very long.
If the Moving Averages are based on "Exponential" or "Smoothed", then loosing earlier data can have an impact on the results, especially for very long periods. "Simple" and "Linear Weighted" are less prone to such loss of earlier data.
This two prints was taked between saturday and monday on morning. There is no on historical data. Market was closed and the point of begining is the same.
So, I don´t see any reason to this change based on indicator or historical data.
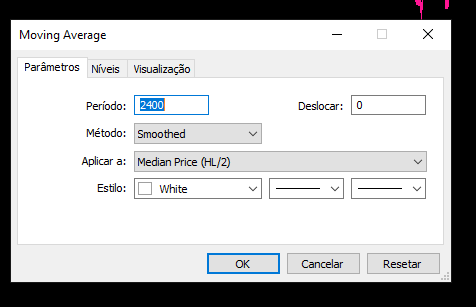
It is the same default, (template attached):
Of course there is historical data! What do you think charts are made of?
It does not matter if it is a week day or week-end, or if market is closed are not. There is always historical data, but how far back it goes is important especially for "Exponential" or "Smoothed".
A "Smoothed" period is equivalent to roughly twice the period on a "Exponential". So if your longest period is 2400 on "Smoothed", then "Exponential" would be roughly 4800 and you would have to have at least 19200 bars on your chart for there to be minimum impact on the indicator.
19200 M1 bars would be roughly equivalent to 13-14 days,or approximately 3 weeks (5 days per week).
Do you have at least 3 weeks worth of M1 data on your chart?
According to your Template file, your longest period is 4800, so you would need at least 27 days or 5-6 weeks of M1 data.
The more you have the lower the impact on the "Exponential" and "Smoothed"!
-
Never any reason to use the SMMA(L) it's equivalent to the EMA(2L-1).
The Smoothed Moving Average or SMMA - How to Avoid It - NinjaTrader Programming | futures.io March 23rd 2019 -
Exponential requires 3.45×(Length+1) bars to converge to 1/10 percent. Do both your charts have at least 2400*3.45 = 8K bars? (Hover over the tab.)
Moving average - Wikipedia
Of course that is historical data! What do you things charts are made of?
It does not matter if it is a week day or week-end, or if market is closed are not. There is always historical data, but how far back it goes is important especially for "Exponential" or "Smoothed".
A "Smoothed" period is equivalent to roughly twice the period on a "Exponential". So if your longest period is 2400 on "Smoothed", then "Exponential" would be roughly 4800 and you would have to have at least 19200 bars on your chart for there to be minimum impact on the indicator.
19200 M! bars would be roughly equivalent to 13-14 days,or approximately 3 weeks (5 days per week).
Do you have at least 3 weeks worth of M1 data on your chart?
i mean there was no update on historical data, cause this two prints was between saturaday night and sunday morning, so historical data It can´t be the reason for change on prints cause there was no new data on this inteval
Incorrect! During the weekend (especially at the end of the month) is when most brokers update their available historical data, either to purge older data, or to correct price or volume data in some cases.
Also, you have not stated how much historical data is available on your chart!
Incorrect! During the weekend (especially at the end of the month) is when most brokers update their available historical data, either to purge older data, or to correct price or volume data in some cases.
Also, you have not stated how much historical data is available on your chart!
Nice, thank you so much; I will pay attention on It. If something different occurs, I came back.
Have a nice sunday : ))
- Free trading apps
- Over 8,000 signals for copying
- Economic news for exploring financial markets
You agree to website policy and terms of use
There is two prints of audusd, m1, at same date.
The template is the same.
First print, I made studying the graph. Second print I made after some days, to check something.
Why at first there is more distance between white an blue ranges if compares to second print?