Displaying text on a chart with opaque background
Hello friend,
Maybe create a rectangle object and insure that the co ordinates of your text is inside it.
Here something I started to do, but I stopped coding it. I hope it help you a bit, or at least gives you some sort of start.
#property strict
int OnInit()
  {


OnKeyPad();
   return(INIT_SUCCEEDED);{}
  }

void  OnKeyPad()
{
int Chart_ID=0;
ChartSetInteger(0,CHART_EVENT_MOUSE_MOVE,true);
string InpName="Button";
if(!ButtonCreate(0,"BUY",    0,20,20,100,20,CORNER_LEFT_UPPER,"BUY","Arial",8,clrBlue,clrBlanchedAlmond,clrNONE,false,false,false,true,0)){}
if(!ButtonCreate(0,"SELL",   0,110,20,100,20,CORNER_LEFT_UPPER,"SELL","Arial",8,clrRed,clrBlanchedAlmond,clrNONE,false,false,false,true,0)){}
if(!ButtonCreate(0,"HISTORY",0,20,40,100,20,CORNER_LEFT_UPPER,"HISTORY","Arial",8,clrGreen,clrBlanchedAlmond,clrNONE,false,false,false,true,0)){}
if(!ButtonCreate(0,"MODIFY", 0,110,40,100,20,CORNER_LEFT_UPPER,"MODIFY","Arial",8,clrGreen,clrBlanchedAlmond,clrNONE,false,false,false,true,0)){}
if(!ButtonCreate(0,"HIDE",   0,20,60,100,20,CORNER_LEFT_UPPER,"HIDE","Arial",8,clrBlack,clrBlanchedAlmond,clrNONE,false,false,false,true,0)){}
if(!ButtonCreate(0,"CANCEL", 0,110,60,100,20,CORNER_LEFT_UPPER,"CANCEL","Arial",8,clrBlack,clrBlanchedAlmond,clrNONE,false,false,false,true,0)){}

if(!ButtonCreate(0,"1",      0,20,90,30,30,CORNER_LEFT_UPPER,"1","Arial",8,clrDarkBlue,clrBlanchedAlmond,clrNONE,false,false,false,true,0)){}
if(!ButtonCreate(0,"2",      0,40,90,30,30,CORNER_LEFT_UPPER,"2","Arial",8,clrDarkBlue,clrBlanchedAlmond,clrNONE,false,false,false,true,0)){}
if(!ButtonCreate(0,"3",      0,70,90,30,30,CORNER_LEFT_UPPER,"3","Arial",8,clrDarkBlue,clrBlanchedAlmond,clrNONE,false,false,false,true,0)){}
if(!ButtonCreate(0,"4",      0,10,120,30,30,CORNER_LEFT_UPPER,"4","Arial",8,clrDarkBlue,clrBlanchedAlmond,clrNONE,false,false,false,true,0)){}
if(!ButtonCreate(0,"5",      0,40,120,30,30,CORNER_LEFT_UPPER,"5","Arial",8,clrDarkBlue,clrBlanchedAlmond,clrNONE,false,false,false,true,0)){}
if(!ButtonCreate(0,"6",      0,70,120,30,30,CORNER_LEFT_UPPER,"6","Arial",8,clrDarkBlue,clrBlanchedAlmond,clrNONE,false,false,false,true,0)){}
if(!ButtonCreate(0,"7",      0,10,150,30,30,CORNER_LEFT_UPPER,"7","Arial",8,clrDarkBlue,clrBlanchedAlmond,clrNONE,false,false,false,true,0)){}
if(!ButtonCreate(0,"8",      0,40,150,30,30,CORNER_LEFT_UPPER,"8","Arial",8,clrDarkBlue,clrBlanchedAlmond,clrNONE,false,false,false,true,0)){}
if(!ButtonCreate(0,"9",      0,70,150,30,30,CORNER_LEFT_UPPER,"9","Arial",8,clrDarkBlue,clrBlanchedAlmond,clrNONE,false,false,false,true,0)){}
if(!ButtonCreate(0,"#",      0,10,180,30,30,CORNER_LEFT_UPPER,"#","Arial",8,clrDarkBlue,clrBlanchedAlmond,clrNONE,false,false,false,true,0)){}
if(!ButtonCreate(0,"0",      0,40,180,30,30,CORNER_LEFT_UPPER,"0","Arial",8,clrDarkBlue,clrBlanchedAlmond,clrNONE,false,false,false,true,0)){}
if(!ButtonCreate(0,".",      0,70,180,30,30,CORNER_LEFT_UPPER,".","Arial",8,clrDarkBlue,clrBlanchedAlmond,clrNONE,false,false,false,true,0)){}
 if(Chart_ID==CHARTEVENT_OBJECT_CLICK)
   ObjectSet("BUY",OBJPROP_XDISTANCE,20);     //
   ObjectSet("BUY",OBJPROP_YDISTANCE,20);     //
   ObjectSet("SELL",OBJPROP_XDISTANCE,110);   //
   ObjectSet("SELL",OBJPROP_YDISTANCE,20);    //
   ObjectSet("HISTORY",OBJPROP_XDISTANCE,20); //
   ObjectSet("HISTORY",OBJPROP_YDISTANCE,40); //
   ObjectSet("MODIFY",OBJPROP_XDISTANCE,110); //
   ObjectSet("MODIFY",OBJPROP_YDISTANCE,40);  //
   ObjectSet("CANCEL",OBJPROP_XDISTANCE,110); //
   ObjectSet("CANCEL",OBJPROP_YDISTANCE,60);  //
   ObjectSet("HIDE",OBJPROP_XDISTANCE,20);    //
   ObjectSet("HIDE",OBJPROP_YDISTANCE,60);    //
   ObjectSet("1",OBJPROP_XDISTANCE,10);
   ObjectSet("1",OBJPROP_YDISTANCE,90);
   ObjectSet("2",OBJPROP_XDISTANCE,40);
   ObjectSet("2",OBJPROP_YDISTANCE,90);
   ObjectSet("3",OBJPROP_XDISTANCE,70);
   ObjectSet("3",OBJPROP_YDISTANCE,90);
   ObjectSet("4",OBJPROP_XDISTANCE,10);
   ObjectSet("4",OBJPROP_YDISTANCE,120);
   ObjectSet("5",OBJPROP_XDISTANCE,40);
   ObjectSet("5",OBJPROP_YDISTANCE,120);
   ObjectSet("6",OBJPROP_XDISTANCE,70);
   ObjectSet("6",OBJPROP_YDISTANCE,120);
   ObjectSet("7",OBJPROP_XDISTANCE,10);
   ObjectSet("7",OBJPROP_YDISTANCE,150);
   ObjectSet("8",OBJPROP_XDISTANCE,40);
   ObjectSet("8",OBJPROP_YDISTANCE,150);
   ObjectSet("9",OBJPROP_XDISTANCE,70);
   ObjectSet("9",OBJPROP_YDISTANCE,150);
   ObjectSet("#",OBJPROP_XDISTANCE,10);
   ObjectSet("#",OBJPROP_YDISTANCE,180);
   ObjectSet("0",OBJPROP_XDISTANCE,40);
   ObjectSet("0",OBJPROP_YDISTANCE,180);
   ObjectSet(".",OBJPROP_XDISTANCE,70);
   ObjectSet(".",OBJPROP_YDISTANCE,180);
   ChartRedraw();
  }
bool ButtonCreate(
                  const long              chart_ID = 0,
                  const string            name = "Button",
                  const int               sub_window = 0,
                  const int               x = 0,
                  const int               y = 0,
                  const int               width = 50,
                  const int               height = 18,
                  const ENUM_BASE_CORNER  corner = CORNER_LEFT_UPPER,
                  const string            text = "Button",
                  const string            font = "Arial",
                  const int               font_size = 10,
                  const color             clr = clrBlack,
                  const color             back_clr = C'236,233,216',
                  const color             border_clr = clrNONE,
                  const bool              state = false,
                  const bool              back = false,
                  const bool              selection = false,
                  const bool              hidden = true,
                  const long              z_order = 0)
  {
   if(!ObjectCreate(chart_ID,name,OBJ_BUTTON,sub_window,0,0))
     {
      return(false);
     }
   ObjectSetString(chart_ID,name,OBJPROP_TEXT,text);
   ObjectSetString(chart_ID,name,OBJPROP_FONT,font);
   ObjectSetInteger(chart_ID,name,OBJPROP_XDISTANCE,x);
   ObjectSetInteger(chart_ID,name,OBJPROP_YDISTANCE,y);
   ObjectSetInteger(chart_ID,name,OBJPROP_XSIZE,width);
   ObjectSetInteger(chart_ID,name,OBJPROP_YSIZE,height);
   ObjectSetInteger(chart_ID,name,OBJPROP_CORNER,corner);
   ObjectSetInteger(chart_ID,name,OBJPROP_FONTSIZE,font_size);
   ObjectSetInteger(chart_ID,name,OBJPROP_COLOR,clr);
   ObjectSetInteger(chart_ID,name,OBJPROP_BGCOLOR,back_clr);
   ObjectSetInteger(chart_ID,name,OBJPROP_BORDER_COLOR,border_clr);
   ObjectSetInteger(chart_ID,name,OBJPROP_BACK,back);
   ObjectSetInteger(chart_ID,name,OBJPROP_STATE,state);
   ObjectSetInteger(chart_ID,name,OBJPROP_SELECTABLE,selection);
   ObjectSetInteger(chart_ID,name,OBJPROP_SELECTED,selection);
   ObjectSetInteger(chart_ID,name,OBJPROP_HIDDEN,hidden);
   ObjectSetInteger(chart_ID,name,OBJPROP_ZORDER,z_order);
   return(true);
  }
//+------------------------------------------------------------------+
Hello friend,
Maybe create a rectangle object and insure that the co ordinates of your text is inside it.
Here something I started to do, but I stopped coding it. I hope it help you a bit, or at least gives you some sort of start.
ObjectCreate("Rectangle", OBJ_RECTANGLE, 0, x1, y1, x2, y2);
ObjectSetInteger(0, "Rectangle", OBJPROP_BACK, true);
The problem that I faced in using rectangle object is that the rectangle drawn is in background layer of the chart so the text is still blocked by candlestick. I will try the button code that you shared and see how i can match it to my needs. Thanks again.
ObjectSetInteger(chart_ID,name,OBJPROP_BACK,false);
Bala you can just add the text to the button by using the ObjectSetString function.
Or you can use the basic functions as is:
// Functions:
//- ButtonCreate()
//- ButtonMove()
//- ButtonChangeSize()
//- ButtonChangeCorner()
//- ButtonTextChange()
//- ButtonDelete()

//+------------------------------------------------------------------+
//| Create the button                                                |
//+------------------------------------------------------------------+
bool ButtonCreate(const long              chart_ID=0,               // chart's ID
                  const string            name="Button",            // button name
                  const int               sub_window=0,             // subwindow index
                  const int               x=0,                      // X coordinate
                  const int               y=0,                      // Y coordinate
                  const int               width=50,                 // button width
                  const int               height=18,                // button height
                  const ENUM_BASE_CORNER  corner=CORNER_LEFT_UPPER, // chart corner for anchoring
                  const string            text="Button",            // text
                  const string            font="Arial",             // font
                  const int               font_size=10,             // font size
                  const color             clr=clrBlack,             // text color
                  const color             back_clr=C'236,233,216',  // background color
                  const color             border_clr=clrNONE,       // border color
                  const bool              state=false,              // pressed/released
                  const bool              back=false,               // in the background
                  const bool              selection=false,          // highlight to move
                  const bool              hidden=true,              // hidden in the object list
                  const long              z_order=0)                // priority for mouse click
  {
//--- reset the error value
   ResetLastError();
//--- create the button
   if(!ObjectCreate(chart_ID,name,OBJ_BUTTON,sub_window,0,0))
     {
      Print(__FUNCTION__,
            ": failed to create the button! Error code = ",GetLastError());
      return(false);
     }
//--- set button coordinates
   ObjectSetInteger(chart_ID,name,OBJPROP_XDISTANCE,x);
   ObjectSetInteger(chart_ID,name,OBJPROP_YDISTANCE,y);
//--- set button size
   ObjectSetInteger(chart_ID,name,OBJPROP_XSIZE,width);
   ObjectSetInteger(chart_ID,name,OBJPROP_YSIZE,height);
//--- set the chart's corner, relative to which point coordinates are defined
   ObjectSetInteger(chart_ID,name,OBJPROP_CORNER,corner);
//--- set the text
   ObjectSetString(chart_ID,name,OBJPROP_TEXT,text);
//--- set text font
   ObjectSetString(chart_ID,name,OBJPROP_FONT,font);
//--- set font size
   ObjectSetInteger(chart_ID,name,OBJPROP_FONTSIZE,font_size);
//--- set text color
   ObjectSetInteger(chart_ID,name,OBJPROP_COLOR,clr);
//--- set background color
   ObjectSetInteger(chart_ID,name,OBJPROP_BGCOLOR,back_clr);
//--- set border color
   ObjectSetInteger(chart_ID,name,OBJPROP_BORDER_COLOR,border_clr);
//--- display in the foreground (false) or background (true)
   ObjectSetInteger(chart_ID,name,OBJPROP_BACK,back);
//--- set button state
   ObjectSetInteger(chart_ID,name,OBJPROP_STATE,state);
//--- enable (true) or disable (false) the mode of moving the button by mouse
   ObjectSetInteger(chart_ID,name,OBJPROP_SELECTABLE,selection);
   ObjectSetInteger(chart_ID,name,OBJPROP_SELECTED,selection);
//--- hide (true) or display (false) graphical object name in the object list
   ObjectSetInteger(chart_ID,name,OBJPROP_HIDDEN,hidden);
//--- set the priority for receiving the event of a mouse click in the chart
   ObjectSetInteger(chart_ID,name,OBJPROP_ZORDER,z_order);
//--- successful execution
   return(true);
  }
//+------------------------------------------------------------------+
//| Move the button                                                  |
//+------------------------------------------------------------------+
bool ButtonMove(const long   chart_ID=0,    // chart's ID
                const string name="Button", // button name
                const int    x=0,           // X coordinate
                const int    y=0)           // Y coordinate
  {
//--- reset the error value
   ResetLastError();
//--- move the button
   if(!ObjectSetInteger(chart_ID,name,OBJPROP_XDISTANCE,x))
     {
      Print(__FUNCTION__,
            ": failed to move X coordinate of the button! Error code = ",GetLastError());
      return(false);
     }
   if(!ObjectSetInteger(chart_ID,name,OBJPROP_YDISTANCE,y))
     {
      Print(__FUNCTION__,
            ": failed to move Y coordinate of the button! Error code = ",GetLastError());
      return(false);
     }
//--- successful execution
   return(true);
  }
//+------------------------------------------------------------------+
//| Change button size                                               |
//+------------------------------------------------------------------+
bool ButtonChangeSize(const long   chart_ID=0,    // chart's ID
                      const string name="Button", // button name
                      const int    width=50,      // button width
                      const int    height=18)     // button height
  {
//--- reset the error value
   ResetLastError();
//--- change the button size
   if(!ObjectSetInteger(chart_ID,name,OBJPROP_XSIZE,width))
     {
      Print(__FUNCTION__,
            ": failed to change the button width! Error code = ",GetLastError());
      return(false);
     }
   if(!ObjectSetInteger(chart_ID,name,OBJPROP_YSIZE,height))
     {
      Print(__FUNCTION__,
            ": failed to change the button height! Error code = ",GetLastError());
      return(false);
     }
//--- successful execution
   return(true);
  }
//+------------------------------------------------------------------+
//| Change corner of the chart for binding the button                |
//+------------------------------------------------------------------+
bool ButtonChangeCorner(const long             chart_ID=0,               // chart's ID
                        const string           name="Button",            // button name
                        const ENUM_BASE_CORNER corner=CORNER_LEFT_UPPER) // chart corner for anchoring
  {
//--- reset the error value
   ResetLastError();
//--- change anchor corner
   if(!ObjectSetInteger(chart_ID,name,OBJPROP_CORNER,corner))
     {
      Print(__FUNCTION__,
            ": failed to change the anchor corner! Error code = ",GetLastError());
      return(false);
     }
//--- successful execution
   return(true);
  }
//+------------------------------------------------------------------+
//| Change button text                                               |
//+------------------------------------------------------------------+
bool ButtonTextChange(const long   chart_ID=0,    // chart's ID
                      const string name="Button", // button name
                      const string text="Text")   // text
  {
//--- reset the error value
   ResetLastError();
//--- change object text
   if(!ObjectSetString(chart_ID,name,OBJPROP_TEXT,text))
     {
      Print(__FUNCTION__,
            ": failed to change the text! Error code = ",GetLastError());
      return(false);
     }
//--- successful execution
   return(true);
  }
//+------------------------------------------------------------------+
//| Delete the button                                                |
//+------------------------------------------------------------------+
bool ButtonDelete(const long   chart_ID=0,    // chart's ID
                  const string name="Button") // button name
  {
//--- reset the error value
   ResetLastError();
//--- delete the button
   if(!ObjectDelete(chart_ID,name))
     {
      Print(__FUNCTION__,
            ": failed to delete the button! Error code = ",GetLastError());
      return(false);
     }
//--- successful execution
   return(true);
  }
//+------------------------------------------------------------------+
Bala you can just add the text to the button by using the ObjectSetString function.
Or you can use the basic functions as is:
Of course it's possible but you have to code it
It worked Marco. Thanks
Hello Bala,
i have the same situation like you, i coded a void for show some info on chart for example leverage, broker, spread, balance and so on. I create lines and set objprop and the infos works fine.
And i want create a box same you, to put all info lines in the box, but i dont understand how i can put all lines in a rectangle... :(
Can you show me your code to understand how can i fix it?
And a another problem is that infos like spread, balance or freemargin not update every tick only one time if EA start and i can not find the misstake.
You have a idea?
Thanks for help!
- Free trading apps
- Over 8,000 signals for copying
- Economic news for exploring financial markets
You agree to website policy and terms of use
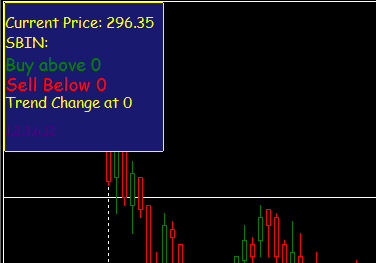
I am trying to display text on a chart with OPAQUE background but no luck so far. I will appreciate any suggestions.