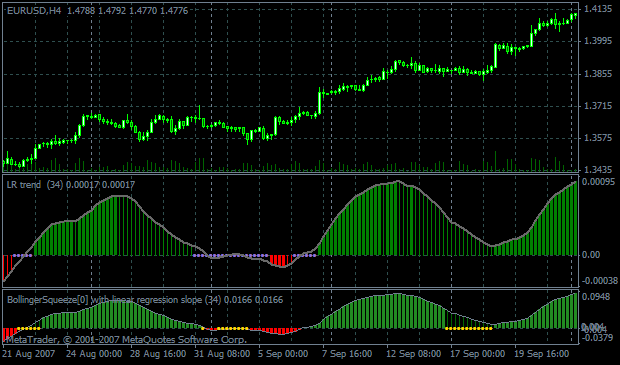
LR trend
hi, Mladen!
glad to see you!
can you tell (normally) how's Rsq. formula works (what behind the logic)?
...
Attached a pdf that does a quite good job with explaining how RSquared works (pdf is not mine of course  )
)
hi, Mladen!
glad to see you!
can you tell (normally) how's Rsq. formula works (what behind the logic)?Hi Mladen,
Thanks to share the source of good stuff for free ! (despite what is happening in the forum now).
Your indic is very well writen and structured ! Bravo!
very interesting, Mladen, thank you!
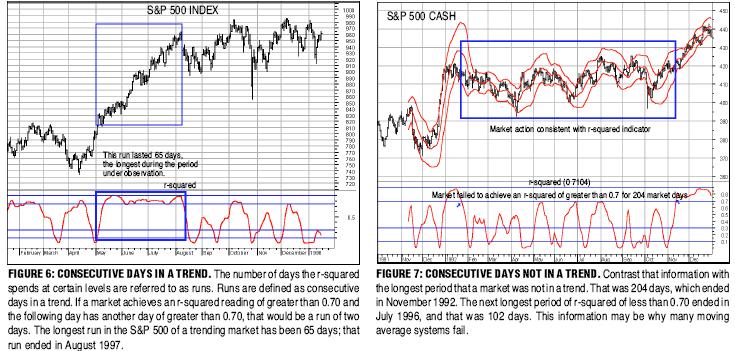
"Stocks & Commodities V16:4 (173-179): Identifying Market Trends by Jack Karczewski
Linear regression is a statistical technique that fits a straight line to a datastream. The datastream is an independent variable versus a dependent variable. In this case, the independent variable is time and the dependent variable is price. This data is generally viewed in a scatter diagram, but here, we use traditional price charts with just the closing price plotted on the y-axis, and the x-axis being time. A straight line is fitted so the distance is minimized between the predicted line and the data, a technique referred to as least squares. The name comes from the use of squaring the differences between the line and the data points.
Some very valuable statistics are a byproduct of linear regression analysis: r-squared or the coefficient of determination, the standard error of the estimate, the slope of the line and finally a prediction.
This statistic informs us how well the line explains the data; the parameters for this statistic are zero and 1. A reading of zero indicates that the dependent variable has no linear relationship to the independent variable, while an r-squared reading of 1 indicates that the line explained the data exactly. High readings indicate good trends and low readings denote a nontrending or ranging market.
----------
p.s. and thx 4 S&C - interesting, especially in the end
btw. do we have r-squared thread?
Rsq ind - just in case
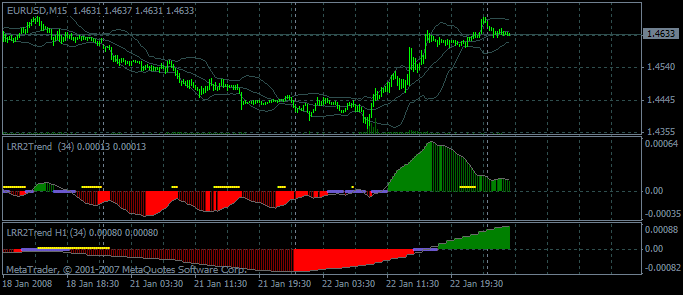
LR Rsquared Trend:
LRS & R2 - perfect match; naturally belonged together - good idea and a good taste (and design...) - congratulations, Mladen!
----
bb squeeze added to LR_trend_histo (just because & 2 have a bit disharmony  )
)
LR Rsquared Trend:
LRS & R2 - perfect match; naturally belonged together - good idea and a good taste (and design...) - congratulations, Mladen!
----
bb squeeze added to LR_trend_histo (just because & 2 have a bit disharmony )where can ı find mtf LR-trend indicator? Thanks...
From where can I download the original indicator LR trend?Please help me!
Re-uploaded the indicator code to the first post
regards
mladen
From where can I download the original indicator LR trend?Please help me!
Thanks a lot!
Re-uploaded the indicator code to the first post
regards
mladenThank you very much mladen... 

Cheers
Ethan Hunt
- Free trading apps
- Over 8,000 signals for copying
- Economic news for exploring financial markets
You agree to website policy and terms of use
A combination of linear regression slope and its offspring RSquared
Gray dots on indicator : trend is not confirmed by RSquared (no trend)
updated version posted here: https://www.forex-tsd.com/forum/debates-discussions/9164-lr-trend#comment_764107