Currency corelation
Hi forex experts,
I've been trying to learn/understand the correlation between currency pairs. If I take GBPUSD and EURUSD as the pairs that move in the same direction, can you please answer the following? The assumption is that both these pairs move up or down fairly closely.
If I buy GBPUSD and sell EURUSD, I expect these two pairs cancel each other each other Profit/Loss and end with a negative balance which is the sum of the spread from both the trades.
However when one pair moves drastically and the other pair has a low momentum, the theory is that these pairs will catchup eventually. But when and how?
On Sep 4th I bought 1 lot GBUSD and sold 1 lot EURUSD at the same time. Now these trades stand at GBPUSD at -4000 and EURUSD at +1700. Basically after trade GBPUSD is down by 400 pips while EURUSD moved ony 170 pips. That is a huge difference. My questions are,
- As these are correlated pairs, the price move has to come back to normal. Is GBPUSD going to go up ( to -170 pips from the current -400pips) to be in synch with EURUSD OR Is EURUSD going go down to (from +170pips to -400pips) to keep the correlation?
- Now the difference between these two pairs is 400-170=230pips. Is there are chance to buy/sell these pairs to pocket some money from the expected correlation?
Here is the trade information
trade-1
4-Sep-06 1:40pm buy GBPUSD @ 1.9065
current price : 1.8652
current pl : -4000
trade-2
4-Sep-06 1:40pm SELL EURUSD @ 1.2855
current price : 1.2677
current pl : -1700
any help is appreciated.
Thanks.1- Strong positive correlation: The pairs are going at the same direction and very close to each others: Example: eurusd and gbpusd are strong positive correlation.
2- Strong negative correlation: The pairs are going at the opposite direction and very close to each others: Example: eurusd and usdchf are strong positive correlation.
3- Weak (or No) correlation: The movement of the 2 pairs is not related to each others at all or it's very weak!
But: The strong correlation between 2 pairs doesn't mean that the 2 pairs have to move the same strength all the time! And doesn't mean that if one of the pairs moved stronger at anytime the other pair has to go to compensate the missed movement!1- Strong positive correlation: The pairs are going at the same direction and very close to each others: Example: eurusd and gbpusd are strong positive correlation.
2- Strong negative correlation: The pairs are going at the opposite direction and very close to each others: Example: eurusd and usdchf are strong positive correlation.
3- Weak (or No) correlation: The movement of the 2 pairs is not related to each others at all or it's very weak!
But: The strong correlation between 2 pairs doesn't mean that the 2 pairs have to move the same strength all the time! And doesn't mean that if one of the pairs moved stronger at anytime the other pair has to go to compensate the missed movement!Codersguru,
Thanks for the quick response. I will feel that there has to be some market correction going to happen to bring the GBPUSD and EURUSD pairs to the way they were 3-4 days back. Reason being one pair moved 400pips while the other moved only 170pips. Not sure which currency is going to make the next big move to correct the 230pips difference between GBPUSD and EURUSD.
Correlation Strategies
Hi all,
I have some information about correlation trading that I have developed for my group. I personally lean more towards reinvesting for the interest earned rather than trading for the swing profits, though I do take those when they present themselves. It is the Ferengi Rule of Profits #40. 
Using a very conservative approach I have been earning 10%+/month with this system, and almost zero time messing with my account.
I have a little bit about this in another thread of mine, but I am attaching several rough files as well as an EA that will run in demo accounts so that you can test out your ideas with a little robot help. One nice thing is that it will send email updates when you want, which gives you a record of activity that you can review.
Hope this all helps,
Bill
The best way to hedge is to earn swaps/interest while holding.
Hi all,
I have some information about correlation trading that I have developed for my group. I personally lean more towards reinvesting for the interest earned rather than trading for the swing profits, though I do take those when they present themselves. It is the Ferengi Rule of Profits #40.
Using a very conservative approach I have been earning 10%+/month with this system, and almost zero time messing with my account.
I have a little bit about this in another thread of mine, but I am attaching several rough files as well as an EA that will run in demo accounts so that you can test out your ideas with a little robot help. One nice thing is that it will send email updates when you want, which gives you a record of activity that you can review.
Hope this all helps,
BillDo you have some setting file for this ea so i can try it please?
Cheers Mark
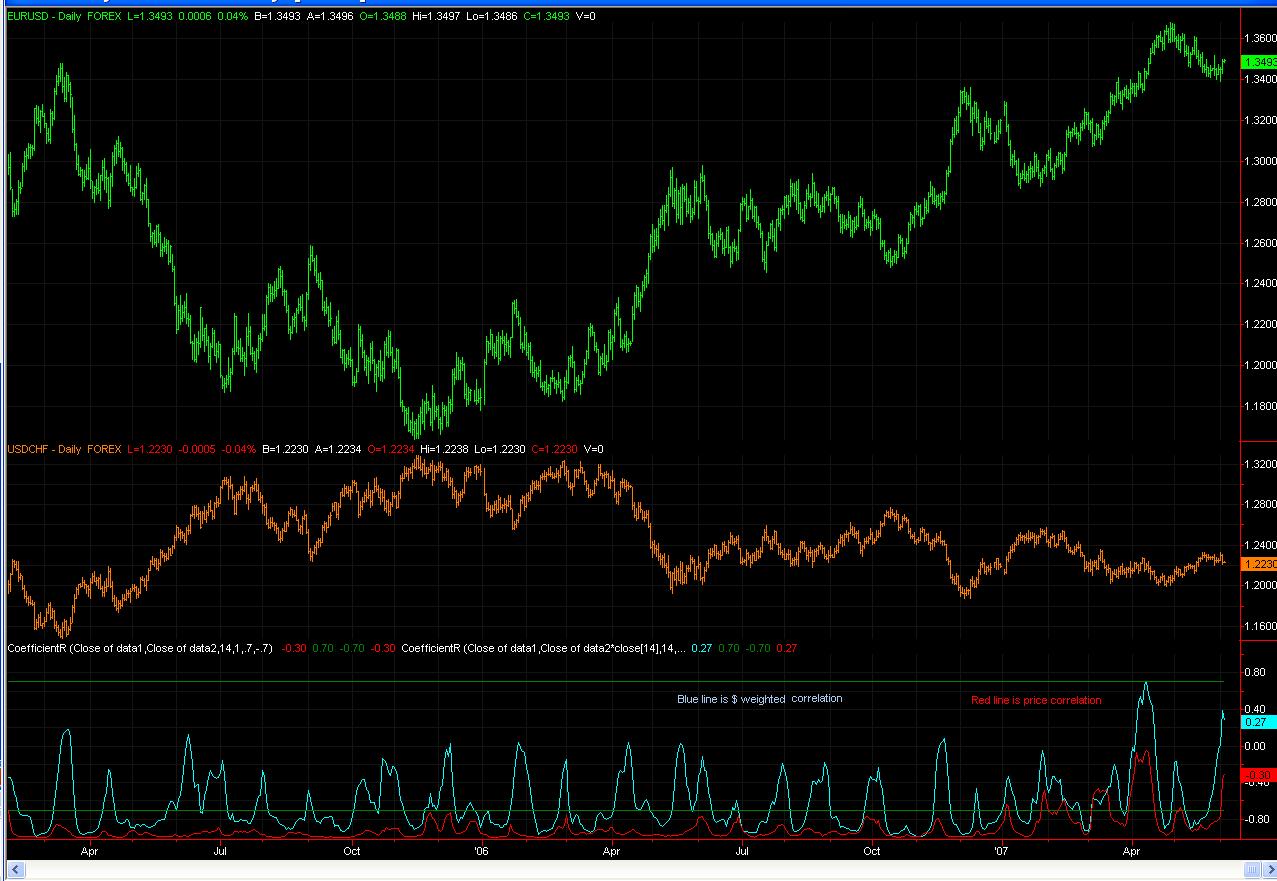
Looking for Weighted Dollar Correlation Pair Indicator
Greetings, I found this screen shot at another forum of a very interesting correlation indicator that considers the weighted dollar values. Unfortunately, the indicator was never posted and the poster is gone...Any ideas would be greatly appreciated.
Correlation System Webinar Upcoming
I will be attending a webinar later in November on psudo-correlation trading.
I am on a student waiting list until the minimum number of students requirement is filled for November.(15-20) students. If anyone would like a link to learn more send me a PM with your email. I am not getting kickbacks for new enrollees...only getting the class opened again faster if more show interest. I also am not into selling email addresses or spamming. Your email will not be given out to anyone by me.
Autocorrelation & Hurst Exponent
Hi,
does anyone have an indicator that calculates the autocorrelation of the chart you put it on?
Also, I have an indicator that calculates the Fractal Dimension of the chart (timeseries), but this seems to be a time-dependent (changes per bar) result, while I have always read that it should be 1 number, which really doesn't change when you add new lines to your timeseries (in this case, when you have new candles), but the timeseries should be long enough in the first place.
Autocorrelation - Wikipedia, the free encyclopedia
Hurst exponent - Wikipedia, the free encyclopedia
The reason for this is simple: imagine being able to select automatically whether you're trading a random signal or a non-random one, and a series with persistent trends or antipersistent trends: if you have a trend-following strategy you should chose the one with the highest autocorrelation (and the highest Hurst exponent (>>0.6) to make your strategy work, if you're trading a range-trading strategy you should choose the timeseries (symbol) with the most anti-persistent trends (H<0.4) and offcourse you should always choose for the timeseries with the highest autocorrelation.
Maybe it could be nice to start with a topic where we go a little deeper into the time series analysis aspect (selection of which currency and which timeframe to trade)?
Any suggestions / comments / indicators?
Hi
Attend online the next instant webinar to learn about the worldwide foreign currency market (Forex) and the products and services offered by Pro Financial FX....
- Free trading apps
- Over 8,000 signals for copying
- Economic news for exploring financial markets
You agree to website policy and terms of use
Hi forex experts,
I've been trying to learn/understand the correlation between currency pairs. If I take GBPUSD and EURUSD as the pairs that move in the same direction, can you please answer the following? The assumption is that both these pairs move up or down fairly closely.
If I buy GBPUSD and sell EURUSD, I expect these two pairs cancel each other each other Profit/Loss and end with a negative balance which is the sum of the spread from both the trades.
However when one pair moves drastically and the other pair has a low momentum, the theory is that these pairs will catchup eventually. But when and how?
On Sep 4th I bought 1 lot GBUSD and sold 1 lot EURUSD at the same time. Now these trades stand at GBPUSD at -4000 and EURUSD at +1700. Basically after trade GBPUSD is down by 400 pips while EURUSD moved ony 170 pips. That is a huge difference. My questions are,
- As these are correlated pairs, the price move has to come back to normal. Is GBPUSD going to go up ( to -170 pips from the current -400pips) to be in synch with EURUSD OR Is EURUSD going go down to (from +170pips to -400pips) to keep the correlation?
- Now the difference between these two pairs is 400-170=230pips. Is there are chance to buy/sell these pairs to pocket some money from the expected correlation?
Here is the trade information
trade-1
4-Sep-06 1:40pm buy GBPUSD @ 1.9065
current price : 1.8652
current pl : -4000
trade-2
4-Sep-06 1:40pm SELL EURUSD @ 1.2855
current price : 1.2677
current pl : -1700
any help is appreciated.
Thanks.