Gold is Reaching at 1270
buy gold at 1258 TP 1270 TP2 1280 SL 1254
buy gold at 1258 TP 1270 TP2 1280 SL 1254
On the small timeframe charts gold seems to be stopped at 1258.
Why do you say it's a buy ?
buy gold at 1258 TP 1270 TP2 1280 SL 1254
If you are talking about XAUUSD so that's right: resistance level is 1259 or 1258 in your case (i am using this indicator to see those levels) :

How can we know: correction, or bullish etc (in case of using indicator for example)?
well ... let's take AbsoluteStrength indicator from MT5 CodeBase (fixed version of the indicator is on this post #4).
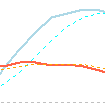
bullish (Bull market) :
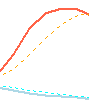
bearish (Bear market) :
ranging (choppy market - means: buy and sell on the same time) :
flat (sideways market - means: no buy and no sell) :
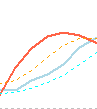
correction :
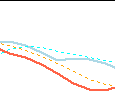
correction in a bear market (Bear Market Rally) :
How can we know: correction, or bullish etc (in case of using indicator for example)?
well ... let's take AbsoluteStrength indicator from MT5 CodeBase.
bullish (Bull market) :
bearish (Bear market) :
ranging (choppy market - means: buy and sell on the same time) :
flat (sideways market - means: no buy and no sell) :
correction :
correction in a bear market (Bear Market Rally) :
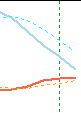
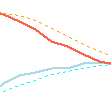
red lines are for sell (sell lines), blue lines are for buy (buy lines). So, bullish (uptrend) and bearish (downtrend) are separated by color of the lines in this indicator. Buy is main blue line is above blue signal line and both are in uptrend. If "no buy within sell" - this is correction. if "no buy" and "no sell" - this is flat.
Gold Technical analysis for the next week (adapted from Is the Gold Rebound Over? Techs Suggest No, FOMC to Confirm article)
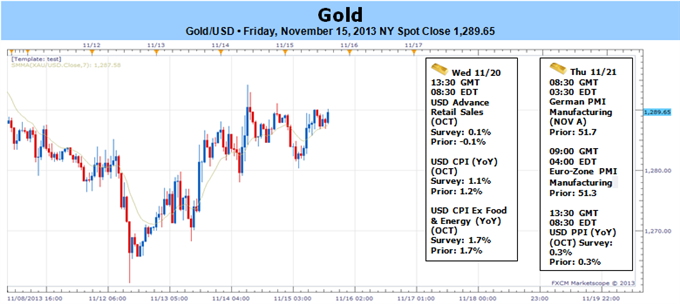
Fundamental Forecast for Gold: Bullish
- Gold Follows Through on Inside Day Trade Setup
- Gold Prices Forecast to Fall Further
- Commodities: Crude Oil, Gold Look to US Jobs Data for Direction
Gold prices snapped a two week losing streak with the yellow metal up a fractional 0.02% ahead of the of New York close on Friday. Despite the rather negligible change on the week, prices did see a good deal of volatility as waning strength in the greenback helped gold mount a counteroffensive off key support earlier in the week. Note that the Gold/USD inverse correlation hit its strongest levels since early 2012 this week and USDOLLAR price action may continue to offer guidance as we move deeper into November trade.
Investors will be closely eying economic data as the US docket picks back up with retail sales, existing home sales, and minutes from the latest FOMC policy meeting on tap. In the wake of the stronger than expected NFP and GDP reads earlier this month, the prints could offer some volatility as improving US data continues to limit the Fed’s scope to maintain its ultra-accommodative stance. As such, look for strong US metrics to possibly limit this near-term advance in the meantime as traders look to the Fed for further clarity on future policy.
Aside from the data, look for central bank rhetoric to shift broader market sentiment with 8 of the 12 voting FOMC members scheduled to speak over the coming days. With the market’s central focus fixated on central bank forward guidance, all eyes turn to the FOMC with a barrage of speeches from the likes of Rosengren, Dudely, Evans, Bullard, Powell, George, Tarullo and the Fed Chairman himself. As Fed Chair nominee Yellen refrains from undermining the taper-timeline laid out by Ben Bernanke, fresh developments from the FOMC Minutes / Fed speeches may heavily impact gold prices next week as market participants weigh the outlook for monetary policy. Look for a more dovish stance to sustain the recent rebound off key support – while a more hawkish tone would likely offer a pullback into favorable long entries in the near-term.
From a technical standpoint, gold failed to break below key support at $1268/70 and with inside day made on Wednesday, the risk of a more meaningful rebound higher here remains our focus. As such, our near-term bias shifts to the topside above key support noting resistance targets at $1299, $1306 and the 61.8% retracement from the decline off the October high at $1323. The broader outlook remains bearish below the November opening range highs at $1327. A break / close below $1268 puts the broader decline off the October high back into play with targets eyed at the 61.8% extension taken from the August high / the October low at $1249/50, and a key Fibonacci confluence at $1233/34.
- Michael Boutros
- www.dailyfx.com
- Free trading apps
- Over 8,000 signals for copying
- Economic news for exploring financial markets
You agree to website policy and terms of use
Gold is Reaching at 1270