Join our fan page
- Views:
- 35222
- Rating:
- Published:
- 2008.11.10 07:20
- Updated:
- 2014.04.21 14:53
-
Need a robot or indicator based on this code? Order it on Freelance Go to Freelance
Author: not specified
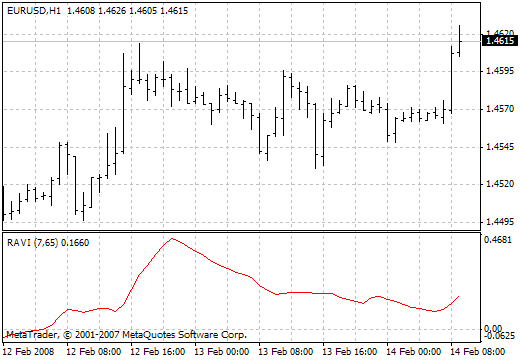
It is developed on the other principle, not on ADX's. Chand suggests 13-weeks SMA as a basis of the indicator. It represents quarter (3 months = 65 working days) behavior of the market populance about price. The short average is 10% of the long one and is roughly equal to seven.
T. Chand recommends the following information lines for the indicator: plus-minus 0.3% or 0.1% (depending on the market). There is a belief that the up trend began if the indicator crosses the upper information line bottom-up. And there is also a belief that the down trend began if the indicator crosses the lower information line from top downward. The trend is considered as continuing as long as the RAVI line grows. The down trend - as long as the RAVI line falls. If the indicator turns back to the zero line it means that the trend is over and the channel has began. But if the indicator turns back again not passing between the information lines it means that the trend has resumed.
The indicator in itself is very simple and is almost identical to the Price Oscillator and MACD. The unique thing is the usage of the conergence-divergence rate indicator as a trend pointer, paying attention to the divergence exactly and not to the averages intersection.
If we consider the method of ADX drawing then we can note that the indicator has two smoothings. RAVI has one smoothing. This makes the indicator more sensitive, and it alerts about the beginning and the end of the trend earlier than the 18-days ADX.

 Expert Advisor Based on FXRaider's Trade Strategy
Expert Advisor Based on FXRaider's Trade Strategy by ForTrader.ru.
 Moving Average Based on Demark's Approaches
The drawing of the moving average is performed on the basis of Demark's method "Daily Range Projections". Indicator on a zero bar points at the future price change.
 Eugene
The minimums and maximums of the previous day are used. I'm sorry that I wrote it without comments.
 Daily range
Forecasting of price daily ranges. This indicator shows the resistance and support levels of the current day.