Join our fan page
- Views:
- 4597
- Rating:
- Published:
- 2011.04.26 11:52
- Updated:
- 2016.11.22 07:32
-
Need a robot or indicator based on this code? Order it on Freelance Go to Freelance
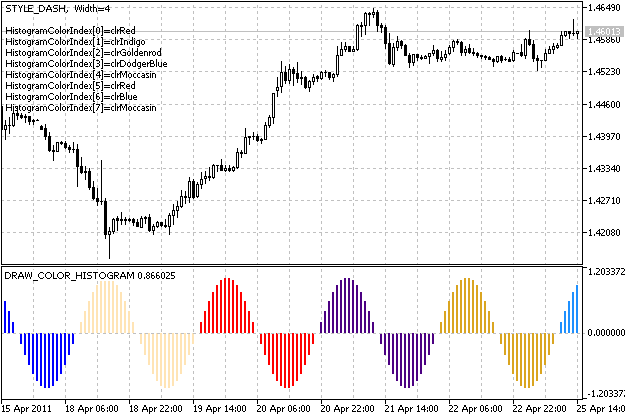
This indicator is a demo of DRAW_COLOR_HISTOGRAM drawing style.
It plots a sin(x) function as a color histogram in a separate window. Two indicator buffers are used: the first contains the values of sin(x) function, the color indexes specified in the second indicator buffer.
The histogram colors, the width and line style changed randomly after N=5 ticks. The initial properties of the plot1 graphic plot are defined using the #property preprocessor directive, further these properties changed randomly (see OnCalculate() function).
See also The Drawing Styles in MQL5.

Translated from Russian by MetaQuotes Ltd.
Original code: https://www.mql5.com/ru/code/343
 DRAW_COLOR_SECTION
The DRAW_COLOR_SECTION drawing style is used to plot sections with different colors, the colors are specified in the color buffer.
 DRAW_COLOR_LINE
The DRAW_COLOR_LINE drawing style is used to plot lines with different colors, the colors are specified in the color buffer.
 DRAW_COLOR_HISTOGRAM2
The DRAW_COLOR_HISTOGRAM2 drawing style is used to plot color histograms using two indicator buffers, the colors are specified in the color buffer.
 DRAW_COLOR_ARROW
The DRAW_COLOR_ARROW drawing style plots the color arrows (symbols from Windings font).