Join our fan page
- Views:
- 4548
- Rating:
- Published:
- 2018.09.16 13:51
-
 You are missing trading opportunities:
- Free trading apps
- Over 8,000 signals for copying
- Economic news for exploring financial markets
Registration Log inYou agree to website policy and terms of use
If you do not have an account, please register
-
 Need a robot or indicator based on this code? Order it on Freelance
Go to Freelance
Need a robot or indicator based on this code? Order it on Freelance
Go to Freelance
Basics :
RSI (Relative Strength Index) indicator (originally developed Welles Wilder) is, due to its very long usage, well known and is widely used indicator. Sometimes it is used in a combination of some filtering method (mostly levels crossing) in order to avoid some of the false signals that RSI might produce in some market conditions. This is one more version that will attempt to address the issue by using two filters on this version of RSI
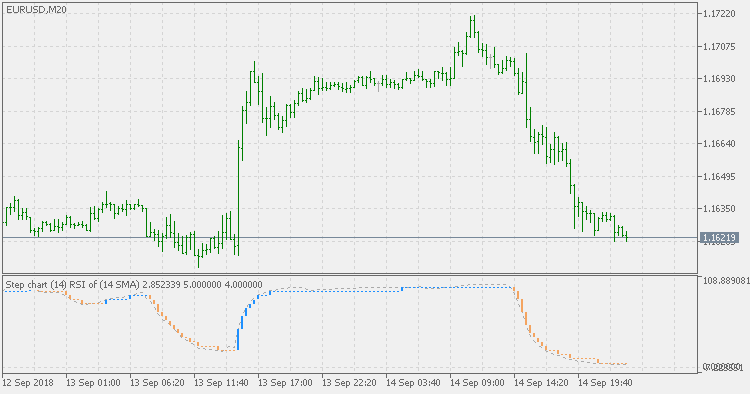
This version :
This version is using step chart as a filter to lessen the number of signals produced by RSI and (if possible) to make it easier and safer to use. The step size is to be entered as RSI % that you wish to be used as a filter for minimal RSI change that should be considered as a significant change. It also can use averages for price filtering prior to be used in stochastic calculation. That way the RSI can be "double filtered" (filtering the price prior to be used in RSI calculation and then using the step chart filter on the calculated RSI result). The averages that can be used in this version :
- simple moving average
- exponential moving average
- smoothed moving average
- linear weighted moving average
Usage :
You can use color change of the step bar as signals
 Step chart of stochastic of averages
Step chart of stochastic of averages
Step chart of stochastic
Step chart of stochastic