Analysis of the dynamics of the MICEX stock index (MOEX), 01/10/2024.
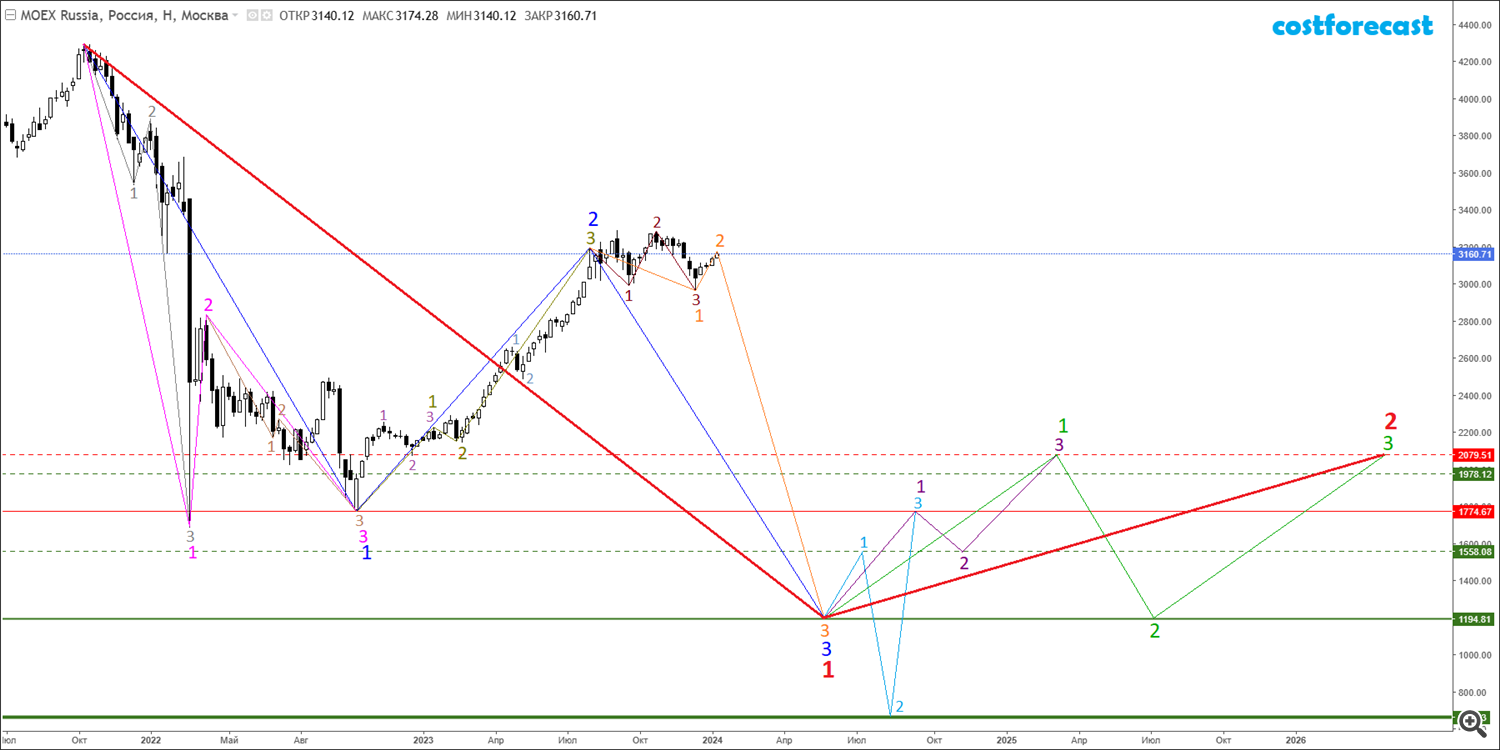
As of 01/10/2024, the results of the analysis of the fractal structure of the graph of the dynamics of the values of the MICEX stock index (MOEX) give reason to assume that in the fractal structure of the graph there is a formation of a fractal, indicated in blue, representing the 1st segment of the fractal of one higher order, indicated in red color.
If we assume that on the time interval (10/11/2021; 10/10/2022) the 1st segment of the blue fractal was formed, and on the interval (10/10/2022; 08/04/2023) the 2nd segment was formed, then the future dynamics of the MICEX index values will be in a downward trend within the framework of the formation of the 3rd segment of the blue fractal with the end of the bearish trend at around 1195 points.
The 1st segment of the blue fractal was formed in the form of fractal F№33 (from the Alphabet of Attractors Niro) of one lesser order, which is indicated in pink on the graph. The 2nd segment of the blue fractal was formed in the form of a fractal F№11 of one lesser order, which is indicated on the chart in olive color.
The first segment of the pink fractal is a fractal of one order less, which is indicated on the chart by the gray fractal F#12 on the time interval (10/11/2021; 02/24/2022). The 2nd segment of the pink fractal formed as a mono segment on the time interval (02/24/2022; 04/04/2022). The 3rd segment of the pink fractal was formed on the time interval (04/04/2022; 10/10/2022) in the form of fractal F№21, indicated in light brown.
If we assume that between the point with coordinates (10.10.2022; 1775.04) and the point with coordinates (04.08.2023; 3194.83) the olive-colored fractal represents the 2nd segment of the blue fractal, then the current dynamics of the MICEX index values is in the stage completion of the 2nd segment of the orange fractal, which represents the 3rd segment of the blue fractal. The first segment of the orange fractal was formed on the time interval (08/04/2023; 12/15/2023) in the form of fractal F№23, which is indicated in dark brown.
Based on these assumptions, we can say that the most likely scenario for the development of dynamics will be a fall in the stock market to the level of 1200 points as part of the formation of the 3rd segment of the orange fractal.
The orange fractal completed in this way will be the third segment of the blue fractal, which will represent the 1st segment of the fractal of one higher order, indicated in red.
After the market falls, the dynamics of the MICEX index values will continue in a sideways trend as part of the formation of the 2nd segment of the red fractal in the range of values (1195; 2080).


