

Traders widely use the Fibonacci retracement and expansion levels as a technical analysis tool to determine price support and resistance, and also to determine the continuation or rejection of a trend. Traders focus on the price reacting at these levels to enter or exit a trade. By applying them on multiple timeframes, you get common price levels that act as key areas of interest. To derive these retracement levels, the previous period/timeframe 'High' and 'Low' values are used for calculation.
We calculate the retracement levels based on the Fibonacci sequence of numbers, whose ratios provide levels where prices retrace, before the trend continues in the original direction. The most used ratio levels are 23.6, 38.2, 50.0, 61.8 and 76.4 or 78.6.

| While we use the retracement levels as entry signals, Fibonacci strategies use expansion levels for profit taking. The Fibonacci expansion levels consider three points instead of two in case of retracements. Besides the low<->high or high<->low (A and B), the retracement level (C) is considered for the expansion level (D). The expansion levels widely used are 123.6, 161.8 and 200. Traders also use 61.8 and 100 expansion levels to cover positions depending on price retracements. |  |
'Fibonacci Dimension' indicator allows visual display of the levels described above in its entirety. It automatically takes the previous high and low for two user-defined timeframes and calculates their Fibonacci retracement levels. It also considers the retraced level to draw the expansions on every change of price. The complete visual dimension in multiple timeframes allows deriving profitable strategies for execution.

| The functionality included in 'Fibonacci Dimension' indicator are:
|
|
This document explains the functionalities and is a guide on how to configure the indicator.
| Indicator Settings |
| | : | You can temporarily disable the indicator rather than deleting it. |
| | : | Unique identifier for the indicator on the chart. This is useful when multiple instances of "Fibonacci Dimension" with same timeframes is to be shown. Each object shown for the panel is differentiated by the identifier internally to avoid conflict. Change the text for each instance: Fibonacci Dimension - Instance 1 - Indi1 Fibonacci Dimension - Instance 2 - Indi2 |
| | : | Select the option for the Fibonacci Retracements, Extension and Expansion levels. The indicator will take the preset values with the specified inputs or take values from the custom edited files stored in the following folder: Please refer to the "Fibonacci Levels » Custom version » Files" section of this user guide to understand the contents of the custom files. The Fibonacci levels considered in preset version are (shown separated by commas): Retracement: 0,23.6,38.2,50,61.8,76.4,78.6,100 Extension: 123.6,161.8,200 Expansion: 61.8,100,123.6,161.8,200,261.8 |
| Fibonacci Levels » Preset version » Inputs |
| | : | Indicator allows the selection of 76.4 or 78.6 retracement level. |
| | : | Choose the Fibonacci Levels from the preset Fibonacci retracement levels to be considered for calculating the mid range values to be displayed for #1 » The Outer Higher timeframe. |
| | : | Choose the Fibonacci Levels from the preset Fibonacci retracement levels to be considered for calculating the mid range values to be displayed for #2 » The Inner Lower timeframe. |
| Fibonacci Levels » Custom version » Files |
Fibonacci Dimension indicator will automatically generate the requisite folder and copy files with preset values to MetaTrader Data folder (refer Addendum at the end of this user guide on how to access Data folder) under the following path:
MQL<version> \Files\Fibonacci Dimension\Config
The files copied are:
- Retracement.txt
- Extension.txt
- Expansion.txt
The above files can be edited with your preferred Fibonacci levels and saved. You may specify the levels separated by commas. These values will be used by Fibonacci Dimension indicator for calculation and display. The contents of the files are shown in the below:

NOTE: The mid-range values separated by | in the Retracement.txt file will be considered by both #1 (Higher TF) and #2 (Lower TF). This is unlike the case of preset version where each can be selected as an input.
You can select mid-range levels to be shown as a different color for the outer (#1) and inner (#2) zone. My mid-range display is usually 23.6 to 50.0, as I have noticed these levels have strong support and resistance. Please note that though the input properties and Retracement.txt file has “Mid Value High” and “Mid Value Low”, the indicator supports both the bullish and bearish candle retracement levels and will automatically sort them accordingly for display.Validation Checks:
| Retracement.txt |
|
| Extension.txt |
|
| Expansion.txt |
|
| Configure the Timeframes & Expansion levels |
You can select the timeframes used for outer (#1) and inner (#2) zones.
| | : | The indicator adds ‘Year’ to the standard timeframes in MetaTrader. You may have noticed that MT5 has additional timeframes than MT4, and the indicator accordingly displays them in the list as per the version of the indicator. Please note that the selected timeframe should be higher than the current period in the chart. For e.g., you cannot have a ‘M30’ timeframe displayed if the current period on chart is ‘H1’. The indicator uses the #1 timeframe to draw the outer zone, while inner zone has the #2 timeframe. #1 timeframe should be higher than #2 timeframe. |
| | : | You may decide to hide display of the inner (#2) zone. If false, the indicator ignores the values entered for #2. |
| | : | The indicator allows you to indicate whether the expansion levels are shown for the #1 and #2 time frame. NOTE: The expansion levels are automatically drawn if selected. It will automatically check on the retracement level reached and display the expansion levels automatically. |
| Displaying the Outer and Inner Zones |
The indicator allows you to configure the display of the outer and inner zone. In case over one set of multiple timeframes is required (multiple instances of the indicator), this section explains on how it can be done.
  | : | The indicator allows following options for start of zone display: 1. Start as per selected TF - The start of the zone is from the time of the selected timeframe (as current). 2. Start from the Current Bar - The zone starts from the current bar of the chart period. 3. Show as per Bar Width - This option displays the complete zone ahead of the current bar. For this option, it considers the Zone Width value, otherwise ignored. This option enables support for multiple instances of the indicator on the chart. The indicator uses the values for “Zone ends ahead from Current Bar” and the “Zone Width” in conjunction. For e.g., Instance 1: 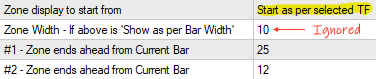 Instance 2:  Please note that in case the option is “Start from the Current Bar” or “Show as per Bar Width”, any left click of the mouse on the line or text will toggle the display of level line extended to the Timeframe start time and as per selected option. |
| Notification Alerts |
Notification alerts can be set for crossovers of the outer (#1) or inner (#2) mid range.
 | : | A notification alert will be triggered if candle for specified timeframe closes inside or outside the mid-range. The previous candle close should be on other side of the level. |

| Styling and Formatting |
Below explains on how you can configure the displayed line, text and colors used by the indicator.
| | : | You can configure the contents of the text label shown with the retracement levels. The following are the options: 1. Only Level Text 2. Timeframe with Level 3. Level with Price 4. Level with Timeframe and Price 5. No text |
| | : | Following are the styles for the line displayed for the levels: 1. Solid 2. Dash 3. Dot 4. Dashdot 5. Dashdotdot Only the ‘Solid’ line can have the thickness greater than 1. |
 | : | You can customise the color for the line displayed for retracement levels for outer (#1) and inner (#2) timeframes. It can apply the line color for: 1. Also apply to High/Low and Mid Range Lines 2. Apply only to High/Low but not the Mid Range Lines 3. Apply only to Mid Range Lines but not to High/Low Lines 4. Do not apply to High/Low and the Mid Range Lines The indicator displays the default color of the outer fill or mid range, if you want the line color not to apply for any level. Indicator also allows a selection of color for the expansion levels. |
 | : | You can customise the Font, its size and color displayed as text by the indicator. |
 | : | The indicator allows the selection of color to be filled by the outer (#1) and inner (#2) zones. Depending on the trend of the previous Timeframe (bullish or bearish) candle, the mid range color will change. |
| Please note: |
- The indicator will show errors in “Journal” and “Experts” tabs of the terminal/toolbox (Ctrl+T) window.
Disclaimer: Past performance may not show future results. You cannot hold me responsible for use of the indicator or for any information provided in this document.
| Addendum |
Following are the steps to add custom files (.wav) for notification alerts:
- Access the terminal_data_folder\MQL<version>\Files\Fibonacci Dimension\Sounds (in the terminal menu select to view "File" - "Open Data Folder" or by clicking Ctrl+Shift+D on MQL5)
- Copy your favourite sound files as the notification alert sounds and specify them as inputs for Fibonacci Dimension indicator.


