Tip: How to use The Ranging Market Detector: Early Re-Entry, Trending, Ranging, Directional Change
Did you know the Ranging Market Detector by Innovicient Ltd has numerous uses that help our clients? There are many ways in which you can use the Ranging Market Detector; this indicator is versatile and flexible. However, for the purpose of this post, and today, I will cover four key uses. They are all straight forward.
MQL5 Store (The Only Place you can buy our indicators): https://www.mql5.com/en/users/pipmontra/seller
Ranging Market Detector: https://www.mql5.com/en/market/product/66062
1.Identify New Trends Early
For you to enable the feature to facilitate opening of trades early during emergence of new trends, here are the steps to follow.
Step 1: Display Critical Boxes.
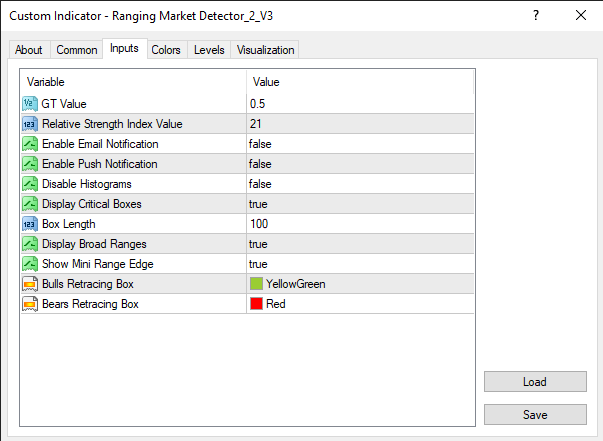
Fig.1. Ranging Market Detector Settings. Critical Boxes
Step 2: Consequently, the red and green dotted boxes appear.
A. Early Shorts Entries
Alternatives are four:
- After the Red dot forms, but wait for the candle to open below the Red box on the chart.
- After the YellowGreen dot forms, but a candle open below the YellowGreen box on the chart.
- If both the short-term and the Long-term signal lines are below 0 , but wait for the candle to open below the Red box on the chart.
- If both the short-term and the Long-term signal lines are above 0 , but a candle open below the YellowGreen box on the chart.
B. Early Long Entry
Similarly, there are four options to buy
- If both the short-term and the Long-term signal lines are above 0 , but wait for the candle to open above the YellowGreen box on the chart.
- If both the short-term and the Long-term signal lines are below 0 , but a candle open above the Red box on the chart.
- After the LightGreen dot forms, but wait for the candle to open above the YellowGreen box on the chart.
- After the Red dot forms, but a candle open above the Red box on the chart.
2. Identify a Choppy/Sideways Market and a Trend
Step 1: For this function of the Ranging Market Detector to be activated, you have to enable the display of Histograms in the “Disable Histograms” in the settings section. You do this by selecting “false” i.e. it should be as follows. Disable Histograms=false. However, by default, the value is set to “false.”See fig.4
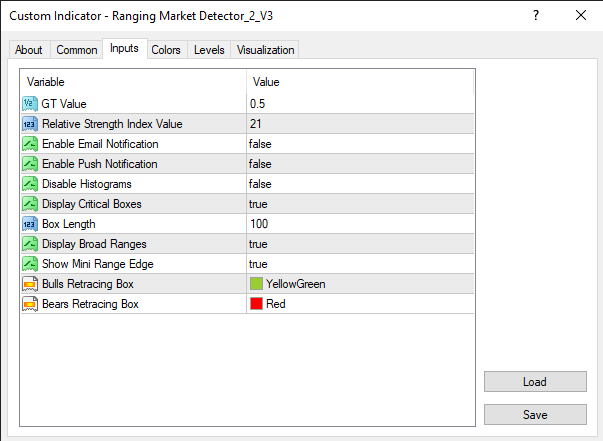
Fig. 4. Ranging Market Detector Settings. Histograms.
Step 2: Check whether there are histograms drawn or not. The market is Ranging, Retracing, or Changing direction if histograms are displayed. However, in this section, I will cover the indication of choppy/whipsawing and trending markets.
2a. Identify a Choppy/Sideways Market
When you see these histograms, the market has no momentum and is also lacking direction. Therefore, we advise that you stay out or take partial profit. Visibly, either or both of the signal lines are within levels -30 and 30. See fig.5 below. The right time to open a trade is after the histograms stop drawing.
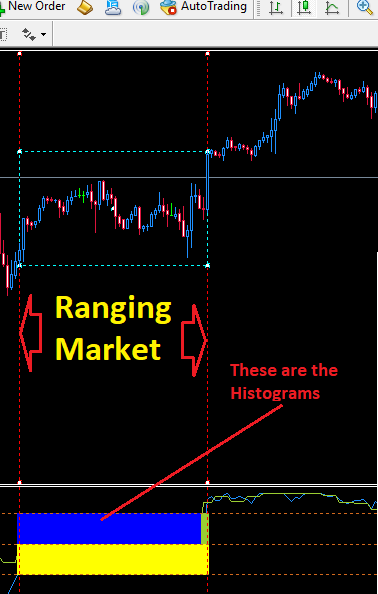
Fig. 5. Indication of a Ranging/choppy Market: Ranging Market Detector.
2b. Identify a Trending Market
The market always enters a trend after the ranging is over. Hence, you should activate the email and push notifications to alert you when the ranging market is ending. Whenever you see that no more histograms are being formed, the sideways market is officially over and the breakout has occurred. See fig.6.
· Most importantly, make sure that if you are looking for a buy, both signal lines are above 30 AND
· If you want to short, the two signal lines must be below -30.
Bonus: Besides, the Ranging Market Detector ALLOWS you to stay in a trend MUCH LONGER than any indicator out there. For example, in SP500-H1 Chart, the indicator continually stayed in buy mode for well over a month and all through giving buy re-entry opportunities. Therefore, even though it is an oscillator, it is able to inform you when there is a trend and also alert you when the asset is retreating from a TRUE oversold/overbought state. See fig. 7

Fig. 6. Indication of a Trending Market: Ranging Market Detector Showing Breakout.
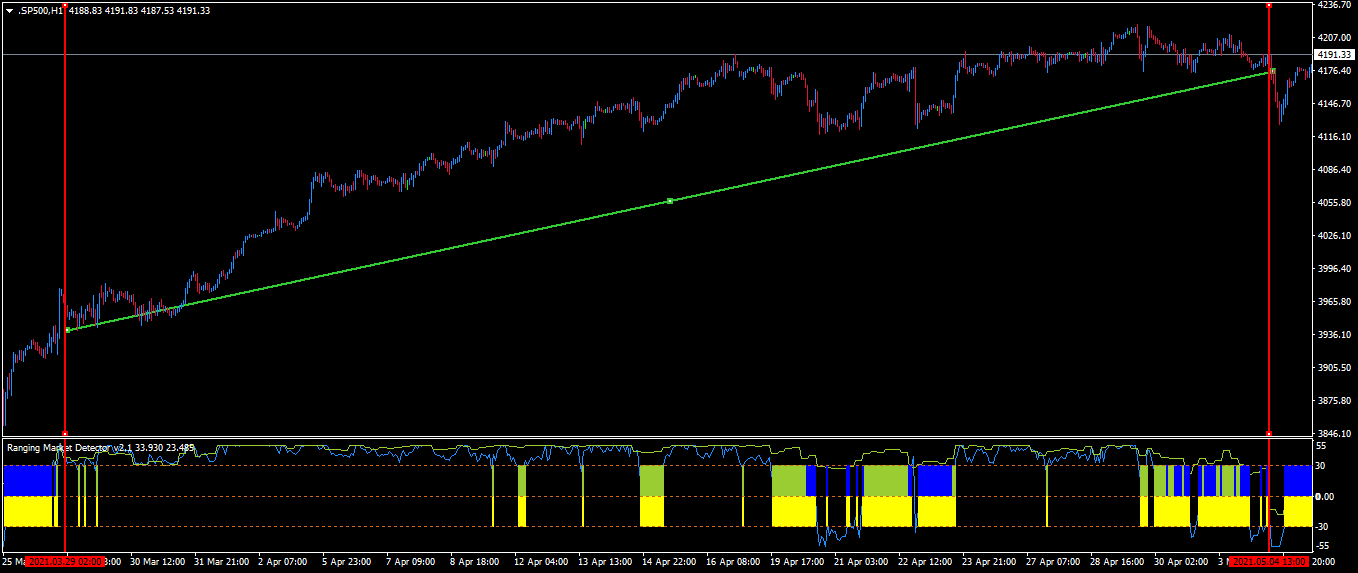
Fig. 7. Holding on a Trend for Over 30 days in 1H Chart-SP500. Ranging Market Detector.
3. Inform You of Early Change in Market Direction.
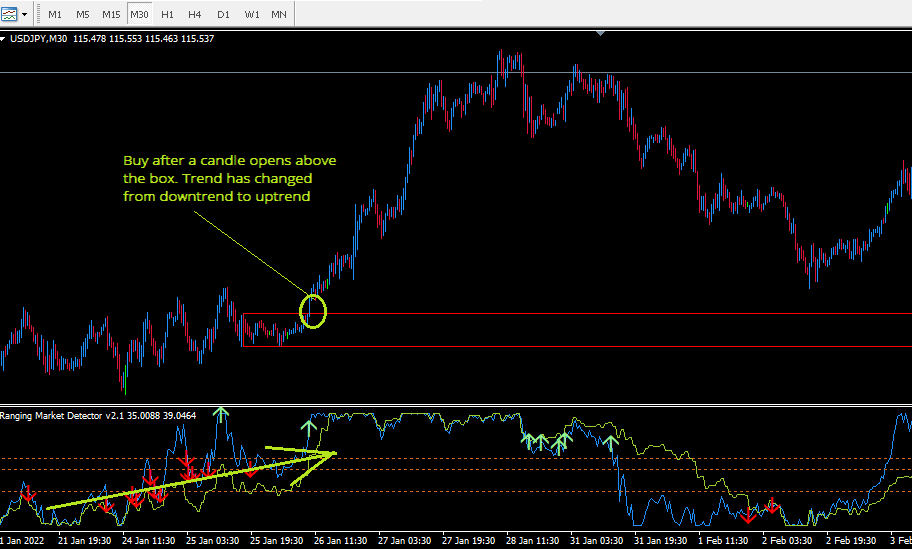
The Ranging Market Detector can show you the change of market direction.
A. To signify a transition from bears to bulls both the long-term and short-term signal lines close above -30 having pierced from below. However, the trend is confirmed if the price remains above the RED box
B. To indicate the bears are planning a takeover, the long-term and the short-term signal lines drop below 30 from above. Similarly, wait for the price to open below the GREEN box.
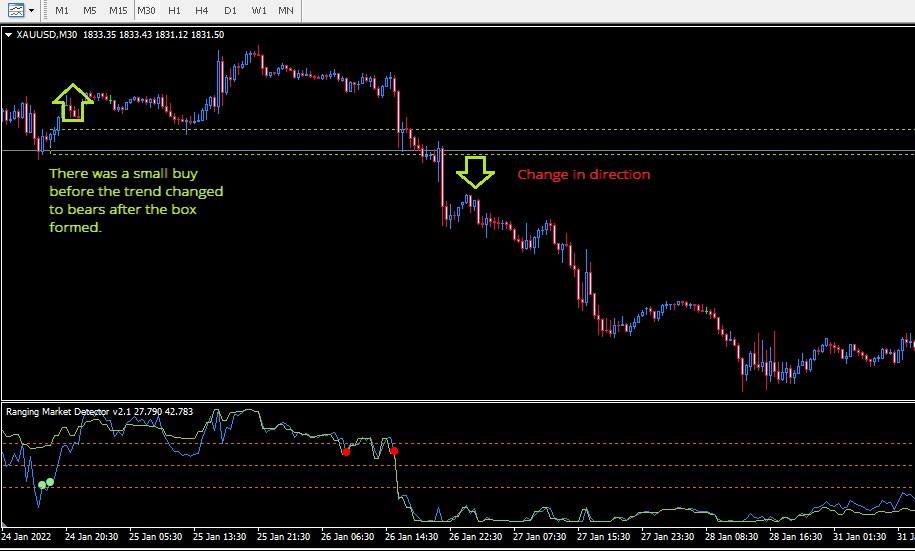
Fig.9. Detect When the Market is Changing Direction. Ranging Market Detector.
4.Detect When the Market has Finalized a Retracement
This part is simple.
A. Buy-Biased Retracement and Re-Entry Rules
1. First, the LONG-TERM signal line must be ABOVE 30.
2. Secondly, The green dotted box is displayed
3. Thirdly, Histogram(s) may form, LightGreen or Blue upper part. If LightGreen histograms form, buys will be stronger.
4. Lastly,Open long position if a candle opens above the green box.
5. If you are already in a trade, it would be a good time to move your SL below the box.
B. Sell-Biased Retracement and Re-Entry Rules
1. First, the LONG-TERM signal line must be BELOW -30.
2. Secondly, The Red dotted box is displayed
3. Thirdly, may Histogram(s) form, Red or Yellow lower part. If red histograms form, sells will be stronger.
4. Lastly, sell if a candle opens below the box.
5. If you are already in a trade, it would be a good time to move your SL above the box.
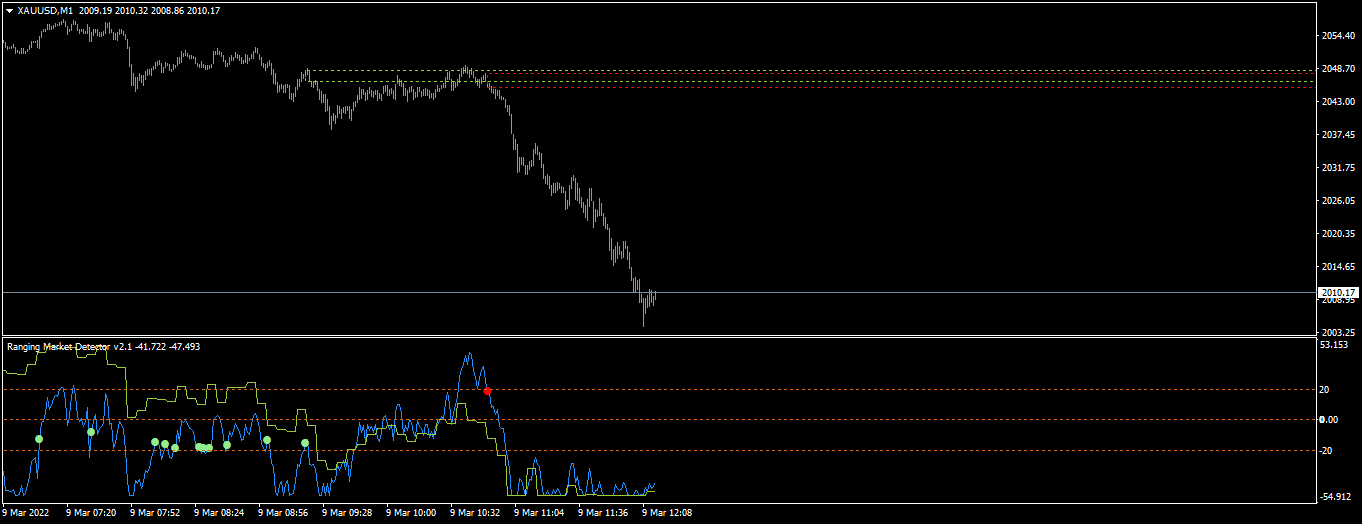
Alternative Usage of the Red and Green Zones
1. When the price is above the green zone and the red zone is also above the green, place a buy when price opens above the red zone.
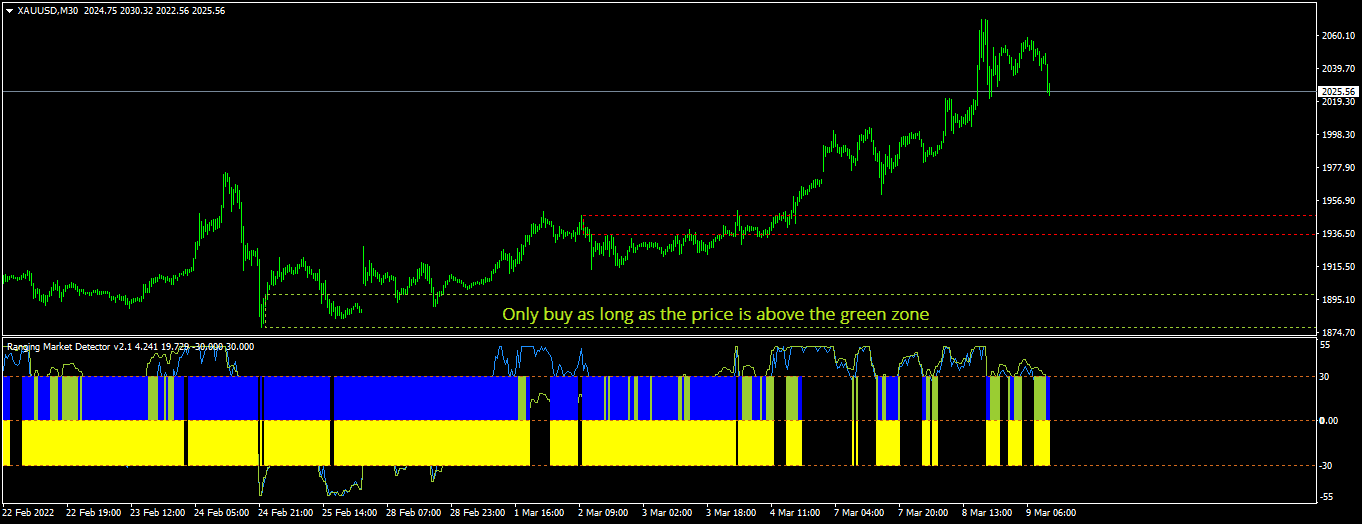
2. If the price is above the red zone and green zone forms, buy if price opens above the green zone.

3. Sell if the red zone is above the green one and price opens below the green.
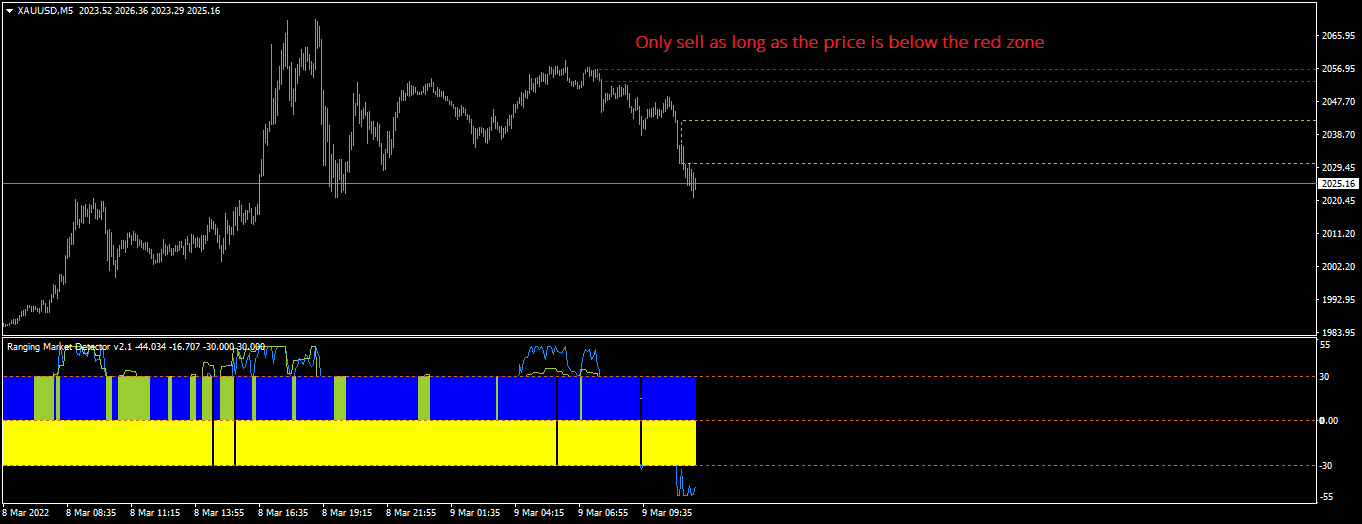
4. Sell if price opens below the red zone and the green zone is above the red one.
Lastly, this is your part. Is there any other way you see the Ranging Market Detector to be useful? Share with us. Every eye has its own depth of details. Help us improve for the future.
Write to us:
Write to us:
Facebook:
https://www.facebook.com/RangingMarkets
https://www.facebook.com/groups/rangingmarkets
Telegram Channel & Group:
https://t.me/joinchat/FBDhwoshNnQwMGZk
YouTube Channel:
https://www.youtube.com/c/RangingMarkets
Website:
https://www.innovicientfxsystems.wordpress.comMQL5 Store (The Only Place you can buy from)
