
Technical analysis of the GBPUSD currency pair at 11/08/2020
11 August 2020, 12:06
0
129
Yesterday the GBP / USD pair traded in different directions in the range of $ 1.3020-00 and closed the day without significant changes. Today the pair was also trading in a narrow range of $ 1.3065-95, staying close to yesterday's closing price. On the hourly chart, GBP / USD continues to test the strength of the support - the moving average MA (200) H1 ($ 1.3080). On the four-hour chart, the pair remains above the MA 200 H4 line. Based on the above, it is probably worth sticking to the northern direction in trading, and while the pair remains above MA 200 H1, it is necessary to look for buy entry points to form a correction.
Resistances are at: $ 1.3130, $ 1.3185-00, $ 1.3200
Support levels are located at: $ 1.3020, $ 1.2980, $ 1.2945
The main scenario for the pair's advance is continued growth to $ 1.3130 (the maximum of the European session on August 7). An alternative scenario implies consolidation below the MA 200 H1 level with a subsequent decline to $ 1.2945 (July 30 minimum).
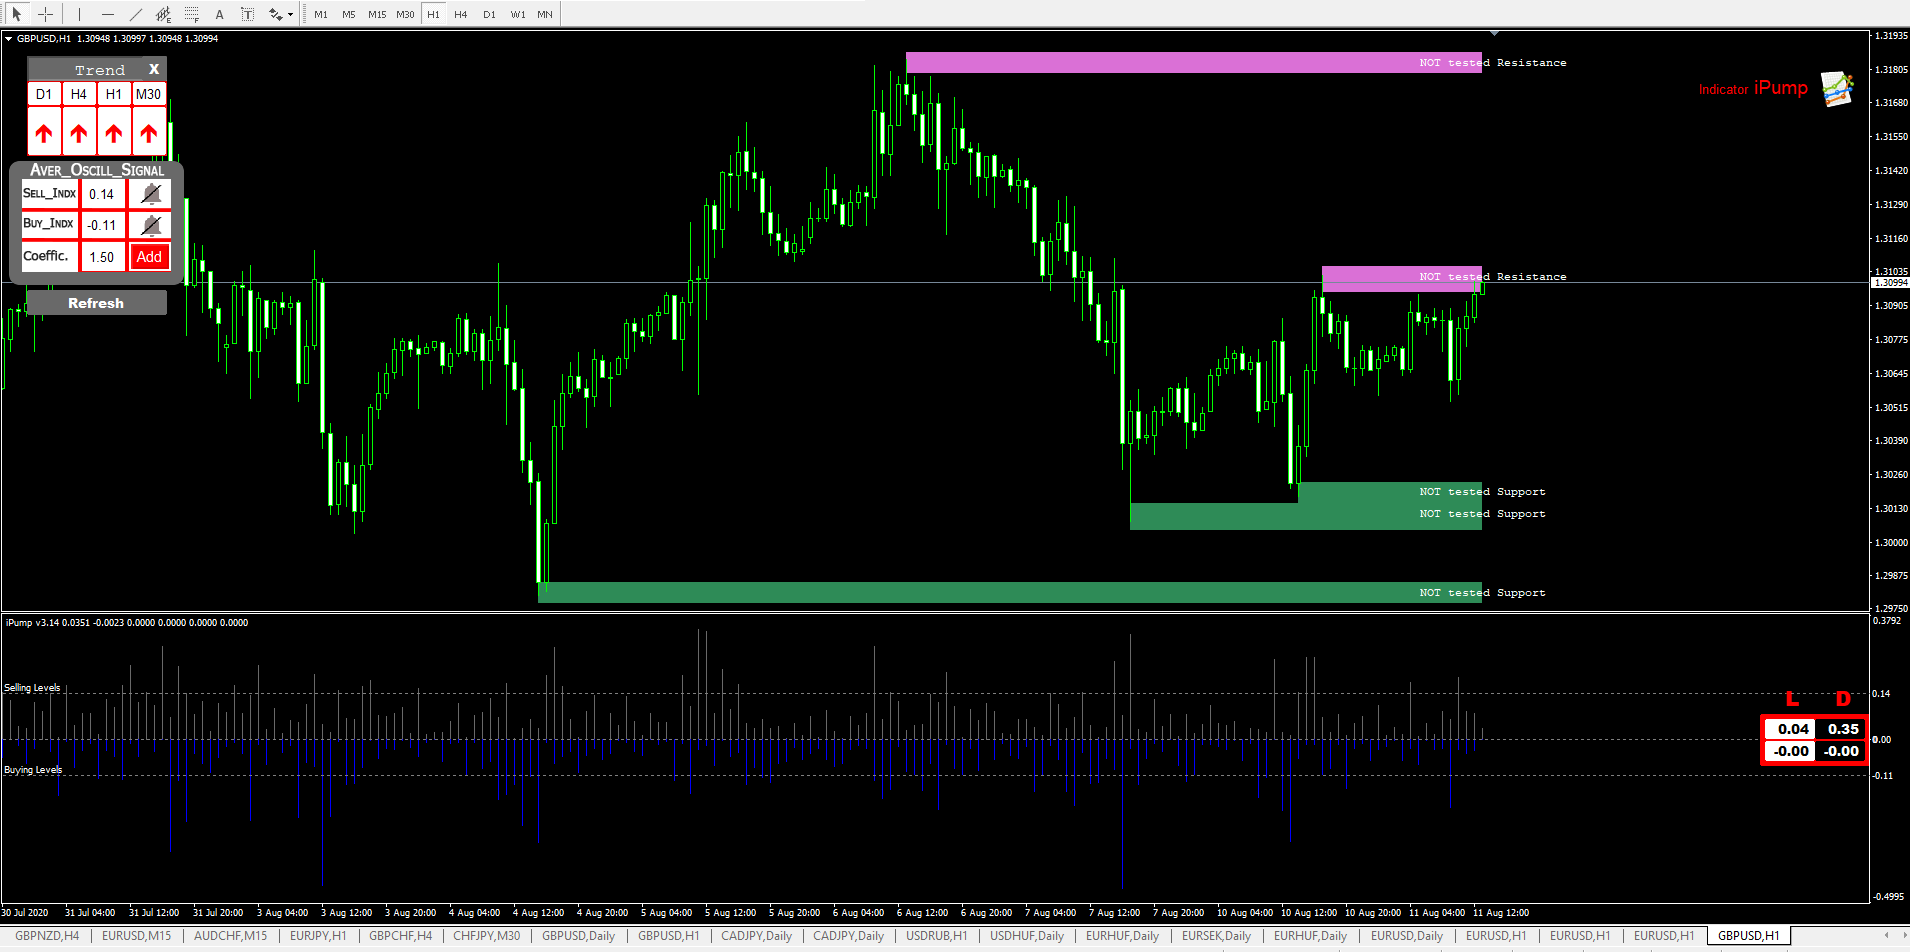
The iPump indicator was used for the analysis
https://www.mql5.com/en/market/product/39895
#GBPUSD, #Technical analysis of the GBPUSD at 11/08/2020, #forecast GBPUSD at 11/08/2020


