

---------------- TREND SYSTEM ----------------
Trend Screener Indicator

Trend Line Map Indicator
The Trend Line Map indicator is a Trend Line Scanner based on Trend Screener Indicator.
If you don't have Trend Screener Pro Indicator, the Trend Line Map Pro will not work.
1. What is the Trend Line Map Indicator ?
A technical indicator that is working as a module to display all TREND SCREENER Indicator signals ( TREND LINE ) as a Dashboard. The indicator will display on the Scanner :
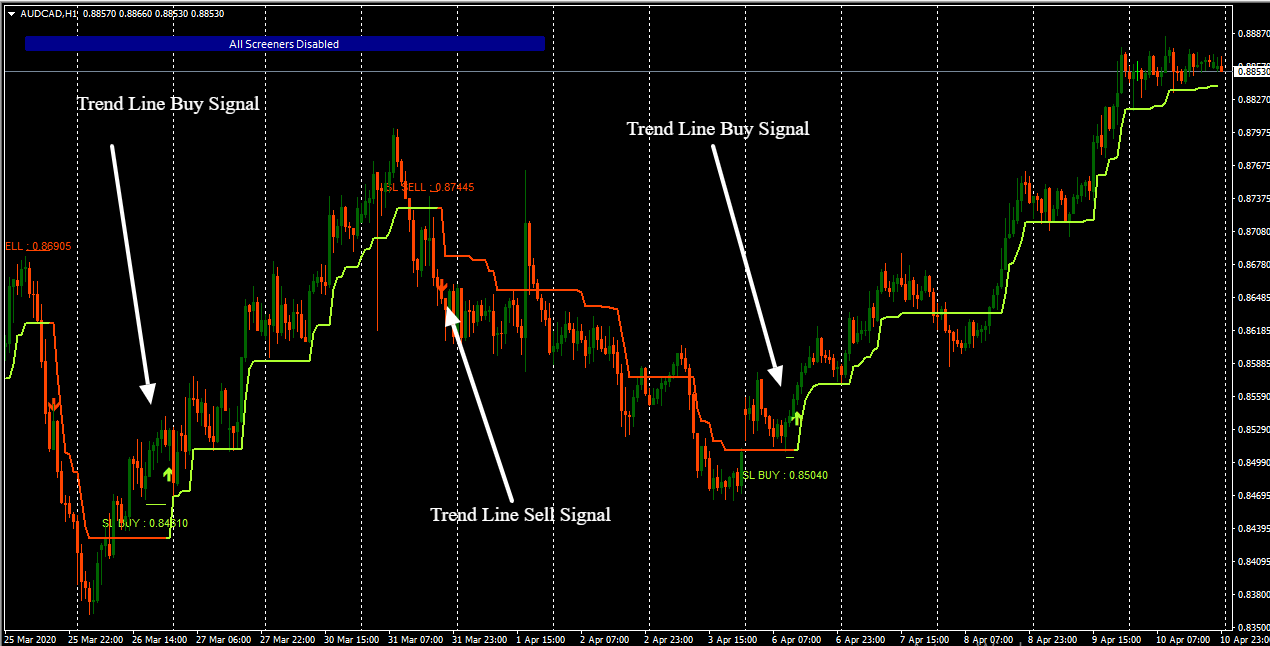
The Buy and Sell Signals are based Trend Line of Trend Screener Indicator.
- Active Buy/Sell Signals
- Generate Alerts when a new signals confirmed.
- Display the live profit/loss of all active signal.
- Display the starting of every active signal.
Trend Line signals are displayed as a dashboard with Trend Line Map Indicator.
1. How to run Trend Line Map Indicator ?
Step 1 : Download Trend Screener Indicator to your MT4.
Step 2 : Download Trend Line Map Indicator to your MT4.
Step 3 : Attach Trend Line Map Indicator.
Step 4 : It will take around 1 minute to calculate M30 signals and display all of them
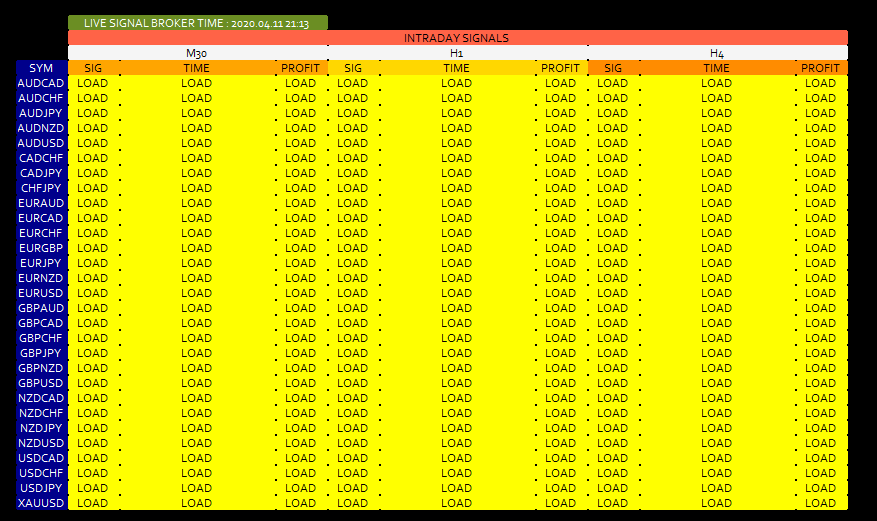
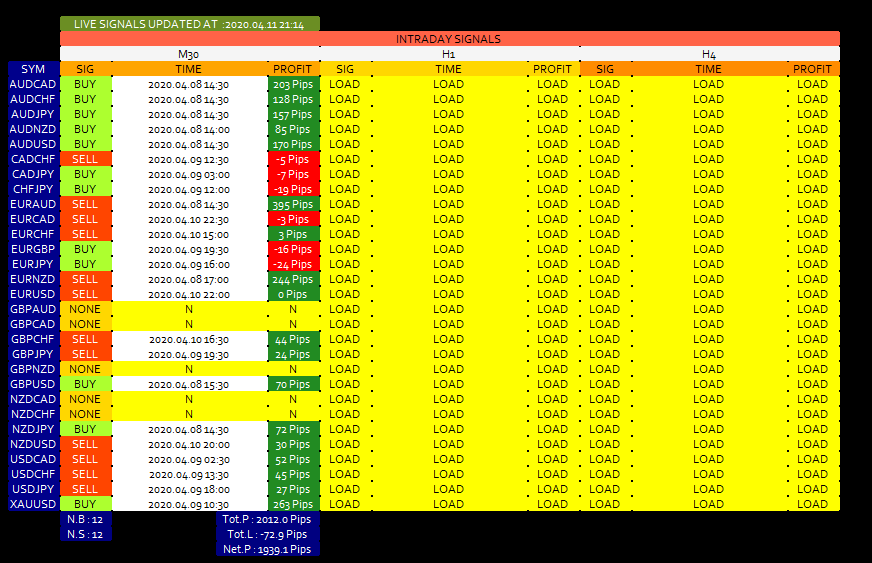
Step 5 : It will take around 1 minute to calculate H1 signals and display all of them
Step 6 : It will take around 1 minute to calculate H4 signals and display all of them
Step 7 : It will keep updated all active signals profit/loss and monitoring the new signals with an average updating time of 3 minutes.
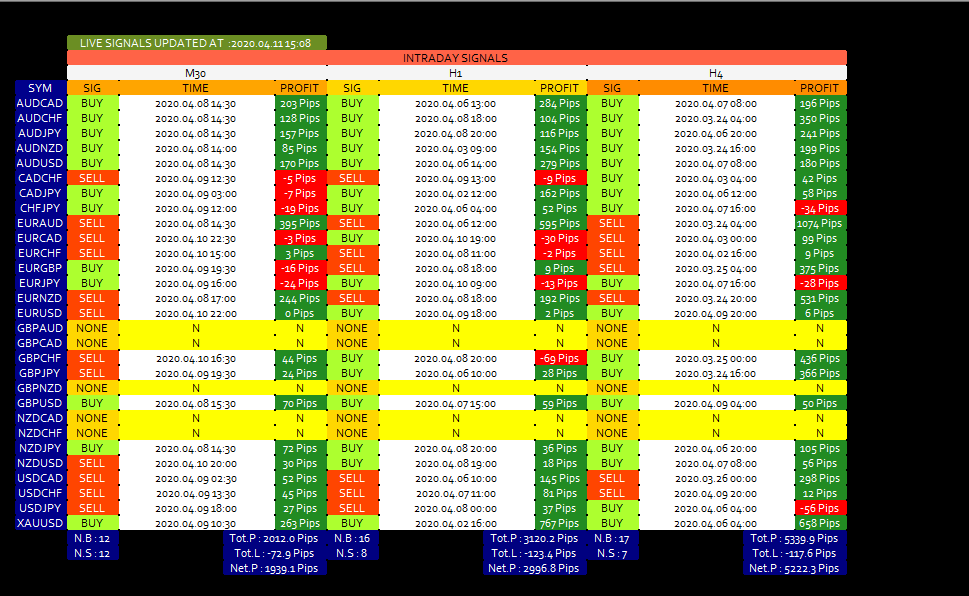
3. How to read Trend Line Map ?
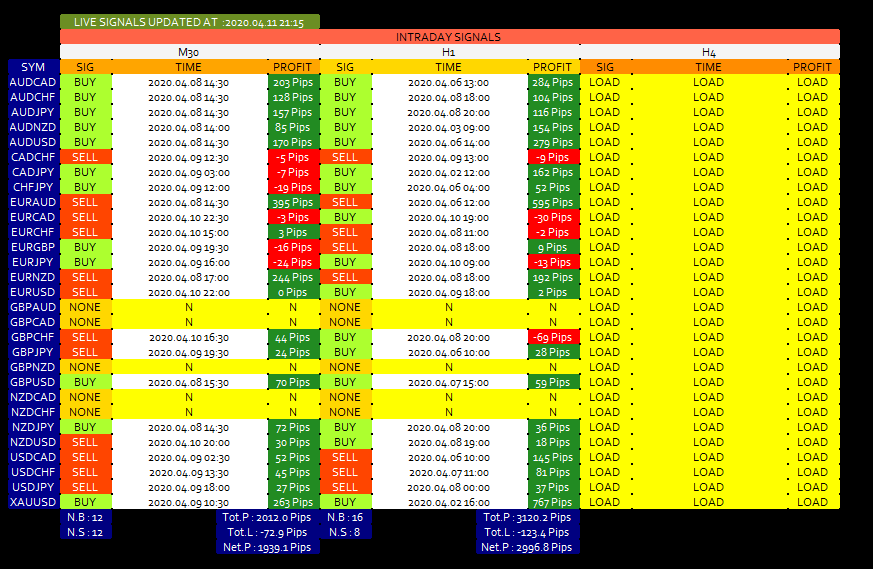
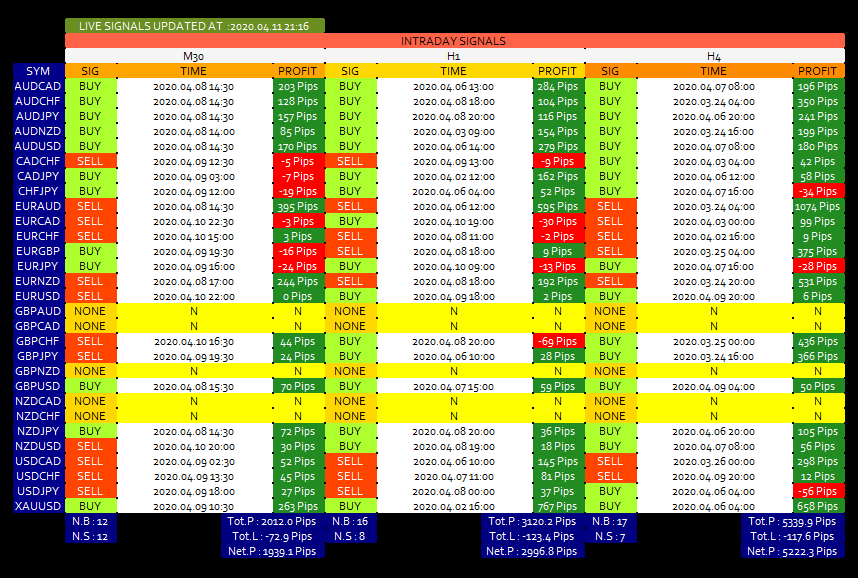
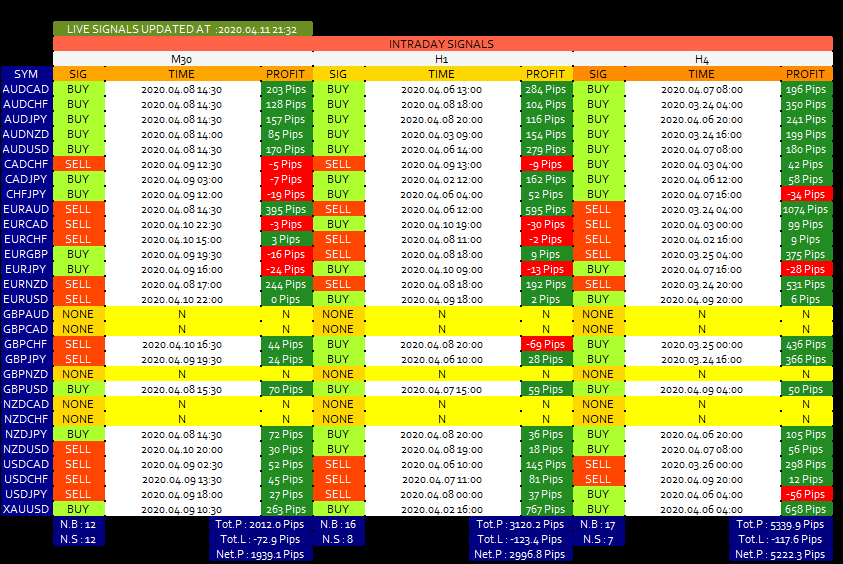
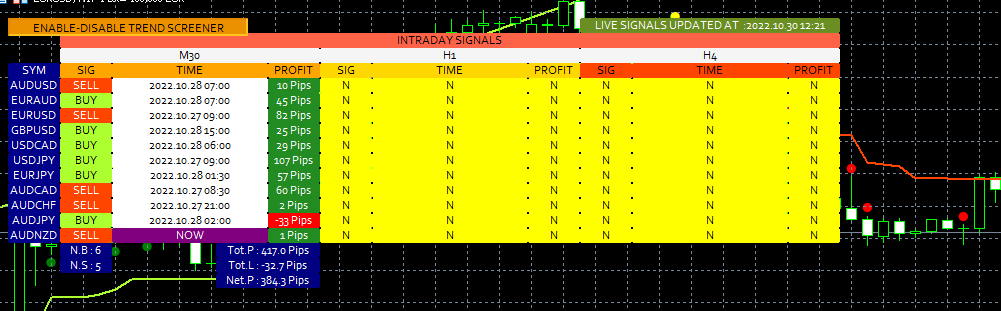
------------------ Intraday Signal ----------------
Column Description M30 this Column display M30 trend line Signal. H1 this Column display H1 trend line signals. H4 this Column display H4 trend line signals. SIG this Column display active signal type ( BUY or Sell ) TIME this Column display the starting time of the signal. PROFIT this Column display the live profit/loss in pips of the active signal. N.B this Column display the number of buy signals. N.S this Column display the number of sell signals. Tot.P this field display the the total profit of all active signals in Pips Tot.L this field display the the total loss of all active signals in Pips. Net. P this field display The net profit of all active signals in Pips.
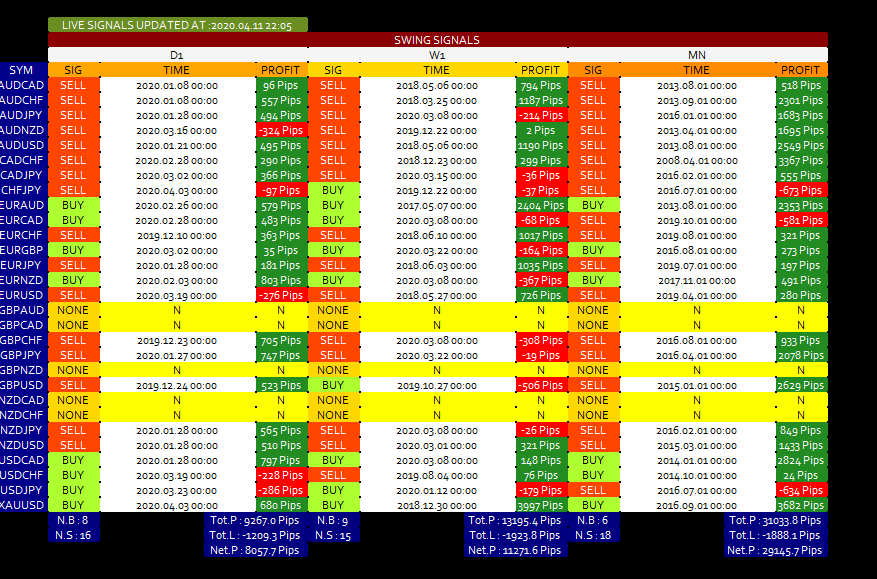
------------------ Intraday Signal ----------------
Column Description D1 this Column display daily trend line Signal. W1 this Column display weekly trend line signals. MN1 this Column display monthly trend line signals. SIG this Column display active signal type ( BUY or Sell ) TIME this Column display the starting time of the signal. PROFIT this Column display the live profit/loss in pips of the active signal. N.B this Column display the number of buy signals. N.S this Column display the number of sell signals. Tot.P this field display the the total profit of all active signals in Pips Tot.L this field display the the total loss of all active signals in Pips. Net. P this field display The net profit of all active signals in Pips.
4. How Trend Line Map indicator working with Trend Screener ?
Step 1 : Open Chart 1 and attach Trend Screener indicator in Chart 1.Step 2 : Open Chart 2 and attach Trend Map Line indicator in chart 2.
Buy Signal: TREND LINE BUY SIGNAL ( NOW )+ the TREND SUMMARY ( UP-TREND or STRONG-UP-TREND)
Sell Signal: TREND LINE SELL SIGNAL ( NOW ) + the TREND SUMMARY ( DOWN-TREND or STRONG-DOWN-TREND)

Feel free to post your comments below, thank you.
Author
SAYADI ACHREF , fintech software engineer and founder of Finansya.


