

Hello traders. I am a professional Supply and Demand trader. My trading is based on two Automated Indicators:
1. MTF SUPPLY DEMAND ZONES: https://www.mql5.com/en/market/product/36409
2. AUTOMATED TRENDLINES: https://www.mql5.com/en/market/product/34252
First indicator help us to identify market turning points.
Second indicator help us to identify the trend of the market.
I am going to show you how to use Automated Indicators to spot High Probability Trading Setups.
There are two setups that i use in my trading:
1ST SETUP
On the first setup we trade Supply And Demand Zones that were formed inside higher timeframe Supply And Demand Zones.
For this setup we use MTF SUPPLY DEMAND ZONES Indicator.
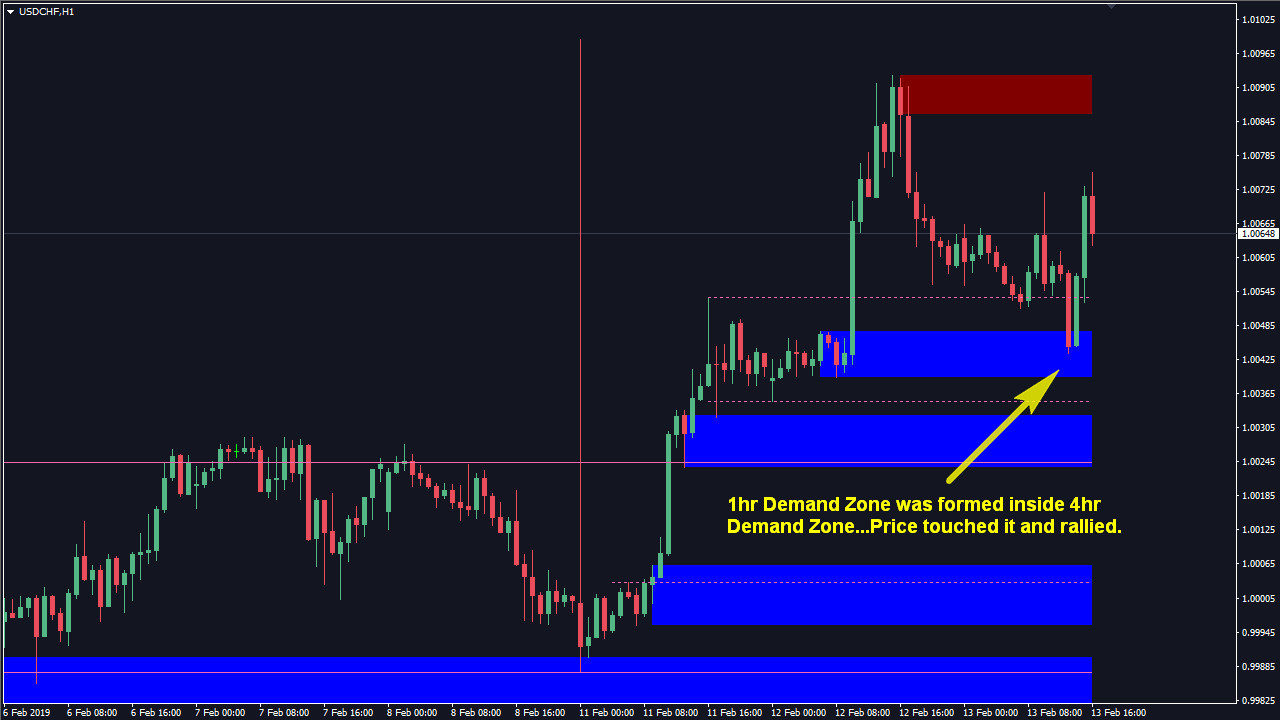
Long Setup:
We go long on Demand Zones that were formed inside higher timeframe Demand Zones.
See the example in the photo below.
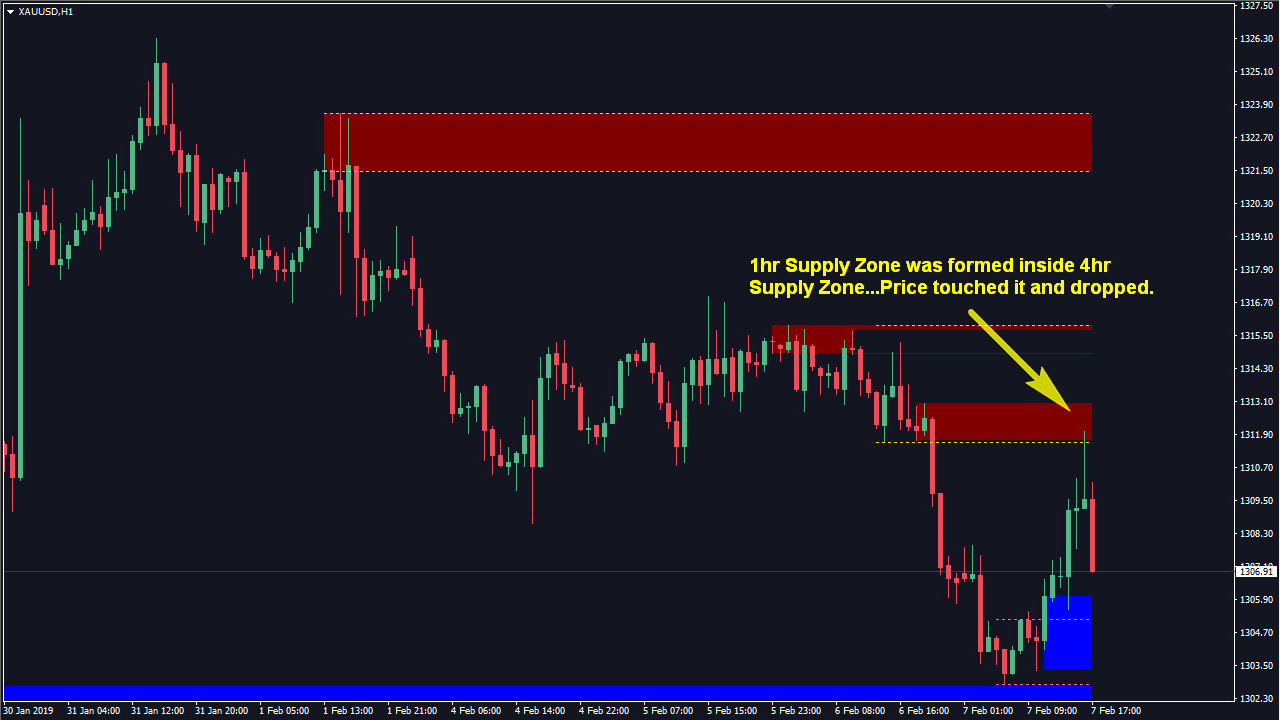
Short Setup:
We go short on Supply Zones that were formed inside higher timeframe Supply Zones.
See the example in the photo below.
YOU SHOULD AVOID TRADING 1ST SETUP:
- If you see more than 3 zones of current timeframe zone inside higher timeframe zone.
- Width of current timeframe zone is more than half of higher timeframe zone width.
(for example if width of the higher timeframe zone is 40 pips take the trade if width of the current timeframe zone is less than 20 pips)
2ND SETUP
On the second setup we trade Supply And Demand Zones that were formed in compliance with current trend.
For this setup we use MTF SUPPLY DEMAND ZONES Indicator and AUTOMATED TRENDLINES Indicator.
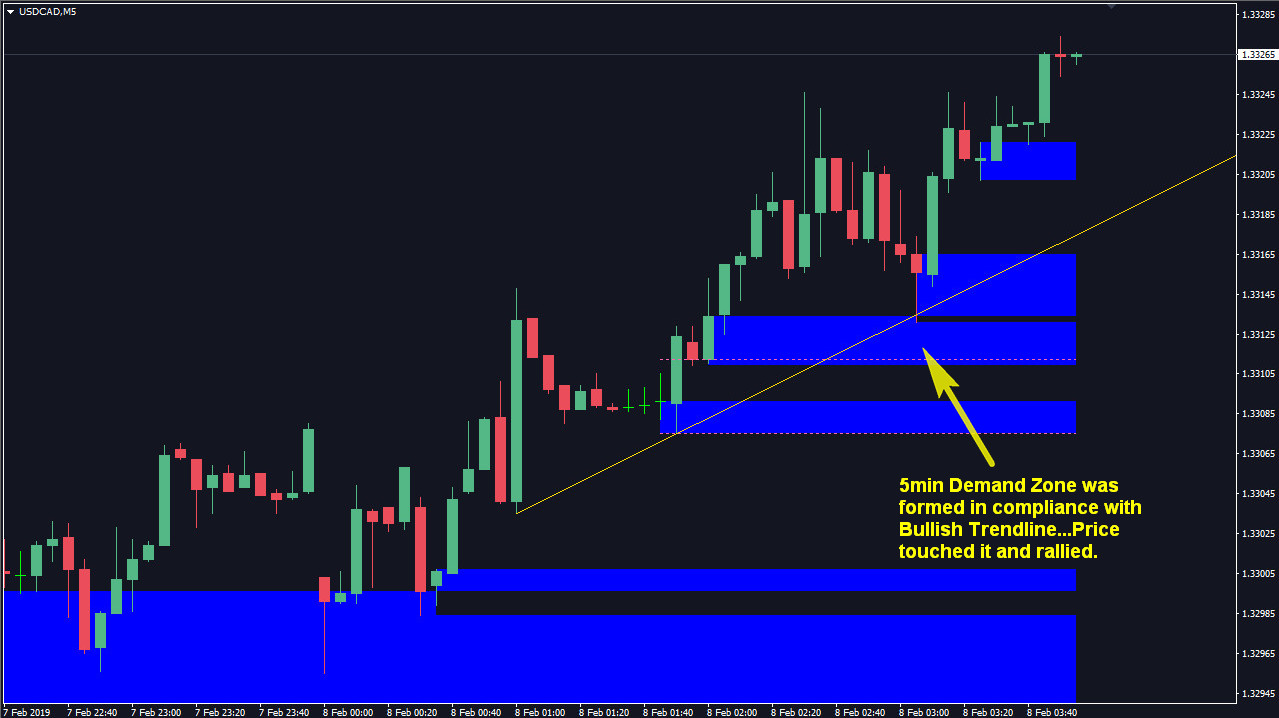
Long Setup:
If trend of the current timeframe is Bullish we go long on Demand Zones that were formed in compliance with Bullish Trendline.
See the example in the photo below.
Short Setup:
If trend of the current timeframe is Bearish we go short on Supply Zones that were formed in compliance with Bearish Trendline.
See the example in the photo below.

YOU SHOULD AVOID TRADING 2ND SETUP:
- If trend of the current timeframe is Bullish but price has touched higher timeframe Supply Zone.
- If trend of the current timeframe is Bearish but price has touched higher timeframe Demand Zone .
MAIN ADVANTAGES YOU GET USING THOSE AUTOMATED INDICATORS:
1.Both indicators are using a new algorithm very different from other similar indicators.
2.You can use both indicators on many charts simultaneously due to low cpu and ram usage.
3.Both indicators designed for professional manual traders after years of experimenting.
4.All zones and trendlines are created dynamically according to price action of the market.


