
The main purpose of this blog is to describe and explain the input parameters of my Divergence dashboard indicator (MT4 version / MT5 version).
Please also check out my other divergence and dashboard products for MT4:
Divergence indicator, Divergence scanner, Double divergence scanner, Divergence Expert Advisor (free), Trend dashboard, Trend reversal dashboard, Market analysis dashboard, Supply Demand Dashboard
For MT5:
Divergence indicator, Double divergence scanner, Divergence Expert Advisor (free), Trend dashboard, Market analysis dashboard, Supply Demand Dashboard
This is an out-of-the-box product which will normally not be modified based on request from a single customer. Please therefore first read this blog to the end in order to understand what it can and cannot do.
Input parameters
Parameters marked with an asterisk (*) in the beginning are only available in the MT5 version and parameters marked with two asterisks (**) in the beginning are only available in the MT4 version.- GENERAL SETTINGS
- Scanning interval in seconds: Default is 1. Can be set to a higher value in order to prevent possible performance issues on slower computers.
- Template name: The purpose of this parameter is to make it easier for quick decision if to take the trade or not. Typically you would then use your own custom chart template (.tpl) which for instance could contain my free divergence indicator ( MT4 version / MT5 version) and a support/resistance indicator. You will be able to download the instructions how to create a chart template in the end of this blog.
- Delay in seconds for applying chart template: This parameter can be set to a higher value in case your objects are now drawn on the chart in MT5.
- Trend filter to use: Drop down list from where you can select from Moving average, RSI or Bollinger bands.
- Enable sorting (ranking): Default is true. It will then sort the symbols according to the highest divergence trending at the top of the table. This is a simple sorting based on the color.
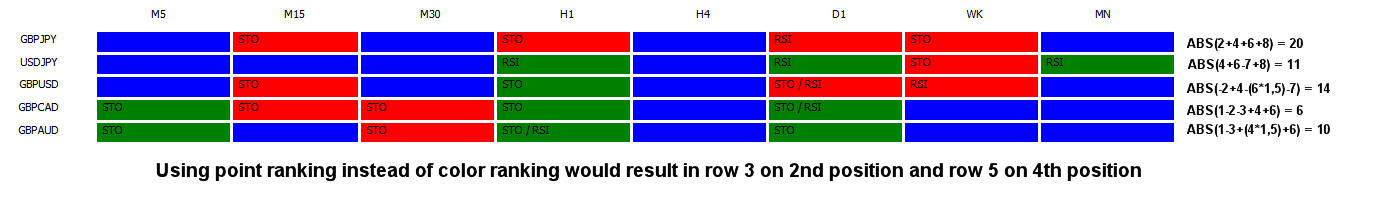
- Min. point value for alert (0=point ranking disabled): If set to 0 then you will be alerted in the classical way, hence color count. Please see the next parameter. If this is set to >0 the sorting will be based on a point system. The points will be calculated according to time frame and if double divergence or not. The value for the first time frame will be 1 and then accumulated by 1 for each visible time frame. If all time frames are visible the highest value will be 8 (9 for the MT 5 version). If the color is red (bearish divergence) the value will be negative. If there is a double divergence the value will be multiplied by 1.5. Please see an example calculation on the picture below (ABS converts a negative total sum to a positive value). If all time frames are enables then a total sum of 20 or higher must be considered as a high probability setup. Especially if the price is at, or close to, a supply/demand zone.
- Alert if signal on xx TF:s (0=all visible TF:s): By default 8 time frames are visible (M5, M15, M30, H1, H4, D1, WK1 and MN in the MT4 version (M1 can also be added) and a selection of max 9 time frames from any of the supported time frames in MT5 in the MT5 version). The alert will come when the color is the same on all time frames. This will be very rare. Setting this value to for instance 3 will alert you as soon as the color is the same on at least 3 time frames. If this value is set to 1 then you will get individual alerts for each single divergence.
- Enable global variables (for EA): Set to True to enable writing of global variables which can be used by an own developed Expert Advisor for automatical trading. This option will only work if the value in the 'Use point ranking' parameter has been set to True. The name of the global variables is 'DD,symbol,Bear or Bull'. For instance 'DD,EURUSD,Bear'. The value of the global variable is the point ranking.
- DIVERGENCE SETTINGS
- Use old logic (before version x.x): True or False. Set to true to detect divergences the way it was before version 2.0 (*2.3). The new logic will detect more divergences but it will also come with a performance cost. Something which will be more visible on slower computers. The new logic will allow divergences even if there are additional indicator extremums (top/bottoms) between the 2 already existing extremum points.
- First divergence oscillator: Please note that MACD signal will be shown as MACDS and MACD histogram as MACDH on the dashboard.
- Second divergence oscillator: Can be left to value NONE if you would like to scan only for a single oscillator/indicator.
- Scan for bullish divergences
- Scan for bearish divergences
- Scan for hidden divergences
- Scan for regular divergences
- Bars to check (divergence depth): Amount of bars (shifts) to check for a divergence. The higher the value the more computer resources will be used. Due to performance reasons I don't recommed a higher value than 100.
- Divergence candle shift: Set to 2 (default value ) or higher for a stronger confirmation of the possible reversal/trend continuation (confirmed divergence). By having it set to 1 you will catch the possible movement earlier (unconfirmed/pending divergence). On the other hand, the signal is less reliable. You can also set it to 0 for catching "early" divergences. This means that the alert will come directly upon candle open instead of waiting for the slope in the indicator to change direction (candle shift 1 or 2), which means that the price must show at least some sign of reversal. Please be aware though that this will lead to more false signals.
- Divergence on candle shifts <= shift above: By setting this to true the indicator will scan for confirmed as will as pending divergences in case you have set the value to 2 or higher in the parameter above.
- MACD AND OsMA SETTINGS
- Fast EMA
- Slow EMA
- Signal SMA
- STOCHASTICS SETTINGS
- K
- D
- Slowing
- CCI, RSI, ATR, **MFI, MOMENTUM SETTINGS
- RSI period
- CCI period
- ATR period
- ** MFI period
- Momentum period
- ADX *AND OBV/MFI SETTINGS
- ADX period
- ADX line mode
- * MFI period
- * OBV/MFI volume type for calculation: List box from where you can select from Tick volume or Real volume.
- SYMBOLS AND TIME FRAMES
- Symbols to scan: Here you will put all symbols you would like to monitor. Every symbol must be entered in the exact way as it is visible in the Market Watch window and separated with a comma, without spaces. By design in Metatrader 4 the amount of character in a text (string) parameter is limited to 255. You can put more characters in the Symbols parameter but when reading the value, Metatrader cuts at 255. 255 characters will allow for 36 symbols and 35 commas (,) if the symbol length is 6 characters. If you need more symbols you can always drag the indicator with the remaining symbols to another chart. To come around this limitation you can set the value in the 'Use symbols from Market Watch window instead' parameter below to true. By doing this the indicator will use the symbols visible in your Market Watch window instead. Please note though that depending on your screen size/resolution, having more then for instance 40 symbols might make the text of the symbols very small.
- Additional symbols to scan
- Use symbols from Market Watch window instead: With this option set to true all visible symbols in your Market Watch window will be scanned instead of the symbols above. Due to performace reasons It is not recommended to use more than 40 symbols. It could work with more symbols without issues on computers with a lot of RAM memory but more than 40 symbols will be unsupported from my side.
- Time frames: Set to true for each time frame you would like to monitor. Max 9 time frames can be selected in the MT5 version.
- MOVING AVERAGE TREND FILTER SETTINGS
- Period
- MA shift
- Method
- Price type
- TREND REVERSAL FILTER SETTINGS
- RSI overbought level
- RSI oversold level
- Bollinger shift: For Bollinger is valid that the high price of the divergence candle must be above the upper band for a bearish divergence and low price below the lower band for a bullish divergence.
- Bollinger deviation
- Trend period
- Trend price type
- ALERTS (set to true to allow for alerts to be sent)
- Enable alerts: Set to true to allow for alerts to be sent.
- Alert interval (minutes): If you set this to 10, you will receive an initial alert when a pair is in alignment and then again every 10 minutes as long as the pair remains in alignment.
- Disable repeated alerts
- Custom alert text: If you write something here then the alert will have to following format: "Divergence dashboard: [symbol] Bullish or Bearish - [your customized text]"
- On-screen (pop-up) alert
- Custom sound alert (if true then no pop-up alert)
- Custom sound file
- Mail alert
- Push alert
- COLORS AND TEXT
- Bull color: Color for filling the bullish rectangles.
- Bear color: Color for filling the bearish rectangles.
- Neutral color: Color in the "no signal" rectangles.
- Text color (None=automated): automated = black text for chart with white background and white text for chart with black background.
- Border color (automated if set to None above)
- Font size: Used for the symbol and time frame texts. Default is 8.
- Score offset: Default is 800 but can be adjusted to another value if the score is overlapping into the last time frame column or if the score is to far away.
- Symbol name offset


