EURUSD Technical Analysis 2016, 21.08 - 28.08: Fibo resistance with ascending triangle to be broken for bullish
21 August 2016, 20:18

10
453
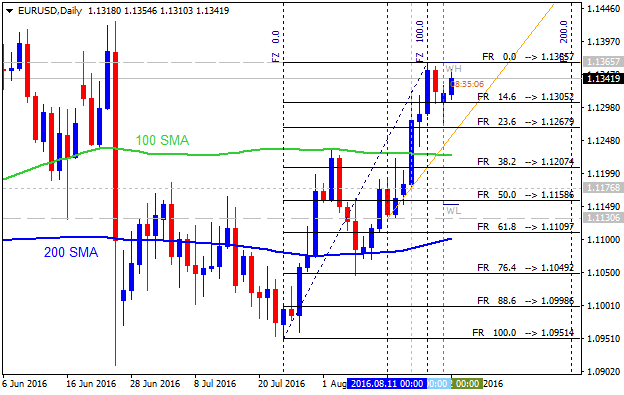
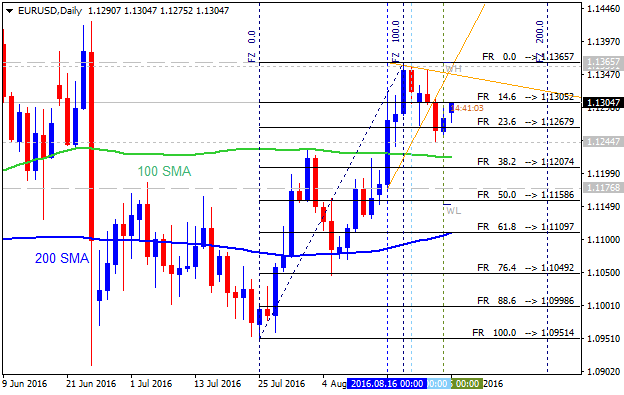
Daily price broke 100 SMA/200 SMA ranging reversal area for the primary bullish market condition:
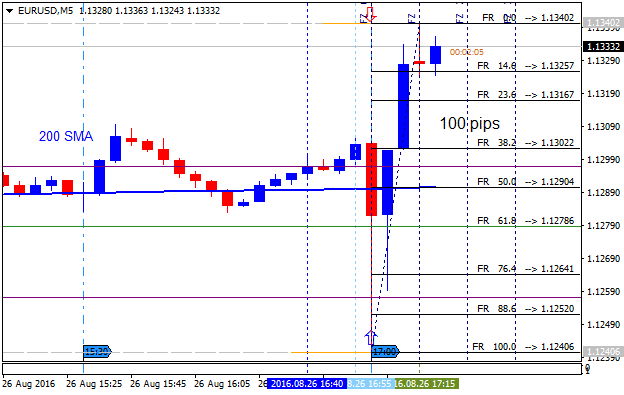
- The price is on testing with Fibo resistance level at 1.1366 to above for the bullish trend to be continuing.
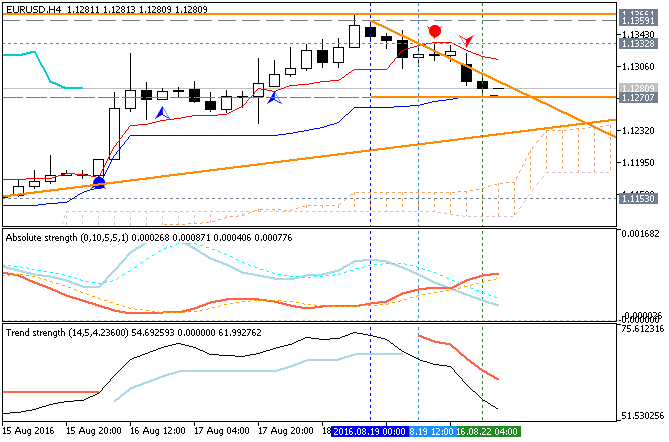
- RSI indicator is estimating the bullish ranging to be started.
- Ascending triangle pattern was formed by the price to be crossed from below for the bullish condition to be resumed.
If D1 price breaks Fibo support level at 1.1084 from above to below so the reversal of the price movement from the primary bullish to the primary bearish market condition will be started.
If not so the price will be bullish ranging within the levels.

- Recommendation for long: watch close D1 price to break 1.1366 for possible buy trade
- Recommendation
to go short: watch D1 price to break 1.1084 support level for possible sell trade
- Trading Summary: ranging
| Resistance | Support |
|---|---|
| 1.1366 | 1.1084 |
| N/A | 1.0911 |
SUMMARY : bullish