AUDUSD Technical Analysis 2015, 13.12 - 20.12: correction for the possible bearish reversal
13 December 2015, 21:11

3
182
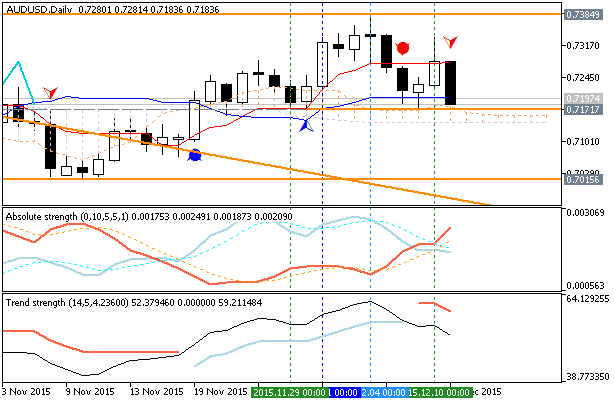
Daily price finished the week with good breakdown: the price broke key support levels for the correction and stopped near & above Ichimoku cloud, 'reversal' Senkou Span line and 0.7171 support level on the border between the primary bullish and the primary bearish on the chart within the following key s/r levels:
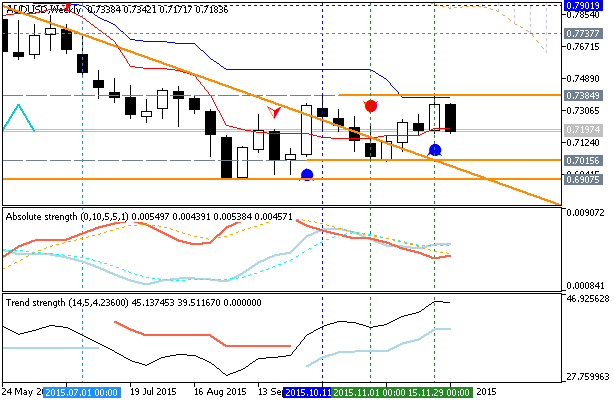
- 0.7384 key resistance level located far above Ichimoku cloud in the primary bullish area of the chart, and
- 0.7015 key support level located far below Ichimoku cloud in the primary bearish area.
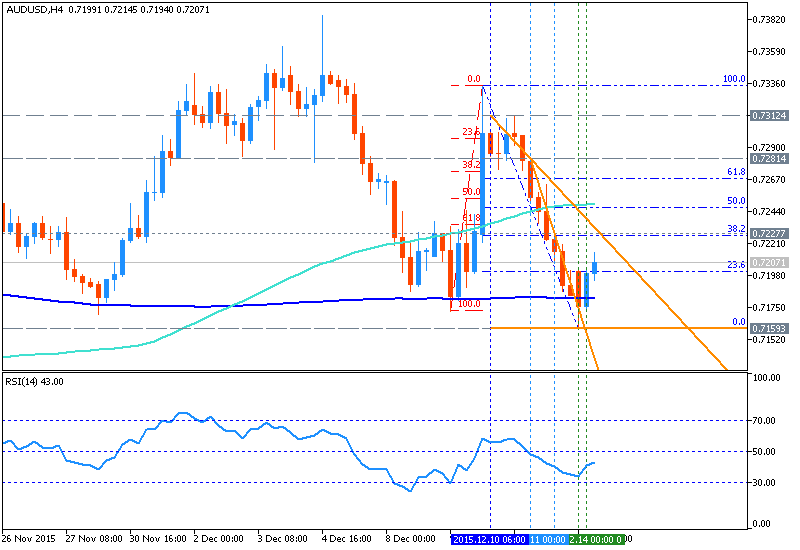
If D1 price will break 0.7171
support level on close bar so the reversal of the price movement from the primary bullish to the primary bearish market condition will be started with the secondary ranging.
If D1 price will break 0.7384
resistance level on close bar so the bullish trend will be continuing without ranging.
If not so the price will be on ranging within the levels.
- Recommendation for long: watch close D1 price to break 0.7384 for possible buy trade
- Recommendation
to go short: watch D1 price to break 0.7171 support level for possible sell trade
- Trading Summary: correction to bearish reversal
| Resistance | Support |
|---|---|
| 0.7384 | 0.7171 |
| N/A | 0.7015 |

SUMMARY : breakdown