
USDCAD Intra-Day Technical Analysis - reversed to the bearish; waiting for direction to break the levels
9 September 2015, 07:12

1
867
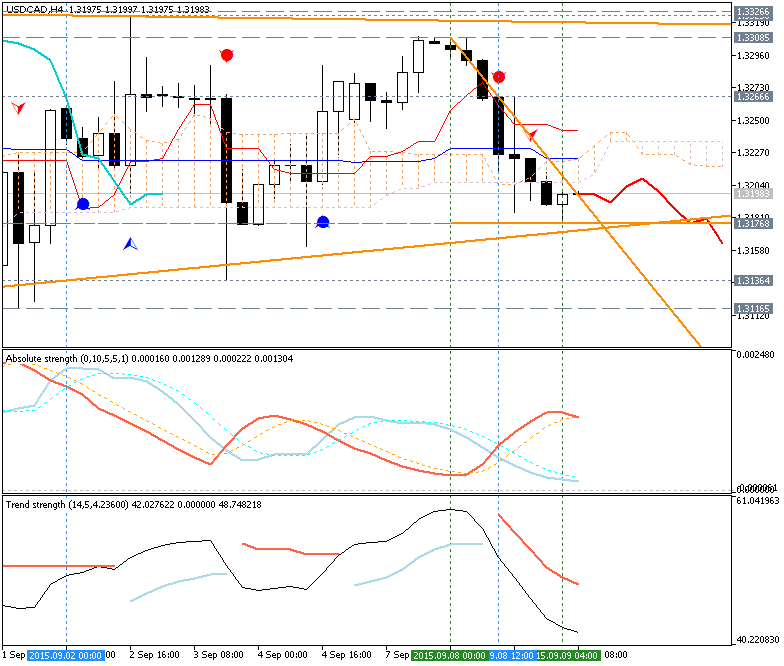
H4 price is on breakdown trying to cross 1.3176 support level from above to below for the breakdown to be continuing.
- The price broke Ichimoku cloud and reversed from the primary bullish to the primary bearish market condition on H4 timeframe.
- Descending triangle pattern was formed by the price with 1.3176 level to be broken for the bearish trend to be continuing.
- Chinkou Span line crossed the price from above to below for good breakdown to be continuing.
- The nearest key support levels are 1.3176 and 1.3116 located below Ichimoku cloud in the bearish area of the chart.
- The nearest key resistance levels are 1.3308 and 1.3326 located on above Ichimoku cloud in the bullish area of the chart.
| Resistance | Support |
|---|---|
| 1.3308 | 1.3176 |
| 1.3326 | 1.3116 |
If
H4 price will break 1.3116 support level on close H4 bar so the primary bearish will be continuing.
If H4 price will break 1.3326 resistance level so we may see the reversal to the primary bullish
condition.
If not so the price will be ranging within the familiar levels waiting for direction.
- Recommendation for long: watch close H4 price to break 1.3326 for possible buy trade
- Recommendation
to go short: watch H4 price to break 1.3116 support level for possible sell trade
- Trading Summary: bearish
SUMMARY : bearish


