
Building A Candlestick Trend Constraint Model(Part 2): Merging Native Indicators
Contents
- Introduction
- Looking back at history
- Identifying some issues with the current system
- Versioning our next MQL5 program
- Exploring moving averages
- Incorporating moving averages into our program
- Exploring the RSI
- Implementing the RSI
- Comparing results
- Conclusion
Introduction
MetaTrader 5 includes several built-in indicators that provide traders with a significant analytical advantage in the market. This article will specifically discuss two of them: Moving Averages and Relative Strength Index. Moving Averages are commonly used to identify the direction of a trend and potential support and resistance levels. They smooth out price data to create a single flowing line, making it easier to spot trends. On the other hand, the Relative Strength Index (RSI) is a momentum oscillator that measures the speed and change of price movements. Traders use the RSI to determine overbought and oversold conditions in the market, which can help them make more informed trading decisions. By combining these two indicators, traders can gain valuable insights into market trends and potential entry and exit points for their trades.
Here are some of the commonly used built-in indicators in MetaTrader 5:
- Moving Averages
- Bollinger Bands
- Relative Strength index
- MACD( Moving Average Convergence Divergence)
- Stochastic Oscillator
- Average True Range
- Ichimoku Kinko Hyo
- Fibonacci Retracement
By utilizing Moving Averages and Relative Strength Index in conjunction with other technical analysis tools, traders can develop a more comprehensive trading strategy. Continuously monitoring market conditions and adjusting their strategies accordingly, traders can stay ahead of the curve and capitalize on profitable opportunities. It is essential to stay disciplined and patient, as trading can be unpredictable and volatile. By incorporating Moving Averages and Relative Strength Index into their analysis, traders can enhance their decision-making process and increase their chances of success in the market. Remember, trading is a skill that takes time and practice to master, so it is important to stay committed to learning and improving your trading abilities.
Looking back at history
Let's examine the code below to enable us to evaluate the indicator's performance on historical data spanning at least a few thousand bars. Candlestick charts are crucial in identifying market trends by illustrating the relationship between opening, closing, high, and low prices for each period. Through analyzing past price movements, traders can determine trend direction and strength, aligning their trading strategies accordingly. Historical candlestick patterns can pinpoint key support and resistance levels, where prices often pause or reverse. By studying how prices have behaved at these levels previously, traders can anticipate future price movements and establish effective entry and exit points for their trades.Traders can utilize historical candlestick data to back-test their trading strategies and gauge their performance in different market scenarios. By testing trades using historical data, traders can assess the efficacy of their strategies and make necessary adjustments to enhance their trading results. In essence, delving into candlestick chart history is a vital component of technical analysis, offering traders valuable insights into market trends, patterns, and behaviors that can guide them in making informed and profitable trading choices.
In addition to analyzing historical candlestick patterns, traders can also use technical indicators to further enhance their understanding of market dynamics. These indicators can help identify potential entry and exit points, as well as provide signals for trend reversals or continuations. By combining the insights from candlestick charts with the signals generated by indicators, traders can develop a more comprehensive trading strategy that takes into account both price action and technical analysis. This holistic approach can improve decision-making and increase the likelihood of successful trades in the dynamic and ever-changing financial markets.
Let's examine this piece of that defines how far backward our indicator will visualize in candlestick chart history as part of our main code
#define PLOT_MAXIMUM_BARS_BACK 10000 //the integer value can be made higher expanding the gap you can visualize in history
#define OMIT_OLDEST_BARS 50
Identifying some issues with the current system
At this stage we are examining the signals provided on the chart by the Trend Constraint Indicator. While the constraint successfully filtered out negative signals, we still face issues with off-trend signals at a very small visual scale. It is important to eliminate these signals and focus on genuine trend signals. This highlights the necessity of utilizing built-in tools like the moving average and RSI through MQL5. In the following sections, we will delve into these tools further.
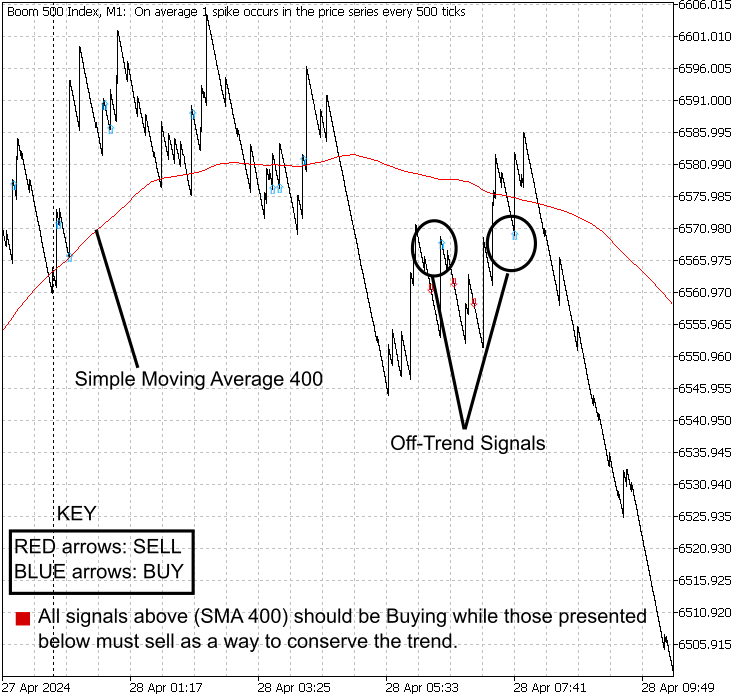
Fig 1: Trend Constraint v1.00, Boom 500 index
In the upcoming sections, we will explore how the moving average and RSI can help enhance our trend analysis and provide more accurate signals for decision-making. By incorporating these tools into our analysis, we aim to improve the overall effectiveness of our trading strategy and achieve better results in the market. Let's dive deeper into the functionalities and benefits of these tools to optimize our trading approach.
Versioning our next MQL5 program
Once our MQL5 journey begins each completed stage marks a version. As we continue adding features to our program we need to be versioned to a new level thus upgrading. Let's see how we do it at the beginning of our code. Below is our first version of the Trend Constraint in code.
///Indicator Name: Trend Constraint
#property copyright "Clemence Benjamin"
#property link      "https://mql5.com"
#property version   "1.00"
#property description "A model that seek to produce sell signal when D1 candle is Bearish only and  buy signal when it is Bullish"
To upgrade our version, we simply need to change the digits under the version property in our code. For instance, in this article, our next Trend Constraint version will be 1.01. Below is the updated code snippet showcasing how it will appear in the main code later in the article.
///Indicator Name: Trend Constraint
#property copyright "Clemence Benjamin"
#property link      "https://mql5.com"
#property version   "1.01"
#property description "A model that seek to produce sell signal when D1 candle is Bearish only and  buy signal when it is Bullish"
Well done! This is how we upgrade our MQL5 program. Next, we will advance it to versions 1.02, 1.03, 1.04, and so on.
Exploring the Moving Averages
MAs are crucial in illustrating market trends, comprising slow and fast Moving Averages. The crossover of these two can indicate either a trend continuation or a reversal. In this article, I employed a smoothed moving average with a period of 7 in comparison to a significantly slower simple moving average with a period of 400 to eliminate certain off-trend signals. This approach allowed for a more accurate representation of the underlying market trend, filtering out short-term fluctuations and noise. By using a combination of a fast and slow Moving Averages, I was able to identify significant trend changes while minimizing false signals. This method proved to be effective in capturing the broader market movements and providing valuable insights for making informed trading decisions.
The moving average is a widely used technical analysis tool that smooths out price data by creating a constantly updated average price. It helps traders identify trends and potential reversal points. The concept of the moving average was developed to reduce the impact of short-term fluctuations and highlight longer-term trends in price movement.
Using moving averages in financial analysis can be traced back to early technical analysts like Richard Donchian and George Marechal in the mid-20th century.
The formula for calculating a simple moving average (SMA) is straightforward:
SMA = (P1 + P2 ... + Pn)/n
where:
- SMA = Simple Moving Average
- P1,P2,...,Pn = Price for the specified periods (e.g., closing prices)
- n = Number of periods (e.g., days) over which to calculate the averages.
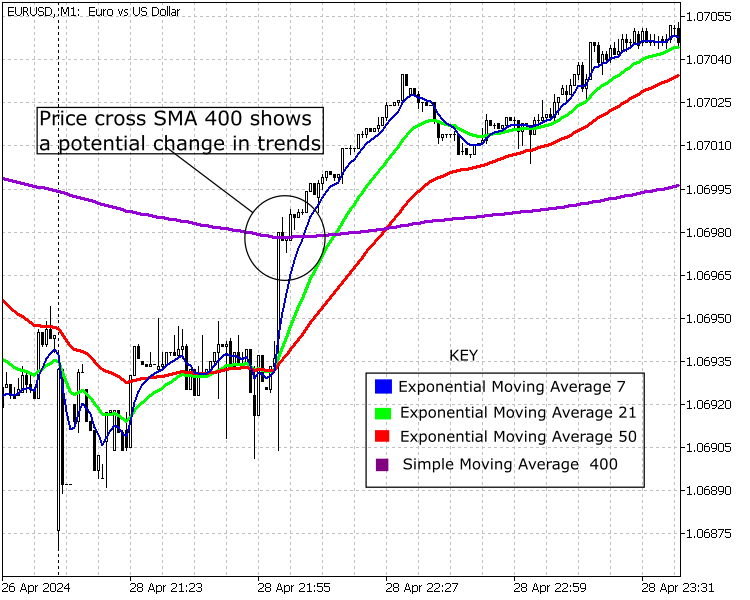
Fig 2: Moving Averages, EURUSD
Incorporating Moving Averages to the program
The slowest moving average can be significant in identifying trend changes. This is evident in how the price interacts with slow Moving Averages. Typically, the price tests the slow moving average multiple times before continuing or changing the trend. The slow moving average closely follows the current price movement. In this manner, the slow moving average acts as a robust support or resistance level, reflecting the underlying trend's strength. Traders often use this indicator to confirm trend reversals or continuations, as its lagging nature provides a reliable gauge of market sentiment. By observing the relationship between the price and the slow moving average, investors can gain valuable insights into the market dynamics and make informed trading decisions.
In addition, the slow moving average's ability to smooth out price fluctuations can offer traders a clearer picture of the market's overall direction. By focusing on the convergence or divergence between the price and the slow moving average, investors can anticipate potential shifts in momentum. This indicator's reliability in capturing long-term trends makes it a valuable tool for traders looking to ride out substantial price movements while filtering out short-term noise. Understanding the nuances of the slow moving average can enhance a trader's ability to navigate the complexities of the financial markets with greater precision and confidence.
In the preceding article, we developed a D1 Trend Constraint Indicator with 2 buffers for buying and selling. While it appeared satisfactory initially, our aim now is to enhance its effectiveness further. Similar to our previous work, the code consists of 2 buffers. Our objective is to restrict the output to slow moving averages to filter out false signals. Slow moving averages play a significant role in determining trends. The restriction dictates buying solely when the price is higher than SMA 400 and selling exclusively when it is lower.
- Smoothed Simple Moving Average(SSMA) 7 to represent price
- Simple Moving Average 400 to represent trend enforcement
- MQL5 code for the condition.
///Indicator Name: Trend Constraint
#property copyright "Clemence Benjamin"
#property link      "https://mql5.com"
#property version   "1.00"
#property description "A model that seek to produce sell signal when D1 candle is Bearish only and  buy signal when it is Bullish"

//--- indicator settings
#property indicator_chart_window
#property indicator_buffers 2
#property indicator_plots 2

#property indicator_type1 DRAW_ARROW
#property indicator_width1 5
#property indicator_color1 0xD42A00
#property indicator_label1 "Buy"

#property indicator_type2 DRAW_ARROW
#property indicator_width2 5
#property indicator_color2 0x0000D4
#property indicator_label2 "Sell"

#define PLOT_MAXIMUM_BARS_BACK 5000
#define OMIT_OLDEST_BARS 50

//--- indicator buffers
double Buffer1[];
double Buffer2[];

double myPoint; //initialized in OnInit
int MA_handle;
double MA[];
int MA_handle2;
double MA2[];
double Open[];
double Close[];
int MA_handle3;
double MA3[];
int MA_handle4;
double MA4[];
double Low[];
double High[];

void myAlert(string type, string message)
  {
   if(type == "print")
      Print(message);
   else if(type == "error")
     {
      Print(type+" | Trend Constraint @ "+Symbol()+","+IntegerToString(Period())+" | "+message);
     }
   else if(type == "order")
     {
     }
   else if(type == "modify")
     {
     }
  }

//+------------------------------------------------------------------+
//| Custom indicator initialization function                         |
//+------------------------------------------------------------------+
int OnInit()
  {
   SetIndexBuffer(0, Buffer1);
   PlotIndexSetDouble(0, PLOT_EMPTY_VALUE, EMPTY_VALUE);
   PlotIndexSetInteger(0, PLOT_DRAW_BEGIN, MathMax(Bars(Symbol(), PERIOD_CURRENT)-PLOT_MAXIMUM_BARS_BACK+1, OMIT_OLDEST_BARS+1));
   PlotIndexSetInteger(0, PLOT_ARROW, 241);
   SetIndexBuffer(1, Buffer2);
   PlotIndexSetDouble(1, PLOT_EMPTY_VALUE, EMPTY_VALUE);
   PlotIndexSetInteger(1, PLOT_DRAW_BEGIN, MathMax(Bars(Symbol(), PERIOD_CURRENT)-PLOT_MAXIMUM_BARS_BACK+1, OMIT_OLDEST_BARS+1));
   PlotIndexSetInteger(1, PLOT_ARROW, 242);
   //initialize myPoint
   myPoint = Point();
   if(Digits() == 5 || Digits() == 3)
     {
      myPoint *= 10;
     }
   MA_handle = iMA(NULL, PERIOD_CURRENT, 7, 0, MODE_EMA, PRICE_CLOSE);
   if(MA_handle < 0)
     {
      Print("The creation of iMA has failed: MA_handle=", INVALID_HANDLE);
      Print("Runtime error = ", GetLastError());
      return(INIT_FAILED);
     }

   MA_handle2 = iMA(NULL, PERIOD_CURRENT, 21, 0, MODE_EMA, PRICE_CLOSE);
   if(MA_handle2 < 0)
     {
      Print("The creation of iMA has failed: MA_handle2=", INVALID_HANDLE);
      Print("Runtime error = ", GetLastError());
      return(INIT_FAILED);
     }

   MA_handle3 = iMA(NULL, PERIOD_CURRENT, 7, 0, MODE_SMMA, PRICE_CLOSE);
   if(MA_handle3 < 0)
     {
      Print("The creation of iMA has failed: MA_handle3=", INVALID_HANDLE);
      Print("Runtime error = ", GetLastError());
      return(INIT_FAILED);
     }

   MA_handle4 = iMA(NULL, PERIOD_CURRENT, 400, 0, MODE_SMA, PRICE_CLOSE);
   if(MA_handle4 < 0)
     {
      Print("The creation of iMA has failed: MA_handle4=", INVALID_HANDLE);
      Print("Runtime error = ", GetLastError());
      return(INIT_FAILED);
     }

   return(INIT_SUCCEEDED);
  }

//+------------------------------------------------------------------+
//| Custom indicator iteration function                              |
//+------------------------------------------------------------------+
int OnCalculate(const int rates_total,
                const int prev_calculated,
                const datetime& time[],
                const double& open[],
                const double& high[],
                const double& low[],
                const double& close[],
                const long& tick_volume[],
                const long& volume[],
                const int& spread[])
  {
   int limit = rates_total - prev_calculated;
   //--- counting from 0 to rates_total
   ArraySetAsSeries(Buffer1, true);
   ArraySetAsSeries(Buffer2, true);
   //--- initial zero
   if(prev_calculated < 1)
     {
      ArrayInitialize(Buffer1, EMPTY_VALUE);
      ArrayInitialize(Buffer2, EMPTY_VALUE);
     }
   else
      limit++;

   datetime TimeShift[];
   if(CopyTime(Symbol(), PERIOD_CURRENT, 0, rates_total, TimeShift) <= 0) return(rates_total);
   ArraySetAsSeries(TimeShift, true);
   int barshift_M1[];
   ArrayResize(barshift_M1, rates_total);
   int barshift_D1[];
   ArrayResize(barshift_D1, rates_total);
   for(int i = 0; i < rates_total; i++)
     {
      barshift_M1[i] = iBarShift(Symbol(), PERIOD_M1, TimeShift[i]);
      barshift_D1[i] = iBarShift(Symbol(), PERIOD_D1, TimeShift[i]);
   }
   if(BarsCalculated(MA_handle) <= 0)
      return(0);
   if(CopyBuffer(MA_handle, 0, 0, rates_total, MA) <= 0) return(rates_total);
   ArraySetAsSeries(MA, true);
   if(BarsCalculated(MA_handle2) <= 0)
      return(0);
   if(CopyBuffer(MA_handle2, 0, 0, rates_total, MA2) <= 0) return(rates_total);
   ArraySetAsSeries(MA2, true);
   if(CopyOpen(Symbol(), PERIOD_M1, 0, rates_total, Open) <= 0) return(rates_total);
   ArraySetAsSeries(Open, true);
   if(CopyClose(Symbol(), PERIOD_D1, 0, rates_total, Close) <= 0) return(rates_total);
   ArraySetAsSeries(Close, true);
   if(BarsCalculated(MA_handle3) <= 0)
      return(0);
   if(CopyBuffer(MA_handle3, 0, 0, rates_total, MA3) <= 0) return(rates_total);
   ArraySetAsSeries(MA3, true);
   if(BarsCalculated(MA_handle4) <= 0)
      return(0);
   if(CopyBuffer(MA_handle4, 0, 0, rates_total, MA4) <= 0) return(rates_total);
   ArraySetAsSeries(MA4, true);
   if(CopyLow(Symbol(), PERIOD_CURRENT, 0, rates_total, Low) <= 0) return(rates_total);
   ArraySetAsSeries(Low, true);
   if(CopyHigh(Symbol(), PERIOD_CURRENT, 0, rates_total, High) <= 0) return(rates_total);
   ArraySetAsSeries(High, true);
   //--- main loop
   for(int i = limit-1; i >= 0; i--)
     {
      if (i >= MathMin(PLOT_MAXIMUM_BARS_BACK-1, rates_total-1-OMIT_OLDEST_BARS)) continue; //omit some old rates to prevent "Array out of range" or slow calculation

      if(barshift_M1[i] < 0 || barshift_M1[i] >= rates_total) continue;
      if(barshift_D1[i] < 0 || barshift_D1[i] >= rates_total) continue;

      //Indicator Buffer 1
      if(MA[i] > MA2[i]
      && MA[i+1] < MA2[i+1] //Moving Average crosses above Moving Average
      && Open[barshift_M1[i]] >= Close[1+barshift_D1[i]] //Candlestick Open >= Candlestick Close
      && MA3[i] > MA4[i] //Moving Average > Moving Average
      )
        {
         Buffer1[i] = Low[i]; //Set indicator value at Candlestick Low
        }
      else
        {
         Buffer1[i] = EMPTY_VALUE;
        }
      //Indicator Buffer 2
      if(MA[i] < MA2[i]
      && MA[i+1] > MA2[i+1] //Moving Average crosses below Moving Average
      && Open[barshift_M1[i]] <= Close[1+barshift_D1[i]] //Candlestick Open <= Candlestick Close
      && MA3[i] < MA4[i] //Moving Average < Moving Average
      )
        {
         Buffer2[i] = High[i]; //Set indicator value at Candlestick High
        }
      else
        {
         Buffer2[i] = EMPTY_VALUE;
        }
     }
   return(rates_total);
  }
//Thank you for following along this is ready to  compile
Exploring the RSI Oscillator
The RSI helps identify the extreme zones of the market, including overbought and oversold areas This can be useful for traders looking to determine potential reversal points or trend continuation opportunities. By using the RSI in conjunction with other technical indicators and analysis methods, traders can make more informed decisions when entering or exiting trades. Additionally, the RSI can also be used to confirm the strength of a trend or to spot divergence between price and momentum, which may indicate a potential change in direction. Traders should be cautious of relying solely on the RSI and should always consider other factors such as market conditions, news events, and overall market sentiment before making trading decisions. It is important to remember that no single indicator is foolproof, and a combination of tools and analysis is often necessary for successful trading strategies.
The formula for RSI below is attributed to J. Welles Wilder Jr., who introduced the concept in 1978.
RSI = 100 - (100/(1+RS))
where:
- RS = Average Gain / Average Loss
- Average Gain= Sum of gains over the specified period / Number of periods
- Average Loss= Sum of losses over the specified period / Number of periods
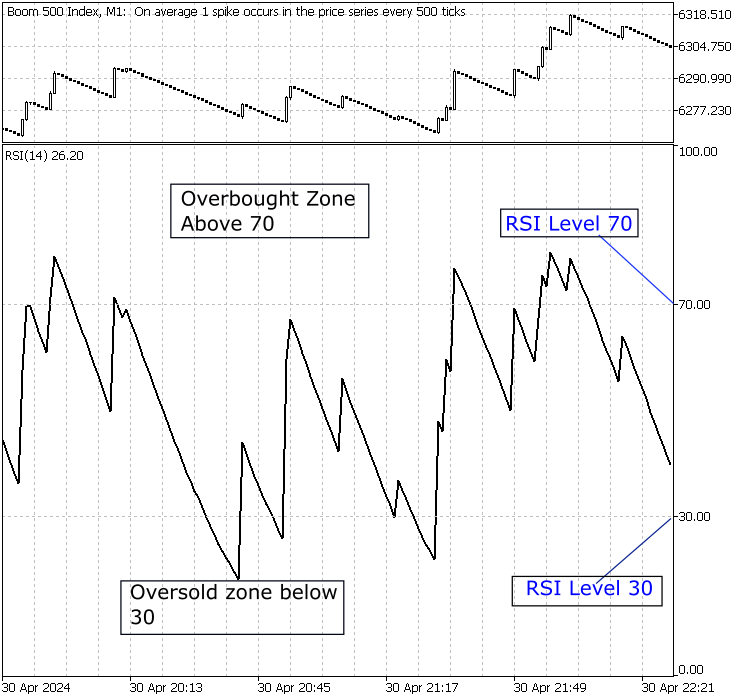
Fig 3: RSI levels, Boom 500 index
Implementation of the RSI
Identifying RSI levels in code and aligning them with main trends can be very useful. In this section, we incorporate RSI conditions into our MQL5 indicator program. Incorporating RSI conditions into our MQL5 indicator program allows us to better analyze market trends and make more informed trading decisions. By aligning RSI levels with main trends, we can identify potential entry and exit points with greater accuracy, increasing the effectiveness of our trading strategy. We used to rely on moving average crossovers as our entry condition. Now, we are removing the MA crossover and instead using RSI levels for entry, along with other recently incorporated conditions to create a new version, Trend Constrain V1.02.
At this stage, we need to incorporate inputs for RSI value to optimize for Overbought and Oversold zones. Check the code below.
input double Oversold = 30;
input double Overbought = 70;
//I have set the default standard values, but you can alter them to suit your strategy and instrument being traded.
Let's now implement these RSI conditions into our code to enhance the functionality of our indicator. Let's start by defining the RSI levels that we want to use in our indicator. We can set the overbought level to 70 and the oversold level to 30. This will help us identify potential reversal points in the market. Next, we will add the necessary logic to our code to check for these RSI conditions and generate signals accordingly. This will give us a more comprehensive view of market dynamics and help us make more informed trading decisions. Let's proceed with implementing these changes to our MQL5 indicator program.
///Indicator Name: Trend Constraint
#property copyright "Clemence Benjamin"
#property link      "https://mql5.com"
#property version   "1.02"
#property description "A model that seek to produce sell signal when D1 candle is Bearish only and  buy signal when it is Bullish"

///--- indicator settings
#property indicator_chart_window
#property indicator_buffers 2
#property indicator_plots 2

#property indicator_type1 DRAW_ARROW
#property indicator_width1 5
#property indicator_color1 0xFF3C00
#property indicator_label1 "Buy"

#property indicator_type2 DRAW_ARROW
#property indicator_width2 5
#property indicator_color2 0x0000FF
#property indicator_label2 "Sell"

#define PLOT_MAXIMUM_BARS_BACK 5000
#define OMIT_OLDEST_BARS 50

//--- indicator buffers
double Buffer1[];
double Buffer2[];

input double Oversold = 30;
input double Overbought = 70;
double myPoint; //initialized in OnInit
int RSI_handle;
double RSI[];
double Open[];
double Close[];
int MA_handle;
double MA[];
int MA_handle2;
double MA2[];
double Low[];
double High[];

void myAlert(string type, string message)
  {
   if(type == "print")
      Print(message);
   else if(type == "error")
     {
      Print(type+" | Trend Constraint V1.02 @ "+Symbol()+","+IntegerToString(Period())+" | "+message);
     }
   else if(type == "order")
     {
     }
   else if(type == "modify")
     {
     }
  }

//+------------------------------------------------------------------+
//| Custom indicator initialization function                         |
//+------------------------------------------------------------------+
int OnInit()
  {
   SetIndexBuffer(0, Buffer1);
   PlotIndexSetDouble(0, PLOT_EMPTY_VALUE, EMPTY_VALUE);
   PlotIndexSetInteger(0, PLOT_DRAW_BEGIN, MathMax(Bars(Symbol(), PERIOD_CURRENT)-PLOT_MAXIMUM_BARS_BACK+1, OMIT_OLDEST_BARS+1));
   PlotIndexSetInteger(0, PLOT_ARROW, 241);
   SetIndexBuffer(1, Buffer2);
   PlotIndexSetDouble(1, PLOT_EMPTY_VALUE, EMPTY_VALUE);
   PlotIndexSetInteger(1, PLOT_DRAW_BEGIN, MathMax(Bars(Symbol(), PERIOD_CURRENT)-PLOT_MAXIMUM_BARS_BACK+1, OMIT_OLDEST_BARS+1));
   PlotIndexSetInteger(1, PLOT_ARROW, 242);
   //initialize myPoint
   myPoint = Point();
   if(Digits() == 5 || Digits() == 3)
     {
      myPoint *= 10;
     }
   RSI_handle = iRSI(NULL, PERIOD_CURRENT, 14, PRICE_CLOSE);
   if(RSI_handle < 0)
     {
      Print("The creation of iRSI has failed: RSI_handle=", INVALID_HANDLE);
      Print("Runtime error = ", GetLastError());
      return(INIT_FAILED);
     }

   MA_handle = iMA(NULL, PERIOD_CURRENT, 7, 0, MODE_SMMA, PRICE_CLOSE);
   if(MA_handle < 0)
     {
      Print("The creation of iMA has failed: MA_handle=", INVALID_HANDLE);
      Print("Runtime error = ", GetLastError());
      return(INIT_FAILED);
     }

   MA_handle2 = iMA(NULL, PERIOD_CURRENT, 400, 0, MODE_SMA, PRICE_CLOSE);
   if(MA_handle2 < 0)
     {
      Print("The creation of iMA has failed: MA_handle2=", INVALID_HANDLE);
      Print("Runtime error = ", GetLastError());
      return(INIT_FAILED);
     }

   return(INIT_SUCCEEDED);
  }

//+------------------------------------------------------------------+
//| Custom indicator iteration function                              |
//+------------------------------------------------------------------+
int OnCalculate(const int rates_total,
                const int prev_calculated,
                const datetime& time[],
                const double& open[],
                const double& high[],
                const double& low[],
                const double& close[],
                const long& tick_volume[],
                const long& volume[],
                const int& spread[])
  {
   int limit = rates_total - prev_calculated;
   //--- counting from 0 to rates_total
   ArraySetAsSeries(Buffer1, true);
   ArraySetAsSeries(Buffer2, true);
   //--- initial zero
   if(prev_calculated < 1)
     {
      ArrayInitialize(Buffer1, EMPTY_VALUE);
      ArrayInitialize(Buffer2, EMPTY_VALUE);
     }
   else
      limit++;

   datetime TimeShift[];
   if(CopyTime(Symbol(), PERIOD_CURRENT, 0, rates_total, TimeShift) <= 0) return(rates_total);
   ArraySetAsSeries(TimeShift, true);
   int barshift_M1[];
   ArrayResize(barshift_M1, rates_total);
   int barshift_D1[];
   ArrayResize(barshift_D1, rates_total);
   for(int i = 0; i < rates_total; i++)
     {
      barshift_M1[i] = iBarShift(Symbol(), PERIOD_M1, TimeShift[i]);
      barshift_D1[i] = iBarShift(Symbol(), PERIOD_D1, TimeShift[i]);
   }
   if(BarsCalculated(RSI_handle) <= 0)
      return(0);
   if(CopyBuffer(RSI_handle, 0, 0, rates_total, RSI) <= 0) return(rates_total);
   ArraySetAsSeries(RSI, true);
   if(CopyOpen(Symbol(), PERIOD_M1, 0, rates_total, Open) <= 0) return(rates_total);
   ArraySetAsSeries(Open, true);
   if(CopyClose(Symbol(), PERIOD_D1, 0, rates_total, Close) <= 0) return(rates_total);
   ArraySetAsSeries(Close, true);
   if(BarsCalculated(MA_handle) <= 0)
      return(0);
   if(CopyBuffer(MA_handle, 0, 0, rates_total, MA) <= 0) return(rates_total);
   ArraySetAsSeries(MA, true);
   if(BarsCalculated(MA_handle2) <= 0)
      return(0);
   if(CopyBuffer(MA_handle2, 0, 0, rates_total, MA2) <= 0) return(rates_total);
   ArraySetAsSeries(MA2, true);
   if(CopyLow(Symbol(), PERIOD_CURRENT, 0, rates_total, Low) <= 0) return(rates_total);
   ArraySetAsSeries(Low, true);
   if(CopyHigh(Symbol(), PERIOD_CURRENT, 0, rates_total, High) <= 0) return(rates_total);
   ArraySetAsSeries(High, true);
   //--- main loop
   for(int i = limit-1; i >= 0; i--)
     {
      if (i >= MathMin(PLOT_MAXIMUM_BARS_BACK-1, rates_total-1-OMIT_OLDEST_BARS)) continue; //omit some old rates to prevent "Array out of range" or slow calculation

      if(barshift_M1[i] < 0 || barshift_M1[i] >= rates_total) continue;
      if(barshift_D1[i] < 0 || barshift_D1[i] >= rates_total) continue;

      //Indicator Buffer 1
      if(RSI[i] < Oversold
      && RSI[i+1] > Oversold //Relative Strength Index crosses below fixed value
      && Open[barshift_M1[i]] >= Close[1+barshift_D1[i]] //Candlestick Open >= Candlestick Close
      && MA[i] > MA2[i] //Moving Average > Moving Average
      )
        {
         Buffer1[i] = Low[i]; //Set indicator value at Candlestick Low
        }
      else
        {
         Buffer1[i] = EMPTY_VALUE;
        }
      //Indicator Buffer 2
      if(RSI[i] > Overbought
      && RSI[i+1] < Overbought //Relative Strength Index crosses above fixed value
      && Open[barshift_M1[i]] <= Close[1+barshift_D1[i]] //Candlestick Open <= Candlestick Close
      && MA[i] < MA2[i] //Moving Average < Moving Average
      )
        {
         Buffer2[i] = High[i]; //Set indicator value at Candlestick High
        }
      else
        {
         Buffer2[i] = EMPTY_VALUE;
        }
     }
   return(rates_total);
  }
// Thank you for following along we are here
Comparing results
After reviewing the previous article, we have made significant progress in creating a clear chart with the number of signals presented. The RSI and Moving averages have had a positive effect on our results, serving as visual indicators to monitor trend changes. Our Higher time frame candlestick trend constraint indicator has also shown improvement. In addition, the incorporation of the SMA 400 indicator has provided further insights into potential market reversals, enhancing our overall analysis accuracy. By combining these various signals, we are better equipped to make informed trading decisions and adapt to evolving market conditions. I am is excited about the progress we have made and remain committed to refining this strategy for even better outcomes in the future.
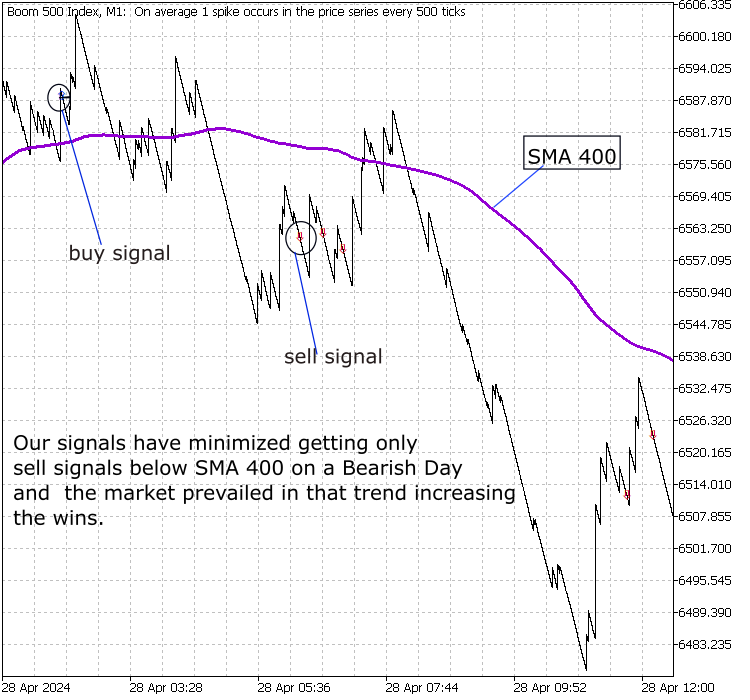
Fig 4: Trend Constraint v1.02, Boom 500 index
The image above can be reference back to the beginning of the article when we were looking at identifying some issues with the current system
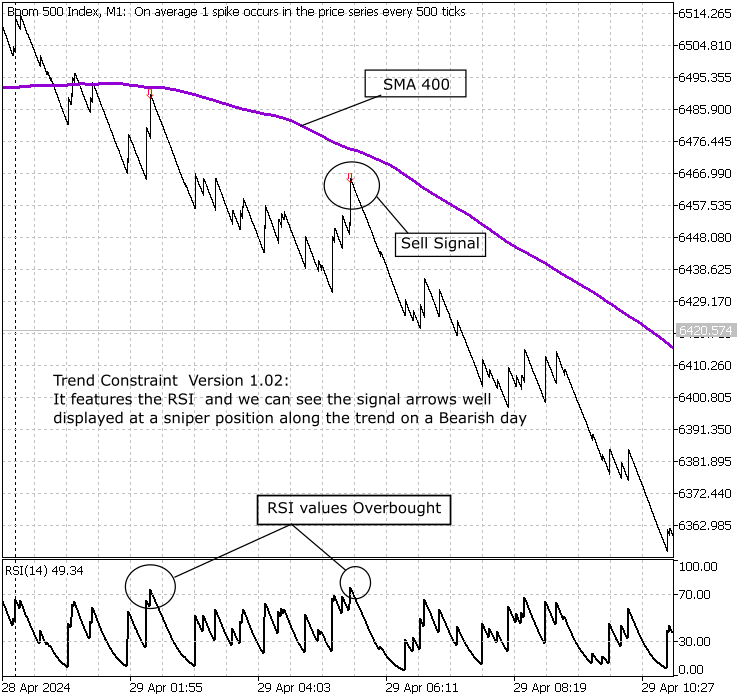
Fig 5: Trend Constraint v1.02, Boom 500 index
Conclusion
The Candlestick Trend Constraint Indicator cannot replace Moving Averages but can complement them to achieve excellent results. The built-in indicators on MT5 serve as the basis for creating other custom indicators. When used together, these tools can be very effective. We have advanced to a new stage in this development and are beginning to face issues with weights and refresh challenges that need attention. Our next article will concentrate on tackling these challenges as we continue to refine this system.
Refer to Algobook
 A feature selection algorithm using energy based learning in pure MQL5
 Introduction to MQL5 (Part 7): Beginner's Guide to Building Expert Advisors and Utilizing AI-Generated Code in MQL5
 Statistical Arbitrage with predictions
 MQL5 Wizard Techniques you should know (Part 18): Neural Architecture Search with Eigen Vectors
- Free trading apps
- Over 8,000 signals for copying
- Economic news for exploring financial markets
You agree to website policy and terms of use
Profound!
Thank you. Hope you found it useful.