Laurent Scherer
Laurent Scherer
  • Information
7+ Jahre
Erfahrung
0
Produkte
0
Demoversionen
0
Jobs
0
Signale
0
Abonnenten
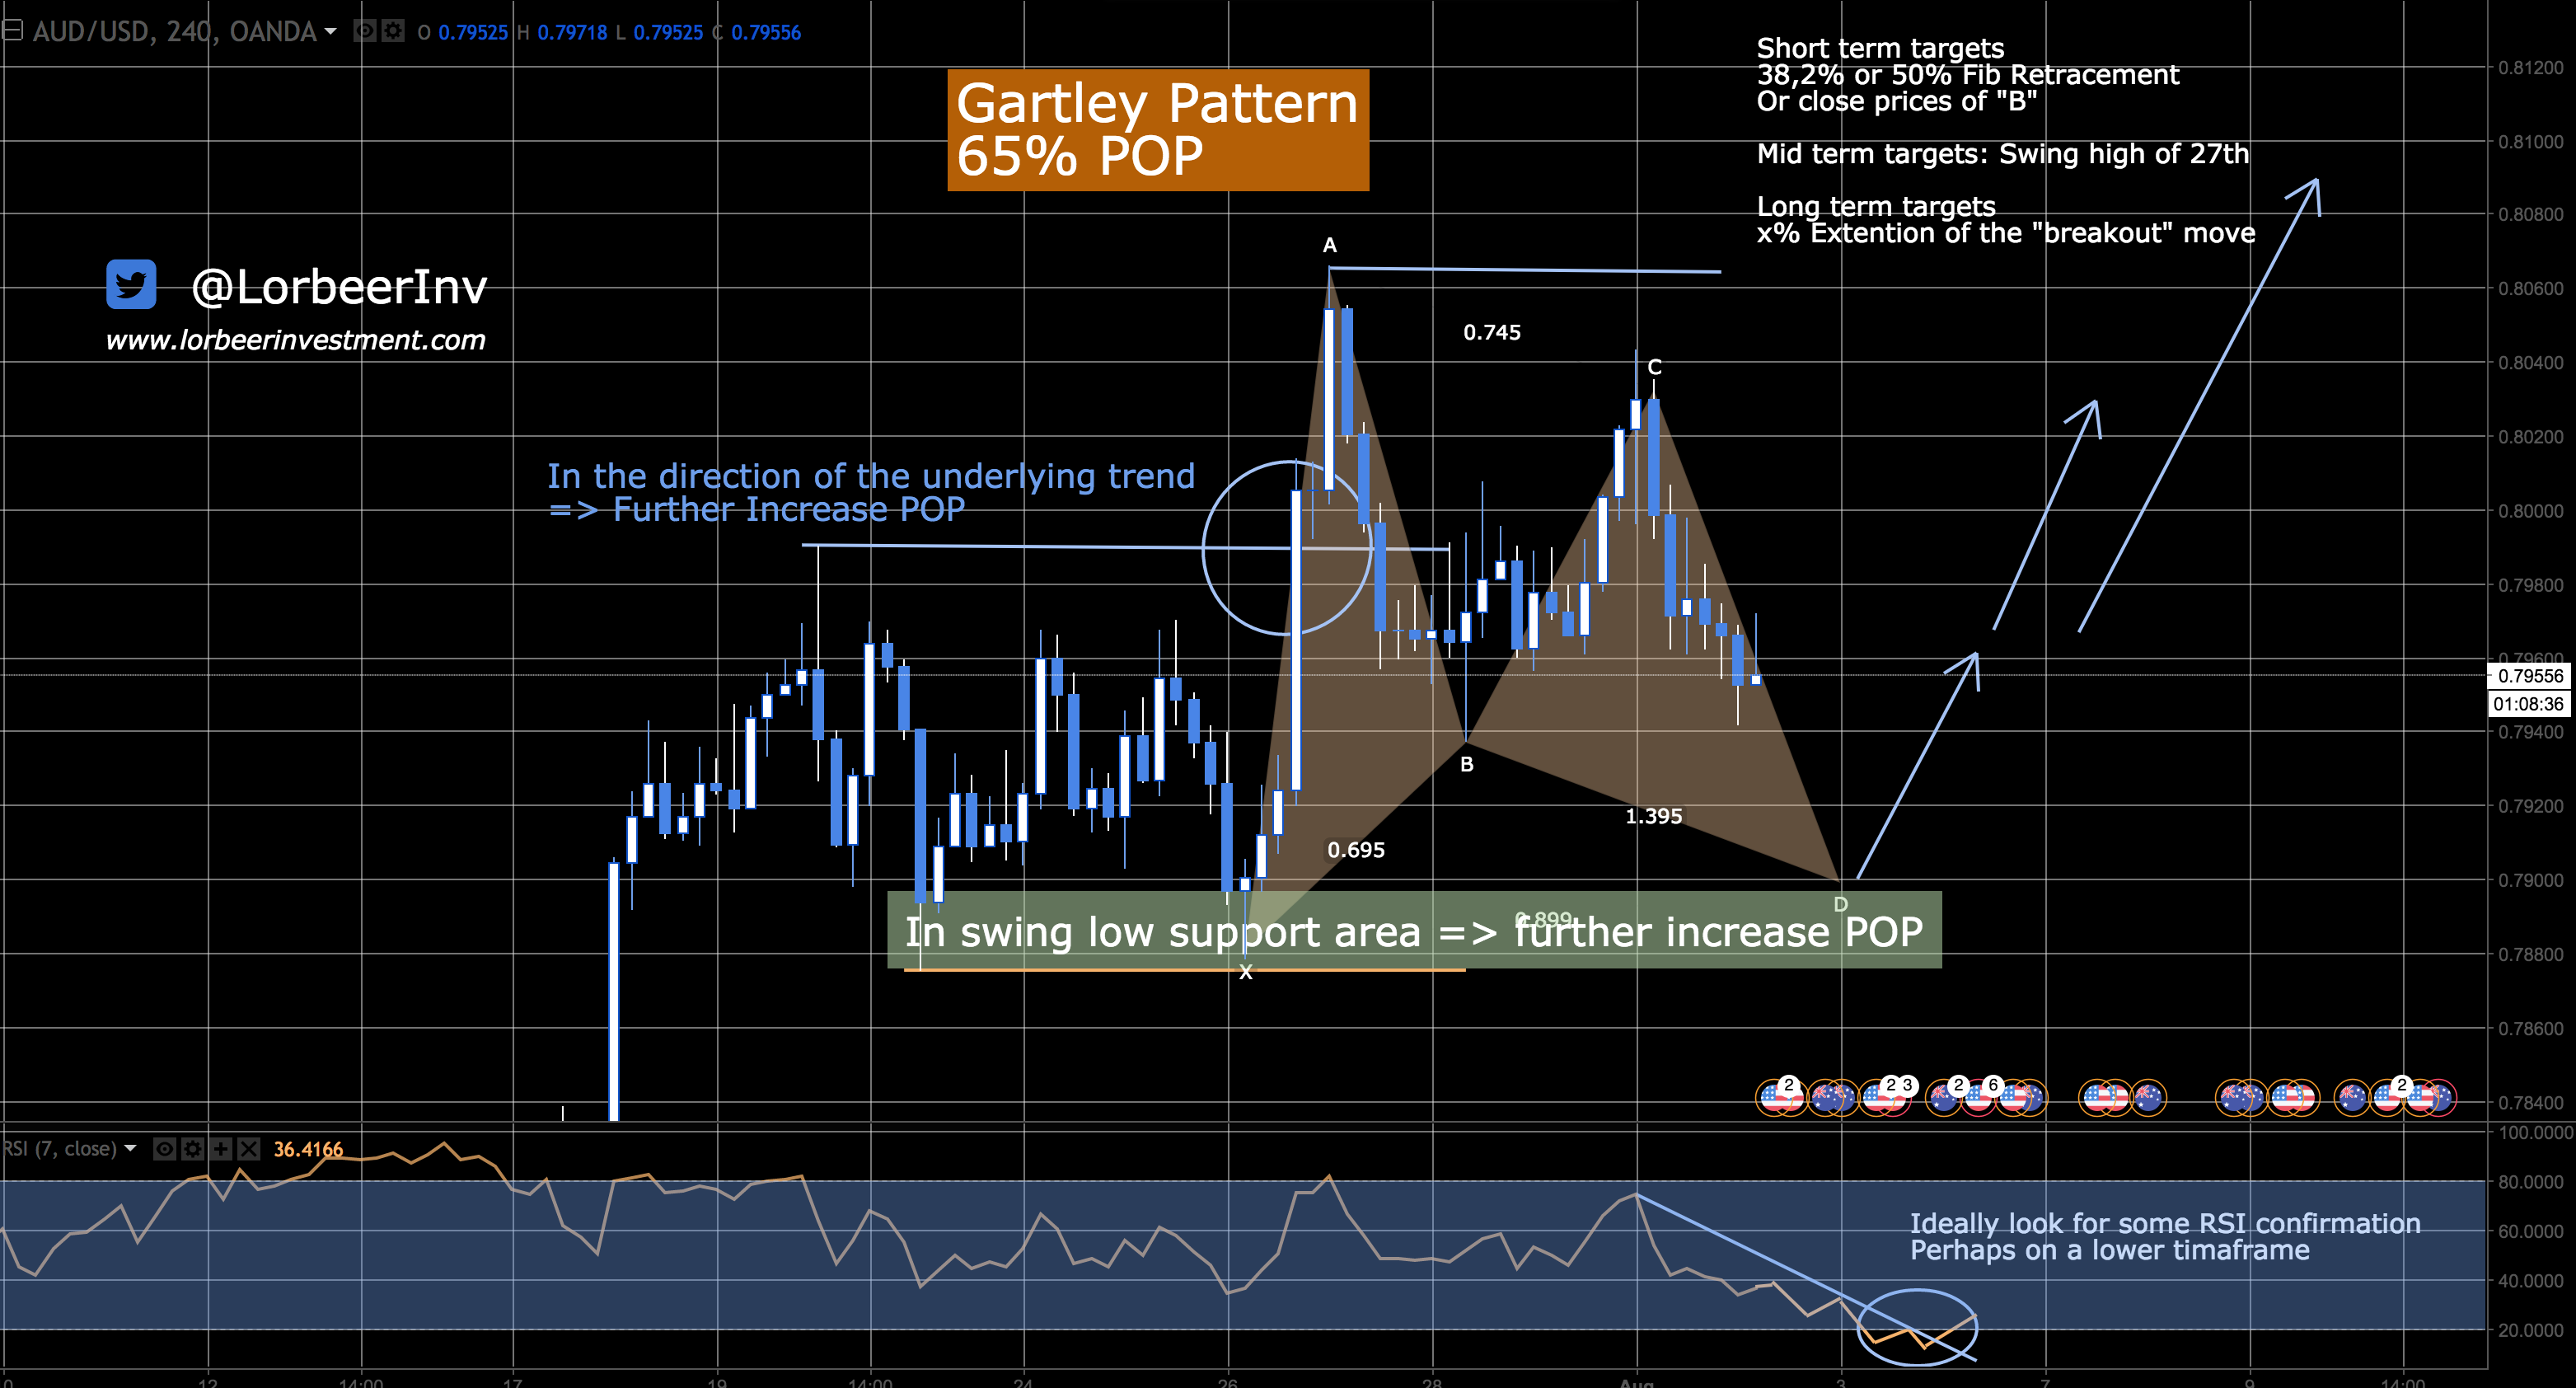
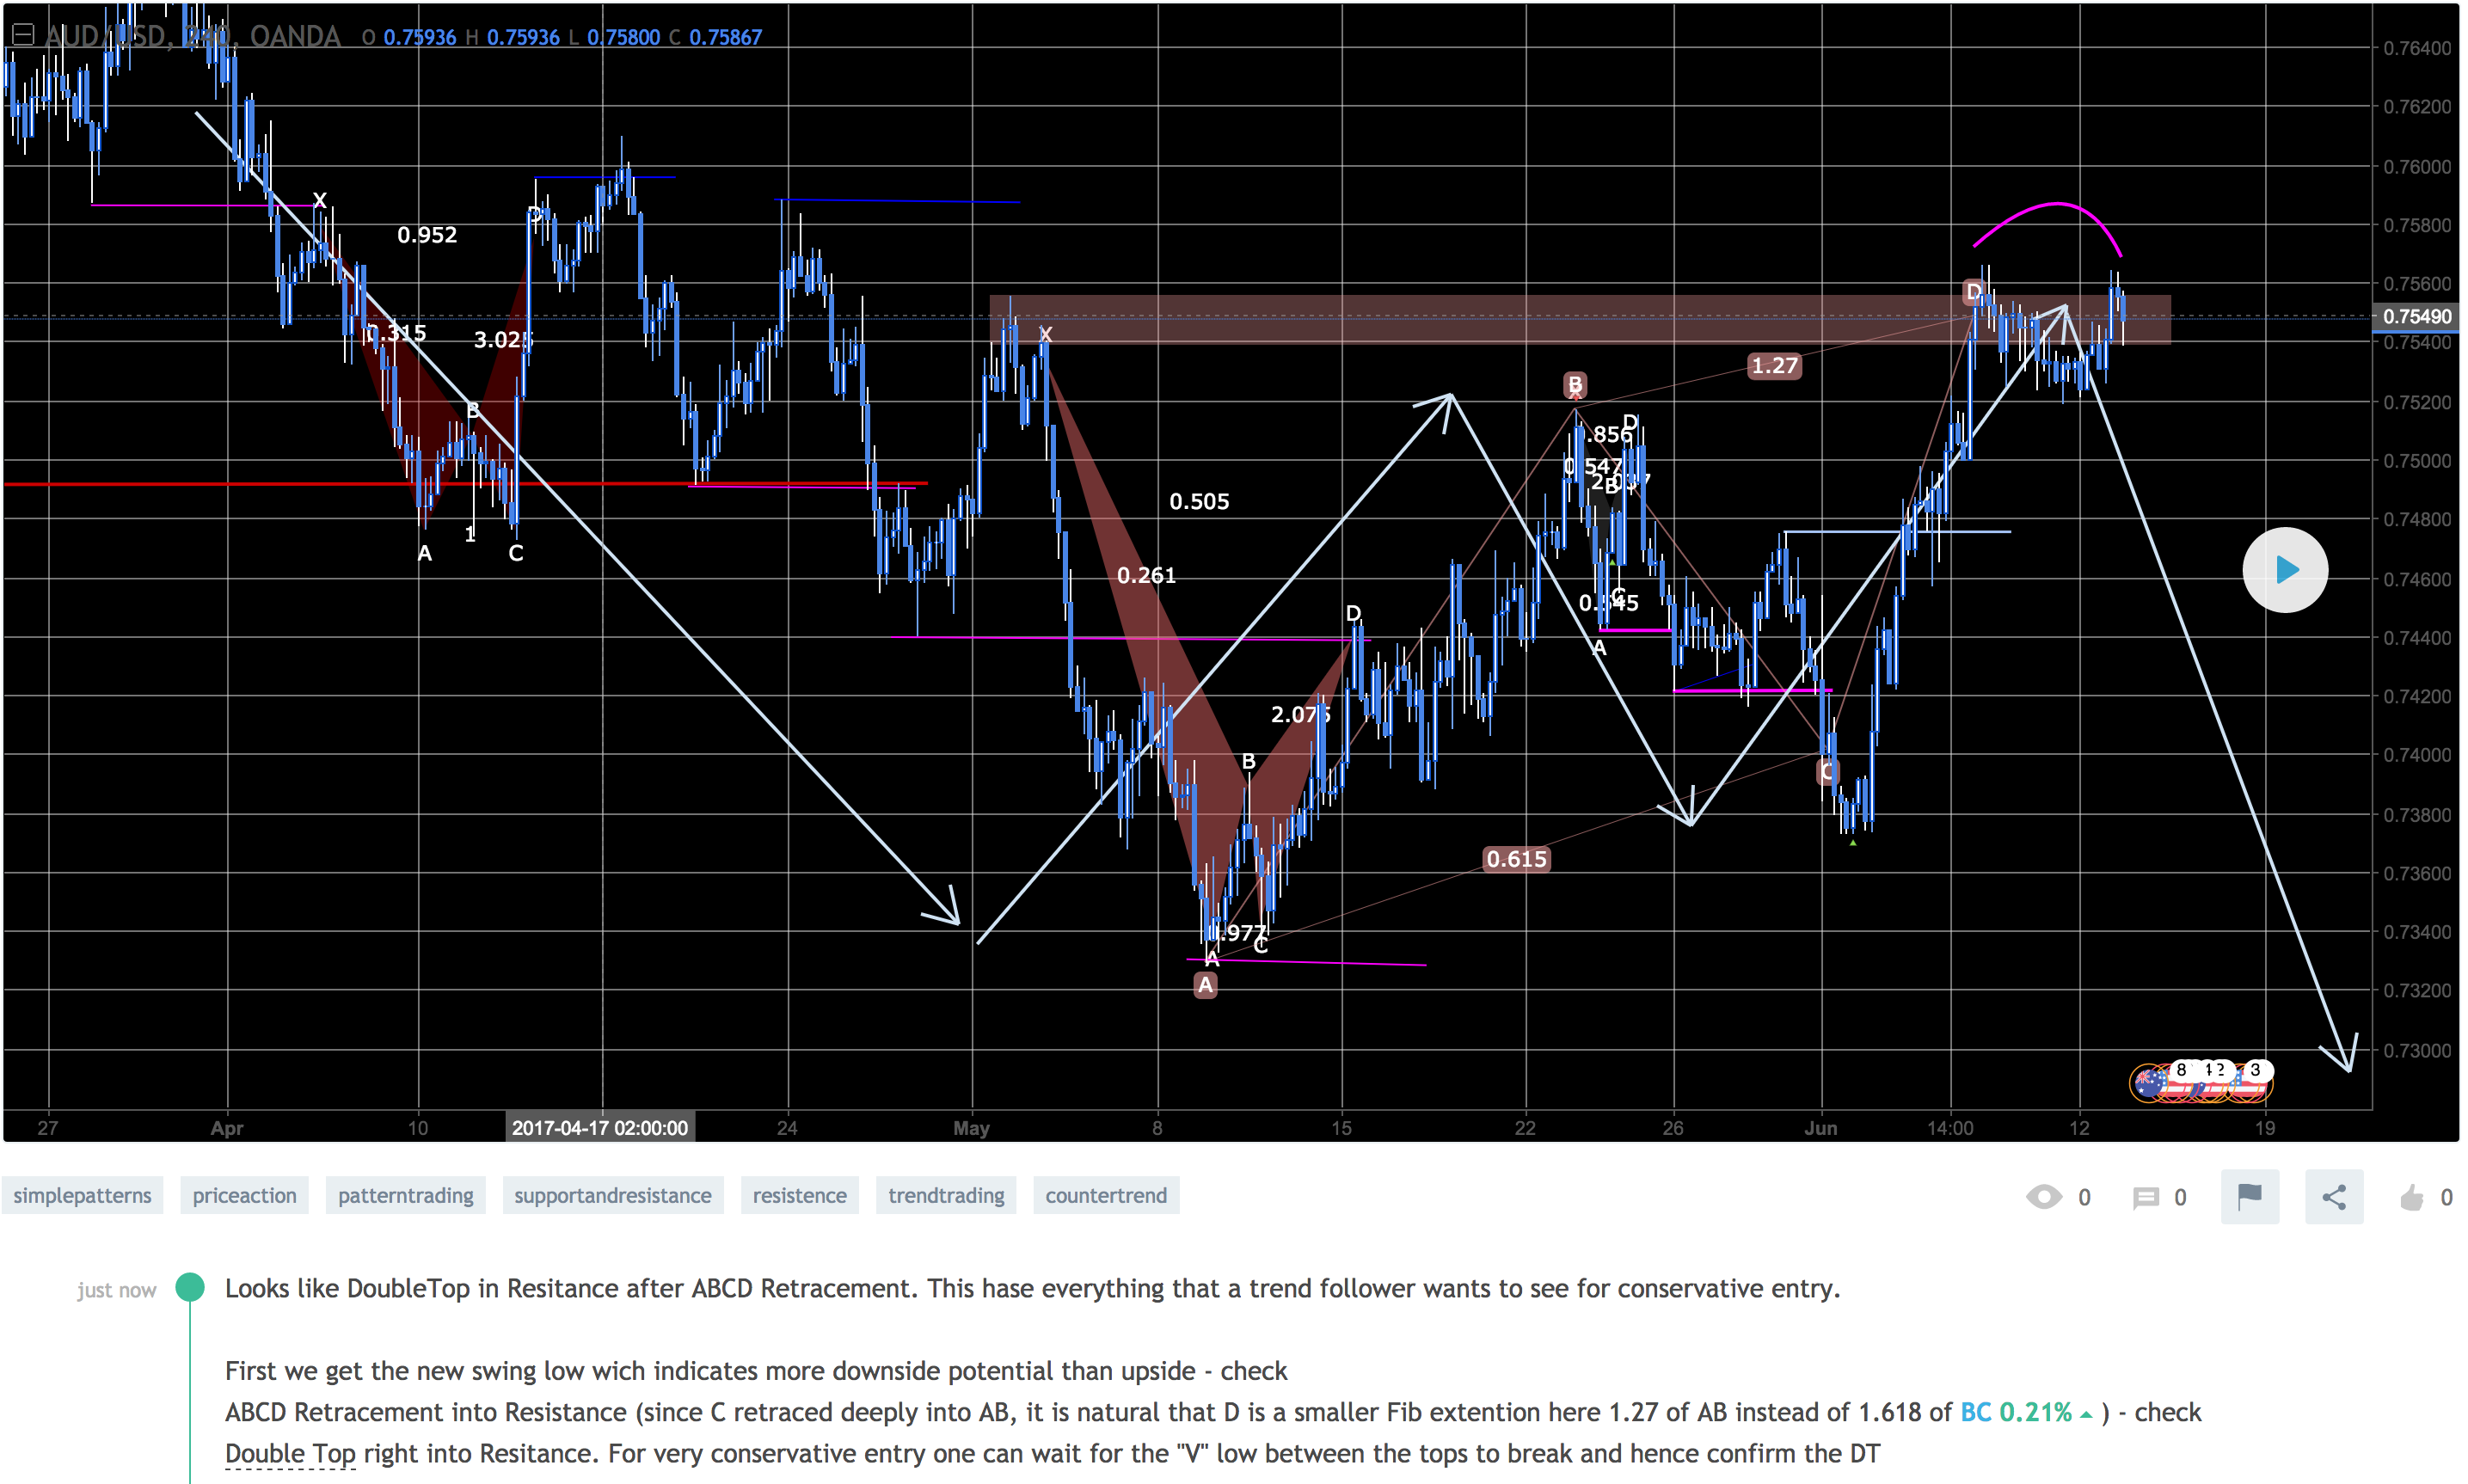
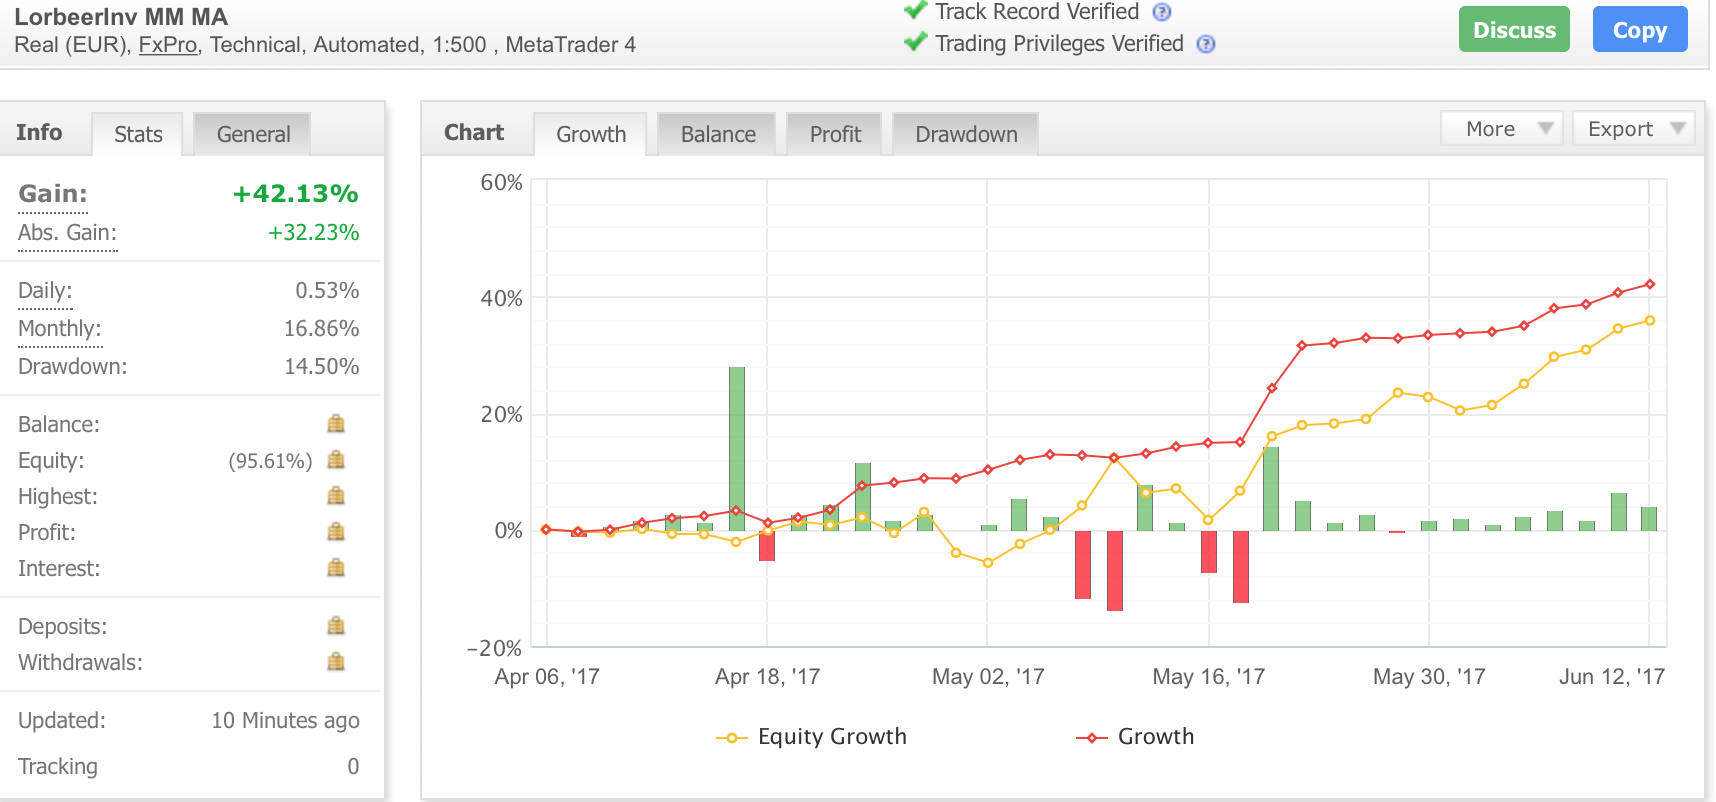
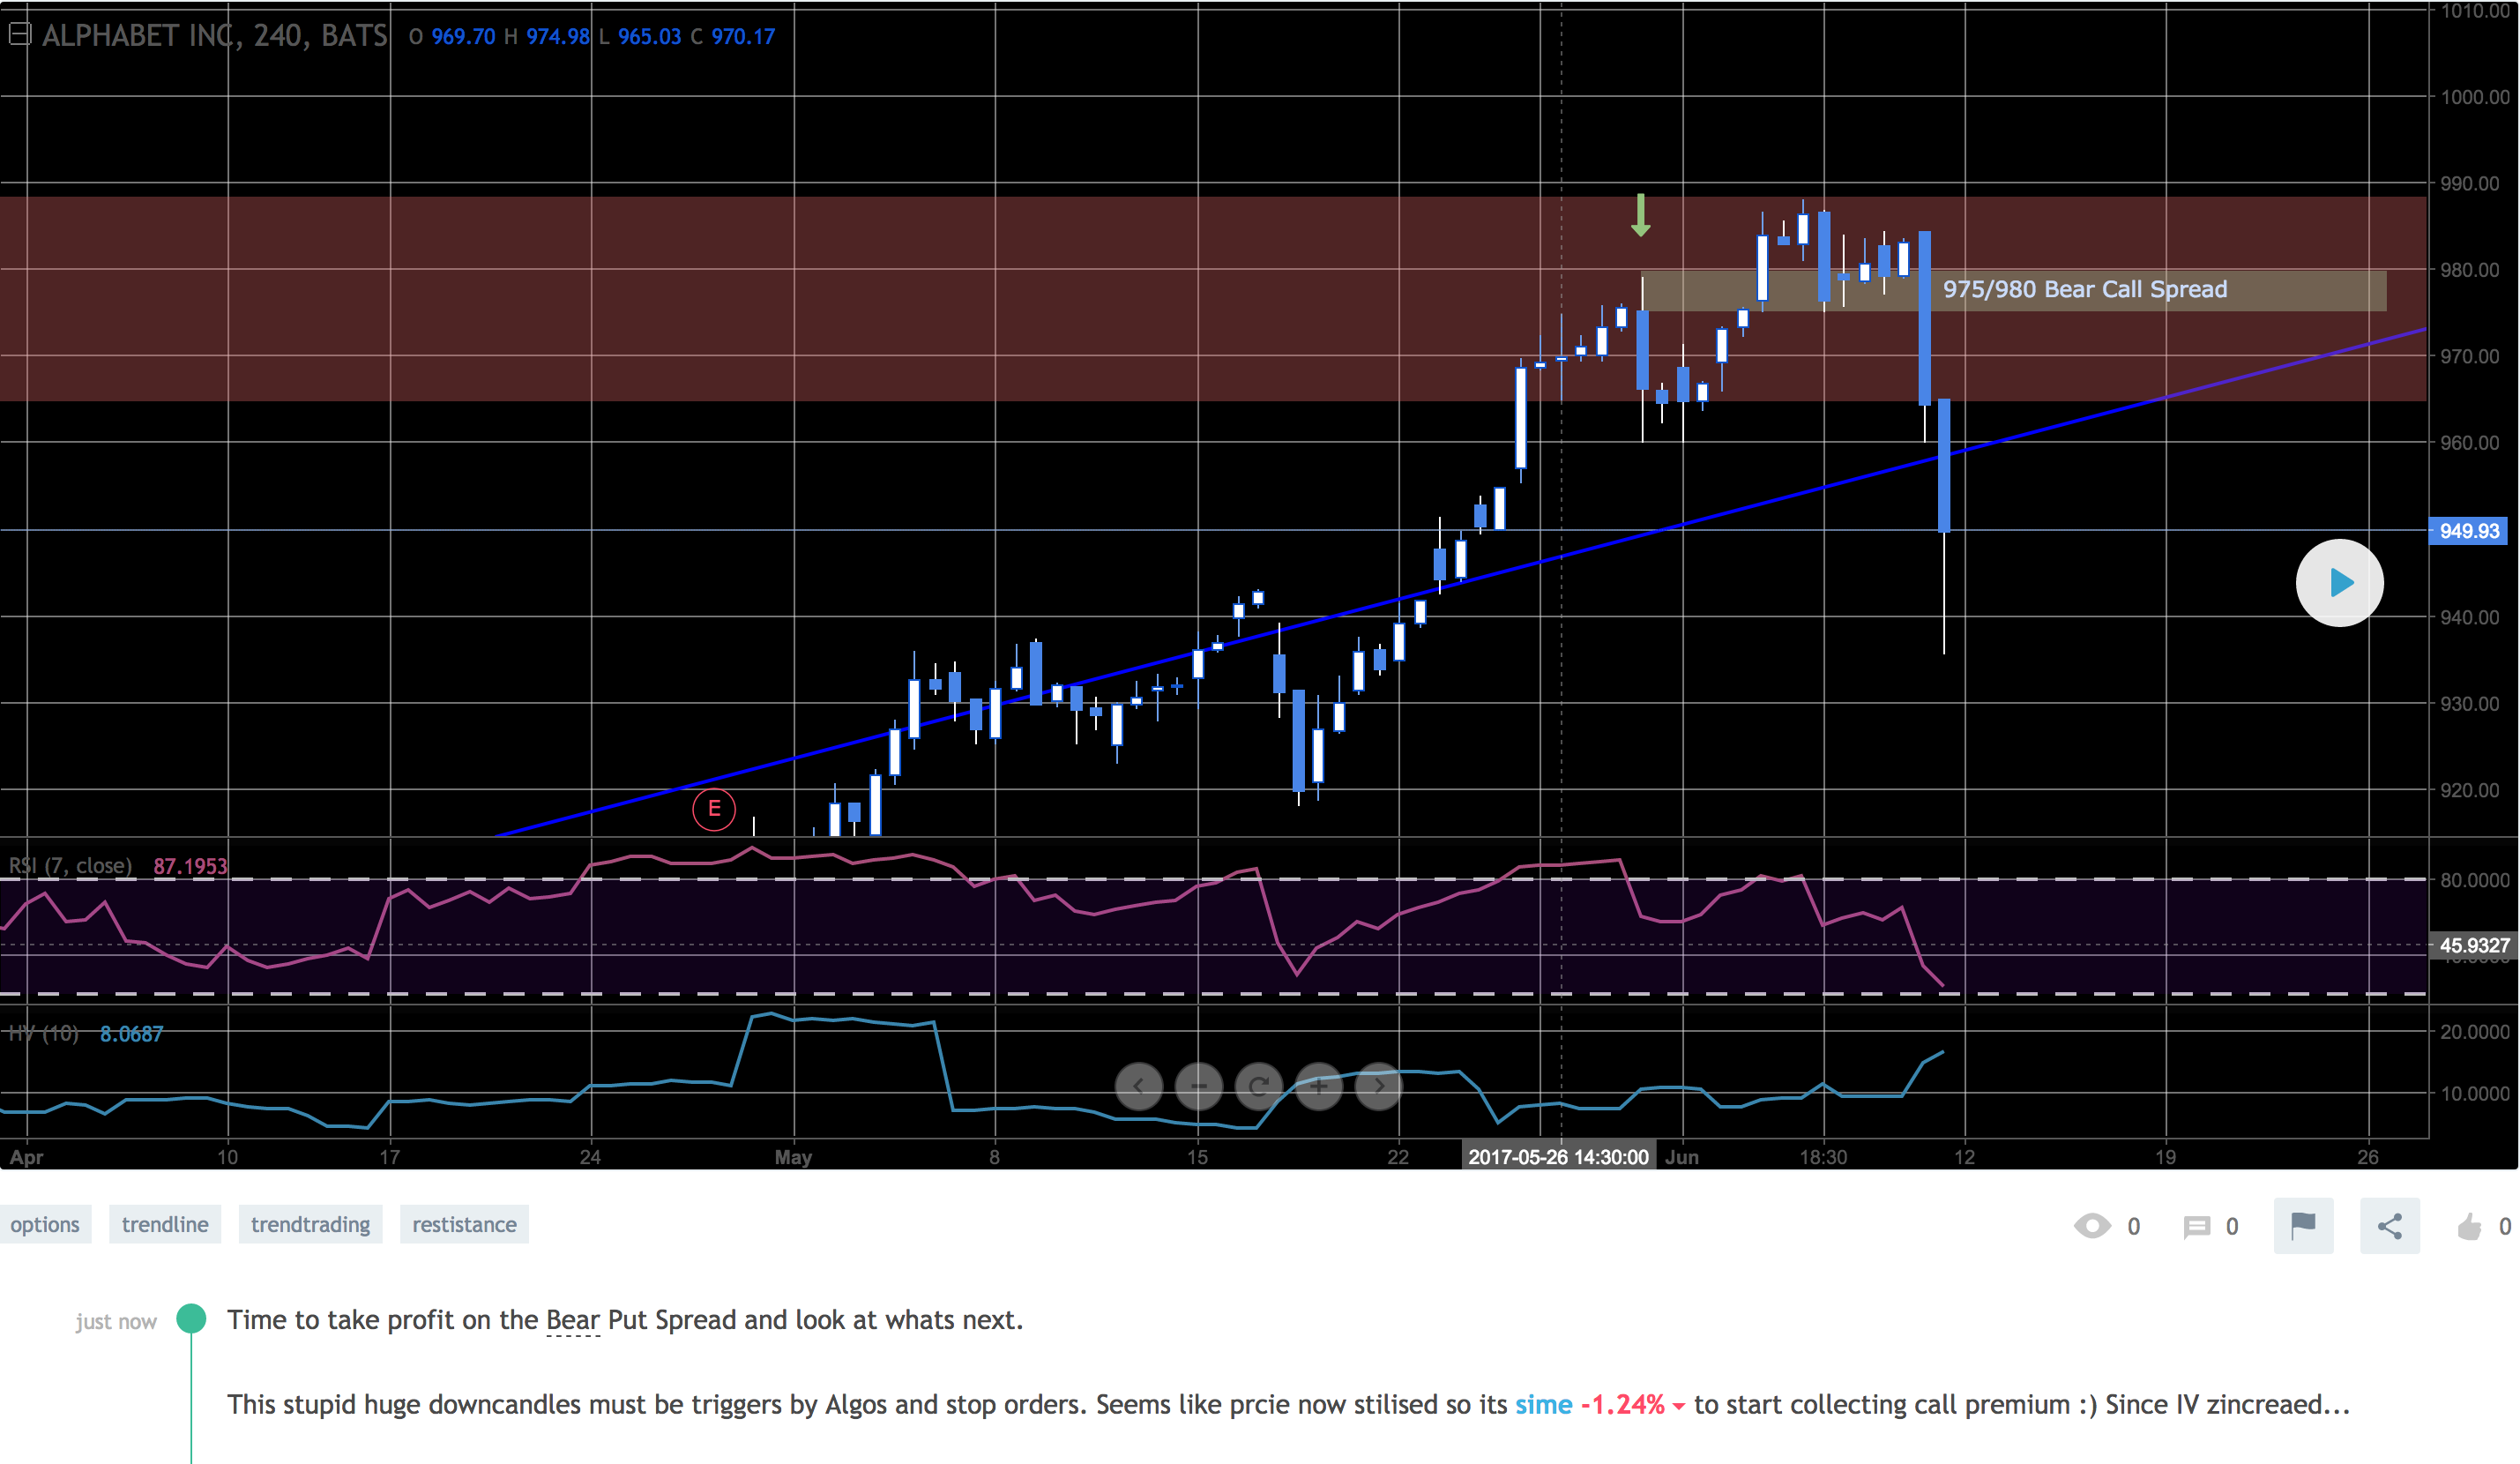
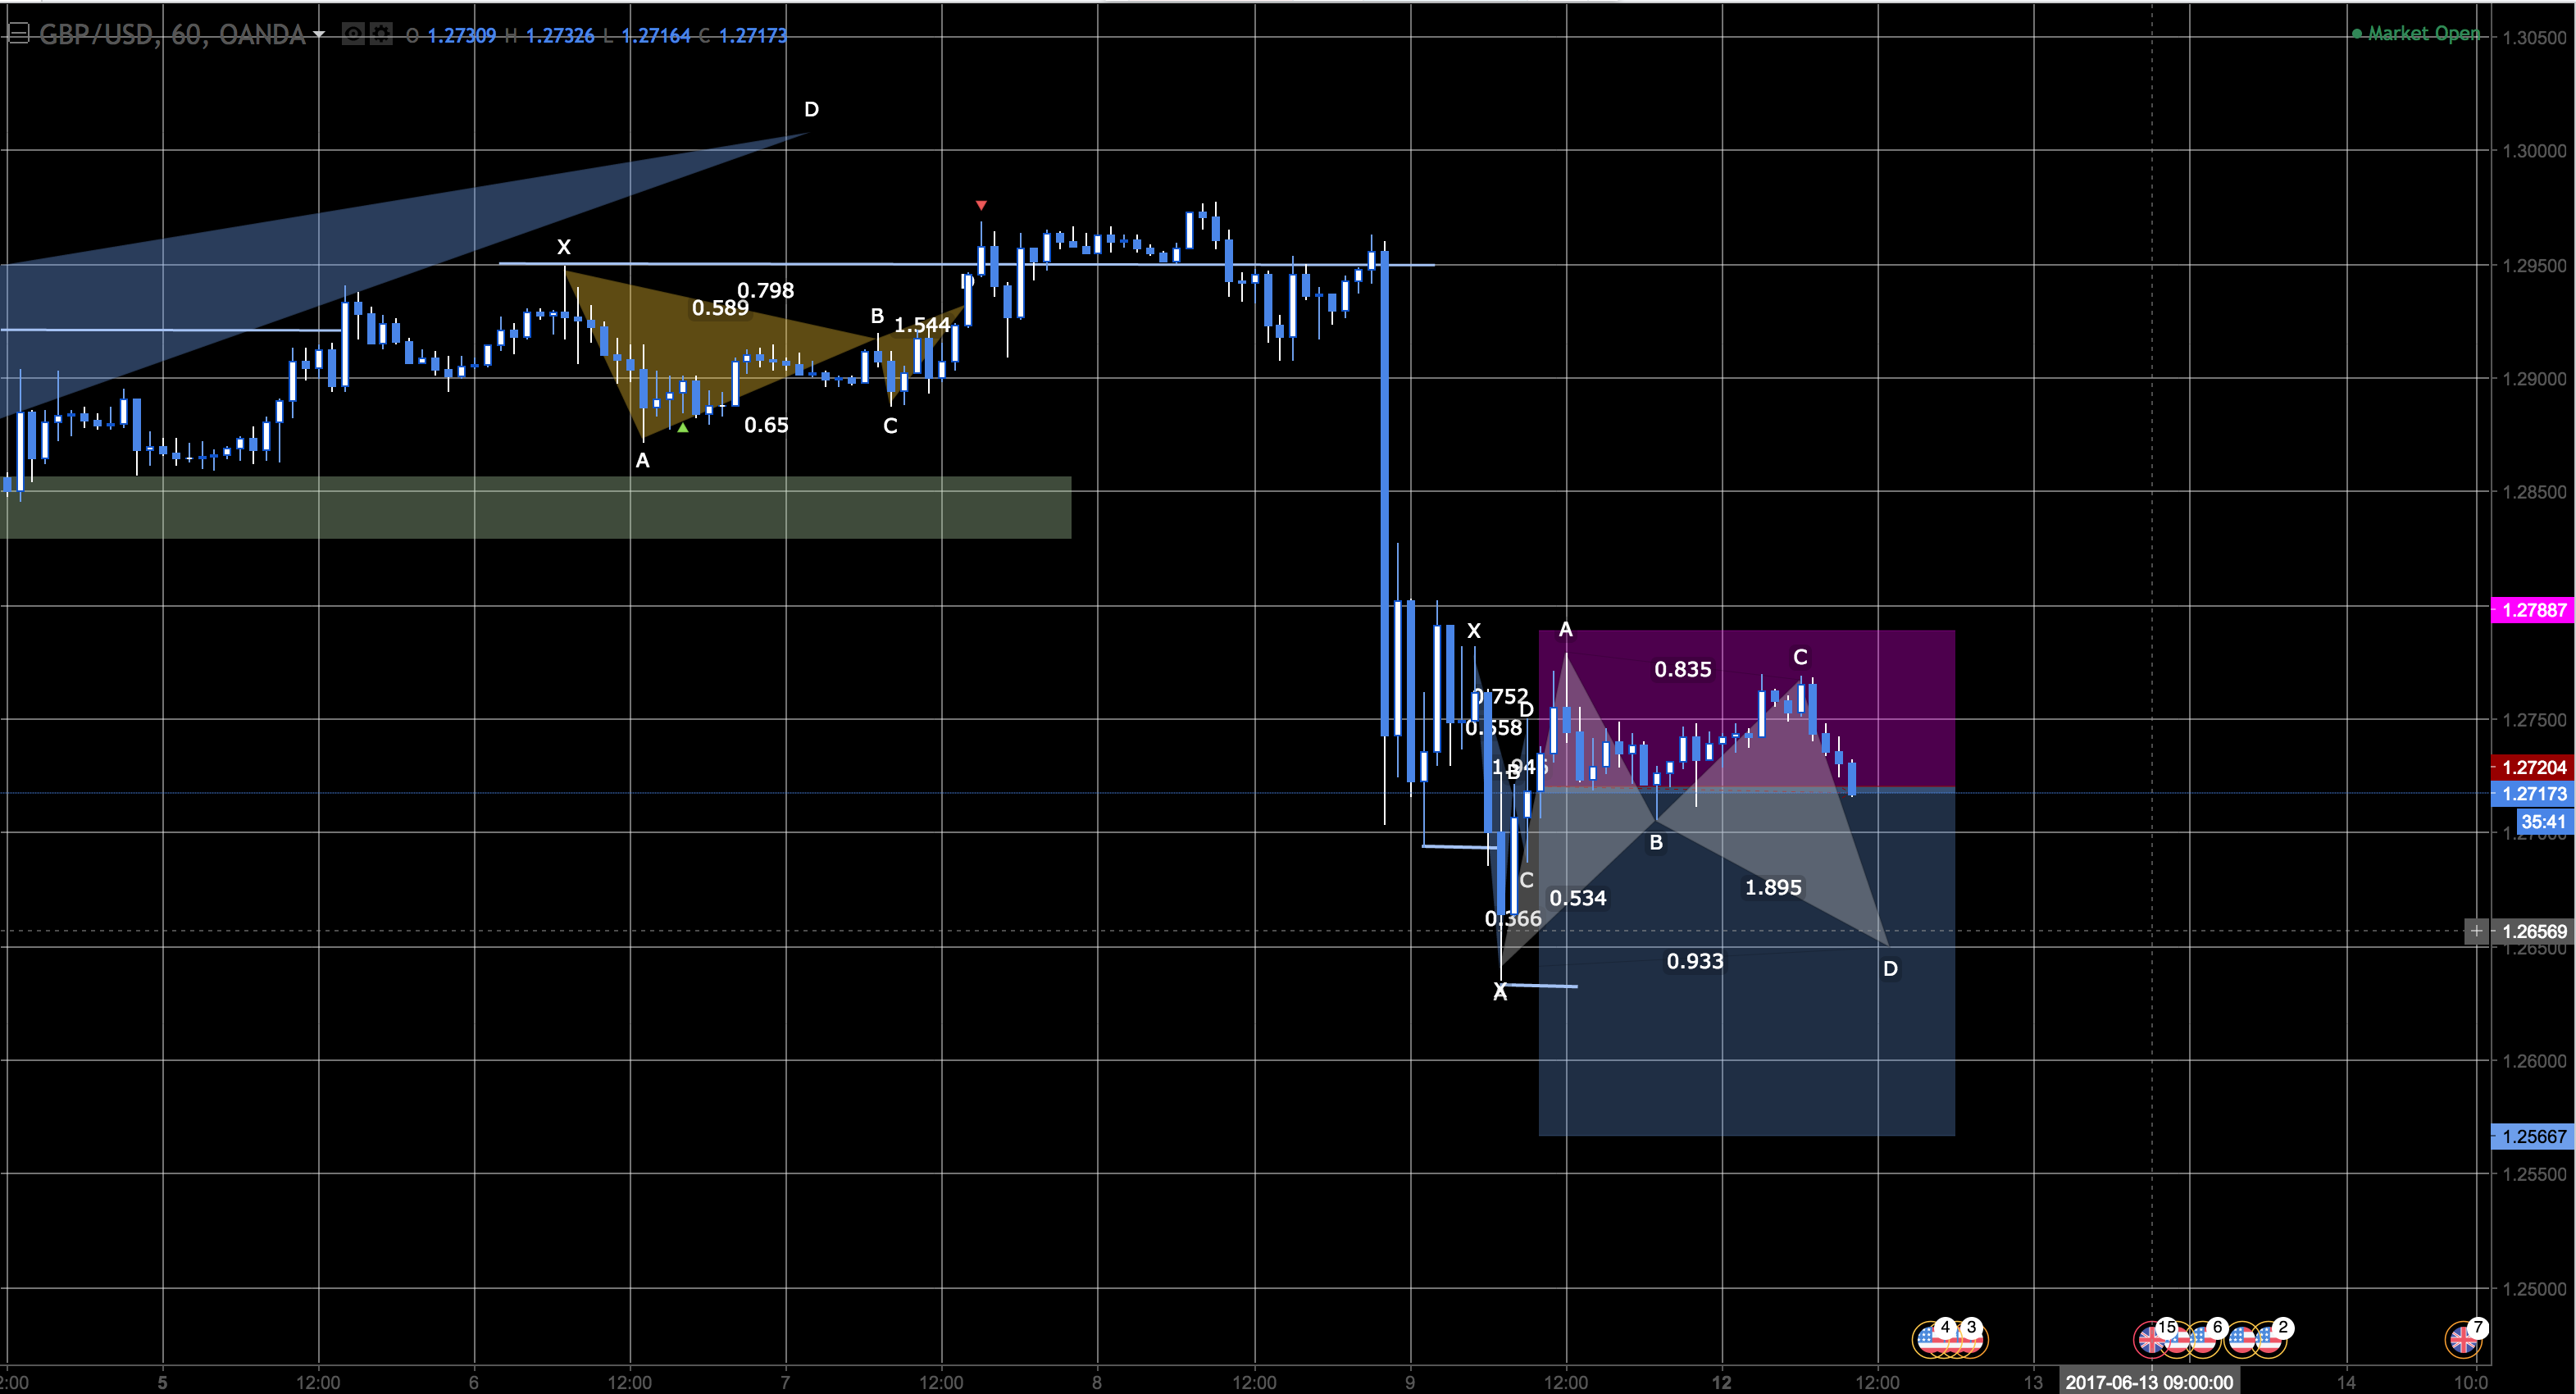
Hi, my name is Laurent and I trade the financial markets for more than a decade. I went from stocks to ETF´s, Futures and finally in 2012 I settled on Forex thorugh CFD´s. Today, I manage two different currency trading portfolios, a securities investment portfolio and one options trading portfolio. From 2017 on I am providing mirror trading services by selling trading signals of the two currency portfolios directly into customer accounts. For further information please visit: www.lorbeerinvestment.com
Laurent Scherer
Laurent Scherer
Gartley Pattern on its own already has a high POP, Probability of Profit & paired with additional arguments for long trades the chances of success are further increased! Together with a great Risk/Reward - Ratio, traders can benefit from a better than average trading opportunity.

Leave a comment or PM me in case of any questions.

Get some extra €€€ for your summer vacation!
Laurent Scherer
Laurent Scherer
EUR/USD - Weekly
Laurent Scherer
Laurent Scherer
Adding context to the actual price level may prevent entering losing trades and/or define most promising exit strategies for trend traders. It certainly helps defining the preferred trading direction. The EUR/USD recently entered a wall of resistance. Let's break this down and discover where the opportunity is.
Direction

Monthly Chart - With the January 2015 close below several important swing lows, traders clearly expressed their rather pessimistic view on the Euro against a more optimistic view on the dollar. This Euro depreciation started with the close below the 2008 swing low in 2010. Price moved into a downtrend (lower highs & lower lows) after the great Euro rally ended with a peak at 1.60 in 2008.

Fundamental - Just before and during president Barack Obama the dollar oscillated down with continuously lower swing highs. From 1.604 to 1.515 to 1.495 to only 1.400 before falling from a cliff. During this last impulsive short fall the Eurodollar lost another 25,3% of its value before starting a sideways consolidating phase.
The protectionism that President Donald Trump announced during his campaign, is in my opinion supporting a strong dollar at first but on the long run it weakens the US's position and may backfire. Furthermore, I seriously doubt that president Trump can deliver on his promises.
The Fed consistently raised their interest rate from 0.25% in 2015 to now 1.25% within 2 years. At the same time the ECB leaves the Euro interest rate a 0.00%. Naturally money flows form the Euro into the US dollar.
Fundamentally I am rather neutral to short for the Euro against the US dollar.

Technically & Fundamentally my longterm approach, over the next years on the EUR/USD is rather speculating on further shortfalls vs extended rallies. On the short term however, I am prepared of seeing many uptrends within the underlying downtrend.


Entree areas

The red zones mark resistance areas that result from former swing lows. Such levels are used by traders t place their trades and act as magnets to price since cluster orders are waiting their execution in these areas. For longterm trades, these are the price levels we want to pay attention to when price enters them.
The RSI is just short of being overbought. This does not trigger any entry signal since the RSI can stay overbought for month with price keeps rising and rising. I want to see an RSI that was overbought and now heading south before entering longterm short trades.

Let's move one timeframe closer and change to a weekly candlestick chart.

Trades

The purpose here is to shrink this 1.000 Pips resistance wall and narrow the price levels that I will be observing in the next months.
Since this cliff fall, price created a sideways range between 1.170 and 1.045. A "break out" of this range may push price into the dark red "cluster resistance areas" These areas result from multiple Fibonacci extension levels relative to the cliff fall (orange) and the range (light blue).
Furthermore, we see that the RSI on the weekly is already oversold (the line chart at the bottom). I want to see a break of the RSI uptrend, preferably within such a cluster resistance price zone. This may still happen in 2017.

If price does not "break out" of the range but RSI triggers short trades, there is still a shorting "Range Trading" opportunity considering that price bounced off of the 38,2% Fibonacci resistance. In addition, an Elliot wave 5 may complete in this area which could lead to a 3 wave correction move to the downside. Targets could be; RSI gets oversold or 50% of the range or the range low boundary or x% extension of the range. Of course there are countless more target strategies here that make more or less sense. Please apply risk management and due diligence before entering a trade.
Laurent Scherer
Laurent Scherer
GBP/USD - Outlook

Looks like price is about to complete an Elliot-Wave #5 before it might reverse into a 3 wave downtrend move. The 1.3250's look like a decent area of multiple resistance for countertrend traders to take short entries.

Break down of the 1.3250:
*Uptrend channel - Price first overshot the channel then undershot. Which leads to the believe of a weakening of the uptrend.
*Projection of 100% of wave 1 & wave 3 end in this price area
*Other Fibonacci extension levels that typically act as R&S cluster around this area

The more traders you have on your side the higher is your POP, Probability of Profit
Paired with a Risk to Reward of 1 to 2 or even 3 makes it a valid trading opportunity.

*Disclaimer: Reference is made to the disclaimer under lorbeerinvesmtent.com Please apply risk management before taking action upon a tip.
Laurent Scherer
Laurent Scherer
Looking at high probability opportunities on AUD/JPY for today, among others
Laurent Scherer
Laurent Scherer
Well well, didn't´t I recently warned about the downside potential of #cryptocurrencies on LinkedIn! I guess many unprepared, new traders learned the importance of stop loss- or hedge limit orders tonight. I am deeply sorry for all of those who lost substantial on this incredible dip and hope that we all can learn from this.
You may have an opinion and an edge on the markets, nevertheless you must be prepared for the unimaginable as well!!
Laurent Scherer
Laurent Scherer
AUD/USD - Triangle pattern with target in Resistance
Laurent Scherer
Profitable trading strategies can be created by using only math and logic, its really not that hard. But if this is true why do 90% loose instead of win or at least break even...
Laurent Scherer
Laurent Scherer
Multiple Long and Short trades with different dynamic SL & TP not to be confused with grid trading! #investsmart
Laurent Scherer
Laurent Scherer
Classic boring but EFFECTIVE trend following
Laurent Scherer
Laurent Scherer
Lorbeer Pattern in Support
Laurent Scherer
Laurent Scherer
AUD/CAD hedge worked out pretty nice. Now looking to close the initial long trades with BE or small profit
Laurent Scherer
Laurent Scherer
Hedging long Lorbeer Pattern on AUD/CAD to reduce cost and enable for adding position on the next support. This pattern has an 80% win rate hence I am looking forward to bank a profit on this opportunity
Laurent Scherer
Laurent Scherer
Advanced Trend Analyses

Looks like DoubleTop in Resitance after ABCD Retracement. This hase everything that a trend follower wants to see for conservative entry.

First we get the new swing low wich indicates more downside potential than upside - check
ABCD Retracement into Resistance (since C retraced deeply into AB, it is natural that D is a smaller Fib extention here 1.27 of AB instead of 1.618 of BC 0.21% ) - check
Double Top right into Resitance. For very conservative entry one can wait for the "V" low between the tops to break and hence confirm the DT
Laurent Scherer
Laurent Scherer
Here is a print of the actual performance as of 12.07.2017
Laurent Scherer
Laurent Scherer
The signal I have created ono mql5 is just 1/2 of the actual trades. Initially I created 2 signals but merged them into one. Here is my personal slave who follows the total signal 1:1 since April for a better understanding of the performance. From June on, the signal LorbeerInv 5 Ccy includes the total signal. The total is misleading dough because my watchlist consists of 9 pairs. Reference is made to the signal description.
Laurent Scherer
Laurent Scherer
Woow! That was a lucky shot on $goog !! Time to take profit on the call spread and look at a put spread :)
Laurent Scherer
Laurent Scherer
Took profit on the short $gbpusd now looking at a long bat pattern. However prefer to short the $eurgbp bat pattern instead
Laurent Scherer
Laurent Scherer
After nice profit taking on shorting $gbpusd last week I see another profit taking level + hedge possibility for the remaining position
12