适用于MetaTrader 5的技术指标 - 78

Indicator Price Pivot is an efficient tool for identifying trends in the Forex market. It serves as a reliable assistant to traders, helping to determine trend and range zones. Below are the characteristics and advantages of this indicator:
Features of the Price Pivot indicator:
Reliability and stability: The indicator does not repaint previous values, ensuring signal stability.
Quick reaction to trend changes: The indicator's algorithm allows for swift responses to market trend changes.

Paladin is a fundamental technical indicator specially designed for Forex traders. It is based on a unique algorithm that forecasts future prices by analyzing historical quote data over a specific user-defined time period set in the indicator's settings.
This indicator provides traders with valuable information about potential changes in price direction. Using a special formula at its core, Paladin accurately calculates signals. It effectively identifies reversal points or sharp price movemen

The PriceActionOracle indicator greatly simplifies your trading decision-making process by providing accurate signals about market reversals. It is based on a built-in algorithm that not only recognizes possible reversals, but also confirms them at support and resistance levels. This indicator embodies the concept of market cyclicality in a form of technical analysis.
PriceActionOracle tracks the market trend with a high degree of reliability, ignoring short-term fluctuations and noise around

Vanguard's Volatility indicator is based on the analysis of long and short price volatility. It helps to determine market entry points by displaying favorable entry points with arrows. This indicator can be used as a filter in trading or as a tool to show the exact direction of the trend. It is suitable for both scalping on small time intervals and long-term trading. It is important to remember that successful trading requires a comprehensive approach, and additional information is needed to en

The Pivot Point Pioneer indicator is based on unique indicators capable of detecting extreme points. It is ideal for identifying reversals or sharp price movements in one direction. Thanks to this indicator, you will be informed about upcoming events: a blue dot will appear for a buy signal, and a red dot for a sell signal.
This technical indicator allows you to assess the current state of the market and make a decision about entering a trend movement with minimal risk. It uses a process of a

Certainly! Let’s discuss the RSI Rush , an aggressive momentum indicator that combines weighted moving averages (WMAs) at lows, mid-price, and tight highs. Here are the key components: Weighted Moving Averages (WMAs) : The RSI Rush employs three WMAs: WMA at Lows : Calculated based on the lowest prices during a specific period. WMA at Mid-Price : Considers the average price (midway between highs and lows) during the same period. WMA at Tight Highs : Based on the highest prices during the speci
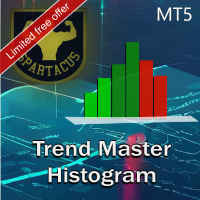
Trend Chart Histogram is an indicator based on an algorithm using two moving averages and several oscillators. Thanks to its color code, it allows you to quickly identify the trend and take advantage of the biggest market impulses. Light colors indicate the trend, dark colors define impulses and gray indicates that you should not enter the market. It will be a very good ally in your decision-making, combined with your other indicators.
MT4 version here.
Input parameters: - Period 1 (fast per

这是一个判断趋势的指标,是一个关于利用布林带,并通过指数化的方法,从而利用颜色来判断现在的趋势是顺势还是逆势,而且也利用中间颜色蓝色来判断即将转势的可能性。 并且,根据上轨,上轨EMA,中轨,中轨EMA,下轨,下轨EMA, 一共6条轨道来判断,价格是否处于适当范围里。
用法1: 判断趋势 A: 当上中下轨道通道都出现绿色,证明价格向上可能性大。 B: 当上中下轨道通道都出现红色,证明价格向下可能性大。 C: 当三轨道通道的颜色不一致时,有可能会有其他的变数。
用法2:关键点位 A:当价格超出上轨,证明价格偏向上。 B: 当价格超出下轨,证明价格偏向下。
另外, 配合不同的周期,例如:日线级别, 4小时级别, 利用这些级别的颜色来判断大趋势, 再利用低级别的周期的关键点位来进行下单。 还有一点就是参数 周期,系统默认的是20,个人觉得最佳的参数是144. 这是个人建议。

Higher Timeframe Chart Overlay will display higher timeframe candles, including the number of candles high/low you specify.
You no longer need to switch timeframes to check the candles. Everything can be shown in one chart. MT4 Version : https://www.mql5.com/en/market/product/115680 Almost everything can be change as you want. You can change/set:
- Choose different colors for the body and top/bottom wicks.
- Panel's height and width.
- The width of the body and wicks
- Change backgrou

1. CONSTITUTION Goby Momentum it consists of two oscillator and three dynamic bands (upper, middler, lower). The inputs can be used to adjust the oscillators, the dynamic bands and the alert signals. 2. UTILITY This indicator detects the exhaustion of correction movements within a trend, thus giving entry points for new trades. Entry signals can be generated for both smaller timeframes (>M5) and larger ones (<H1). 3. OPERATION CONDITIONS Buy signal: When the Waterfall [thick line] is above the u

Tired of information overload when analyzing forex currency strength? Introducing "All Currency Strength Live", the ultimate dashboard indicator for MetaTrader 5 that simplifies your trading life. This innovative tool provides a clear, concise overview of the strength of all major currencies, empowering you to make informed trading decisions with ease. With "All Currency Strength Live," you gain access to real-time insights into both price and volume strength across all major currencies. No mor

Certainly! Here's the revised Chinese translation including the information about the indicator not repainting its signals and being resistant to market noise:
介绍 Volatility Doctor RSI,这是一款基于可信赖的RSI指标构建的突破性工具,旨在提升您的交易体验。
我们的指标不仅提供实时的RSI读数,还准确预测了未来10步内RSI读数的位置,适用于您选择的任何时间框架和任何偏好的交易符号。此外,我们强调指标不会重新绘制其信号,确保您获得可靠的交易指导,同时对市场噪音具有很强的抵抗力。
自适应智能:这个智能工具学习并动态调整,无缝融入您独特的交易策略,增强您的决策过程。
立即使用 Volatility Doctor RSI 提升您的交易。
祝您和平、繁荣和交易盈利。
Volatility Doctor.

BS Time Band是一个很好的波段交易指示器,这个指标可以单独使用,但是最好是配合 StartPoint 一起使用效果更好,适用于任何时间框架,非常适合喜欢做波段交易的朋友。它能很好的体现出一个波段的完整信息,你可以很快的从这个指示器上寻找到最佳的预警区域,然后配合 StartPoint 找到最佳的buy位置和最佳的sell位置,也能很好根据指示器去坚守自己的持仓定订单。指标不含有未来函数,不会重新绘制,不仅能够应用到自己的手动交易过程中,还能完全可以写入到自己的EA中。(如果你感觉到这个指标能够帮助你进行更准确的交易,请帮忙给个好评,希望我的作品能够帮助更多有需要的人) =================参考使用方法=================== 此指标可以适用于任何交易品种。 做波段建议参数 timeFame:M5 如果配合 StartPoint 建议 StartPoint 的参数为(240,60)
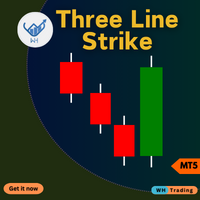
MetaTrader 5 (MT5) 的 ThreeLine Strike 指标 。此高级工具旨在帮助您精准轻松地识别市场中的潜在逆转。
无论您是初学者还是经验丰富的交易者,该指标都可以增强您的交易决策并最大化您的利润。 Contact me after purchase for guidance 主要特征: 准确的反转信号 :根据三线打击模式(技术分析中经过验证的蜡烛图形态)检测潜在的趋势反转。 可自定义的设置 :使用可调节的参数(例如,执行模式、时间范围和视觉偏好)来定制适合您的交易风格的指标。 实时警报 :当三线打击模式形成时立即收到通知,这样您就不会错过重要的市场机会。 用户友好界面 :直观的设计可以轻松解释信号并将其集成到您的交易策略中。 兼容性 :与您现有的 MT5 设置无缝集成,获得顺畅、高效的交易体验。 为何选择三线走势指标? 提高您的交易绩效 :通过可靠、及时的反转信号增强您的决策能力。 节省时间和精力 :自动化您的分析并专注于执行有利可图的交易。 适合所有交易者 :无论您是日内交易者、波段交易者还是长期投资者,该指标都适合您的交易风格。 立即试用三线走势指标,让

Structure Blocks: a structured way to analyze market structure
This indicator is for you if you are a price action or smart money concept trader. It identifies market trends' ultimate highs and lows and intermediaries' swing lows and highs. It adjusts based on candles' body where most of the volume is, disregarding wicks. Need help or have questions? I am Lio , don't hesitate to reach out! I am always available to respond, help, and improve. How it works:
Each block consists of a move wit

Description of work
The 'MA7 Clover' indicator is based on candle shapes. Shows the 'Pin Bar' candle pattern. Detailed information about the 'MA7 Clover' indicator.
Indicator settings
General settings: Min body size ; Max body size ; Min nose size ; Max nose size .
Message settings: Send message to the terminal (Alert) – permission to send messages to the terminal using the Alert function; Send message to the mobile terminal (Push) – permission to send messages to the mobile terminal using
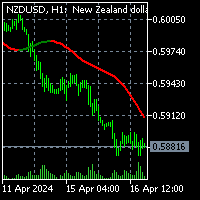
To download MT4 version please click here. - This is the exact conversion from TradingView: "Sentiment Range Ma" By "ChartPrime". - This is a non-repaint and light processing load indicator - You can message in private chat for further changes you need. - All input options are available. - Buffers are available for processing within EAs. - Highlight option is omitted as does not show good in Metatrader.

To download MT4 version please click here .
- This is the exact conversion from TradingView: " PA-Adaptive Hull Parabolic " By "Loxx".
- This is a non-repaint and light processing load indicator
- You can message in private chat for further changes you need.
- All input options are available.
- Buffers are available for processing within EAs.
- Highlight option is omitted as does not show good in Metatrader.

这个 DYJ PowerSignalSource 是基于ATR技术指标的完整交易系统。该指标将分析并记录从M5-MN中每个周期和当前货币对趋势强度 DYJ PowerSignalSource 通过评估这些数据来创建一个趋势强度和入口点信号列表显示。当趋势百分比达大于等于75%时认为是强货币,如果趋势强度百分比达到100时候是最强,则一个警告会弹出来指示这种情况。 该指标可以独立使用判断大趋势信号,并在适当价格进场和离场,并且指标配备了发送信号策略,使用 跟单软件DYJ GameDevice 实现自动开仓关仓。您也能使用震荡类型信号源(例如 DYJ WPR 指示器)接收这些趋势信号,辅助震荡指标的精确入场和离场! Input
InpUseLanguage = English InpPowerSignalMinPercent = 100 // InpPowerSignalMinPercent:Min InpPowerSignalMaxPercent = 100
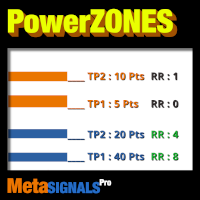
立即获得触及 3、4 或 5 次的战略区域,使价格磁化 | 根据强力区自动获得点数或价值的 TP1/TP2/TP3 | 直观检查您的风险/回报比是否安全 | 非重绘、非延迟指标 - 手动和自动交易的理想选择 - 适用于所有资产和所有时间单位 购买后, 请联系我的频道 获取推荐设置 MT4 版本 使用 BladeSCALPER 和 TrendDECODER 获取我们的完整方法
主要特点
动态强力区: 即时显示真正的 强力 支撑位和阻力位,实现精确的进场、止损、TP1/2/3。 自定义警报: 通过可定制的突破事件警报,随时了解潜在的交易机会。 多时间框架分析: 在不同时间框架之间无缝切换,全面了解市场趋势和价格走势。 用户友好界面: 直观的设计使新手和有经验的交易者都能轻松使用 PowerZONES。 灵活设置: 通过可定制的参数和可调整的设置,使 PowerZONES 适合您的交易风格。
为什么更好?
我们在基本的支撑位和阻力位概念上进行了创新,增加了新的功能:
区域: 与线型相比,更符合现实交易情况 强度: 我们
您想在外汇市场取得成功吗? 我们创新的 AI Swing Trading 指标是您交易成功并盈利的秘密钥匙。 我们向您展示这个独特的工具:
我们的指标配备了内置神经网络,可让您分析大量数据、识别变化并预测价格走势。 该技术使您能够根据深入的市场分析做出明智的交易决策。 该指标算法基于:斐波那契水平、价格行为和交易量。 这使您可以根据数学模式确定潜在的进入点和市场进入点。 应在 M30 时间范围内对 EURUSD 货币对使用 AI 波段交易! AI Swing Trading 指标不会停滞不前。 在工作过程中,不断优化自身,适应不断变化的市场情况。 这意味着即使市场发生变化,您也将始终领先一步。
AI Swing Trading 不仅分析当前走势,还分析外汇市场的全球趋势。 这使您可以了解发生了什么并做出明智的决定。
该指标是从2009年开始的多年交易经验的成果。它是由交易者为交易者开发的,考虑到了外汇交易的各个方面。
不用担心错误信号。 AI Swing Trading 不会重绘,这意味着您看到的信号保持不变,您可以依靠它们做出已知的交易决策。
我们的

1. CONSTITUTION Salmon Momentum is an indicator consisting of two momentum oscillators (Waterfall and Salmon) and three dynamic bands (upper, middler and lower). 2. OPERATION CONDITIONS Buy signal: When the Waterfall [thick line] is above the upper band. Salmon [dotted line] crosses the upper band from the lower band. Sell signal: When the Waterfall [thick line] is below the lower band. Salmon [dotted line] crosses the lower band from the upper band. Use a trend filter, for example, EMA
Heikin Ashi candlesticks smooth out the price data to help traders spot trends and patterns in the market. By averaging the price values, these candlesticks provide a clearer visual representation, making it easier to identify trends and predict future movements without the noise of standard candlesticks. We at Minions Labs are revisiting this topic because of our fellow Swing Traders, who love Heikin Ashi.
WHY SHOULD I CARE about the Smart Heikin Ashi? The Smart Heikin Ashi is an innovative
Welcome to the next level of trading sophistication with the Bollinger Bands Scanner for MT5! Elevate your trading experience and unlock enhanced insights and efficiency with our powerful MT5 indicator. Key Features: Effortless Bollinger Bands Scanning: Seamlessly harness the power of the Bollinger Bands Scanner to scan multiple assets effortlessly. Receive instant alerts when specific Bollinger Bands conditions are met, ensuring you're always ahead of market movements. Comprehensive Dashboard I
RSI Pro 分析器指标是一款功能强大的工具,专为希望在多个时间范围内同时做出明智决策的交易者而设计。 该指标利用 RSI 提供超买、超卖和趋势信号,更容易识别入市机会。 它的主要优点是易于阅读, 因为它具有清晰而独特的颜色代码来指示不同的市场状况。
该指标显示五个不同时间范围(D、H4、H1、M30、M15) 的 RSI 值和相关信号,使交易者能够获得全面的市场视角并在多个时间范围内做出明智的决策。
使用颜色变化来识别不同时间范围内的趋势和潜在逆转。 寻找超买和超卖区域,以发现反趋势或趋势逆转的交易机会。
红色: RSI 指示下降趋势。
绿色 :RSI 指示上升趋势。
深红色 :RSI 表示超卖区域。
深绿色 :RSI 发出超买区域信号。
您还可以通过弹出、电子邮件和推送通知发送的精确警报来通知购买和销售条目。
RSI Pro 分析器指标是交易者决策过程中的补充工具。 建议将其与其他指标和分析结合使用,以了解市场概况。
MT4版本。
输入参数:
RSI period: 14(默认),可根据您的喜好调整。
Enab

Introducing the 'No Nonsense Reversal Megaprofits' indicator for MetaTrader 5 (MT5), your ultimate tool for identifying trend reversals with precision and confidence. This powerful indicator is designed to cut through the noise of the markets and pinpoint crucial turning points with ease. Powered by advanced algorithms, 'No Nonsense Reversal Megaprofits' analyzes price action and key market dynamics to accurately detect when a trend is about to reverse. Whether you're a novice trader or a season
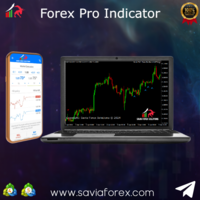
Savia Forex Pro Indicator (MT5) The Savia Forex Solutions Forex Pro Indicator gives you highly accurate entries on all Forex/Currency pairs, Indices and Cryptocurrencies. The Forex Pro Indicator is dynamic and powerful and is optimized for all timeframes and ALL Currency pairs, Indices, Commodities, and Cryptocurrency pairs. Trade with improved confidence and maximize your success rate. Benefits Dynamic and Powerful. Forex Pro Indicator is fully optimized for all chart timeframes. Forex Pro Indi

Boom and Crash Pro Indicator The Savia Forex Solutions Boom and Crash Pro Indicator gives you highly accurate entries on all Boom and Crash Indices. The Boom and Crash Pro Indicator is dynamic and powerful and is optimized for all timeframes. Trade with improved confidence and maximize your success rate. Benefits Dynamic and Powerful. Boom and Crash Pro Indicator is fully optimized for all chart timeframes. Whether price action is an uptrend, downtrend or trading sideways, Boom and Crash Pro Ind
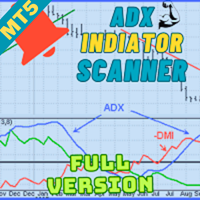
Welcome to advanced trading with the ADX Multicurrency Scanner for MT5! Elevate your trading experience with our powerful MT5 indicator, meticulously designed to offer seamless currency scanning and real-time insights. Key Features: Effortless Multicurrency Scanning: Unlock the full potential of the ADX Multicurrency Scanner for MT5 by effortlessly scanning multiple currencies. Receive instant alerts when specific conditions are met, ensuring you stay ahead of the market and capitalize on every
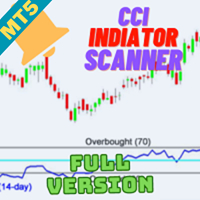
Welcome to the world of advanced trading with the CCI Multicurrency Scanner for MT5! Elevate your trading experience with our powerful MT5 indicator meticulously designed for seamless analysis and real-time insights. Key Features: Effortless CCI Scanning: Unlock the full potential of the CCI Multicurrency Scanner for MT5 by effortlessly scanning multiple currency pairs. Receive instant alerts when specific Commodity Channel Index (CCI) conditions are met, ensuring you stay ahead of market moveme

DYJ StochasticSignalSource随机振荡指标 显示为两条线。主线称为%K线。第二条线,称为%D线,是%K的移动平均线。 %K线通常显示为实线而%D线显示为虚线。有很多方法来解释随机振荡指标。其中有4种方法比较常用: 随机振荡指标(或%K或%D)降到特定水平以下(例如,20),可以买入。当随机振荡指标上升到特定水平以上(例如,80),需要卖出。 在线内区域交叉:K、D线在20以下时,%K线升到%D线以上买入。K、D线在80以上时,%K线降到%D线以下卖出。 只要交叉:%K线升到%D线以上买入。%K线降到%D线以下卖出
随机振荡指标(或%K或%D)升到特定水平以上(例如,20),可以买入。当随机振荡指标下降到特定水平以上(例如,80),需要卖出。 此外, DYJ StochasticSignalSource随机振荡指标 还在入场点和出场点标记了彩色箭头,并且还根据这些位置实时统计总利润和最大浮亏2项判断交易概率的重要数据 您使用跟单软件 DYJ GAMEDevice 接收 DYJ StochasticSignalSource随机振荡指标 信号源发出的开仓和关仓信号
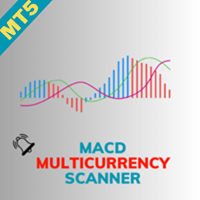
Welcome to the world of advanced trading with the MACD Multicurrency Scanner for MT5! Elevate your trading experience with our powerful MT5 indicator meticulously designed for seamless analysis and real-time insights. Key Features: Effortless MACD Scanning: Unlock the full potential of the MACD Multicurrency Scanner for MT5 by effortlessly scanning multiple currency pairs. Receive instant alerts when specific Moving Average Convergence Divergence (MACD) conditions are met, ensuring you stay ahea

This indicator obeys the popular maxim that: "THE TREND IS YOUR FRIEND" It paints a Blue line for BUY and also paints a RED line for SELL. (you can change the colors). It gives alarms and alerts of all kinds. IT DOES NOT REPAINT COLOR and can be used for all currency pairs and timeframes. Yes, as easy and simple as that. Even a newbie can use it to make great and reliable trades. https://www.mql5.com/en/market/product/115553
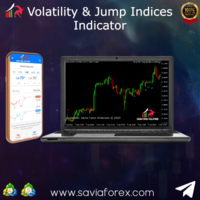
Volatility Index Pro Indicator The Savia Forex Solutions Volatility Index Pro Indicator gives you highly accurate entries on all Volatility Indices and Jump Indices. The Volatility Index Pro Indicator is dynamic and powerful and is optimized for all timeframes. Trade with improved confidence and maximize your success rate. Benefits Dynamic and Powerful. Volatility Index Pro Indicator is fully optimized for all chart timeframes. Volatility Index Pro Indicator works with Volatility Indices and Jum

Welcome to the future of trading! Are you ready to elevate your trading game to new heights? Introducing a groundbreaking trading indicator that is set to redefine the way you approach the markets. With its unparalleled features and cutting-edge technology, this indicator is not just another tool in your arsenal – it's your secret weapon for success. Imagine having access to real-time alerts that keep you ahead of the curve, ensuring you never miss a lucrative opportunity. Picture a tool that w

The technical indicator, TrendGenius , is based on the values of statistical trading indicators. It allows you to predict the future value of an asset. Calculations are carried out according to a certain algorithm based on data on quotes for a certain period. The tool was created to simplify technical analysis and is used on various markets and exchanges, including cryptocurrency ones.
A change in direction, from the point of view of market fundamentals, means a shift in trading interest to

SmartTrend Analyzer is a reliable non-repainting indicator that will interest any trader.
SmartTrend Analyzer is a tool that analyzes all five aspects (opening price, high, low, closing price, and volume) based on mathematical calculations. With the algorithm of the forex indicator SmartTrend Analyzer, you can quickly determine which trend is developing in the market at the moment. The SmartTrend Analyzer technical indicator is presented on the chart as a set of points for easy interpretati
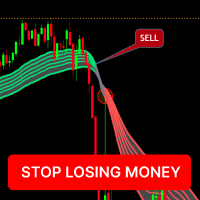
1. It works in all markets ( currency market , forex market , commodity market, deriv index etc) 2. It works in all time frames . 3. SLM (STOP LOSING MONEY) indicator works with 90-97% accuracy 4. It saves you from overtrading and losing money. 5. It gives you buy, sell and exit position signal through colors 6. It gives huge profits and sometimes very small loses also. 7. It can be installed in free version of trading view simple 8. After one time purchase you get life time support.
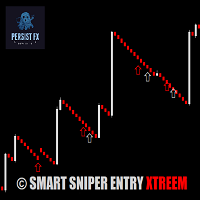
The Smart Sniper Entry XTREEM Spike Detector is a cutting-edge indicator specifically designed for traders who focus on the volatile Boom and Crash markets. This powerful tool detects spikes with an impressive 85% accuracy when combined with price action analysis.
*Key Features:*
- *High Accuracy:* 85% accuracy in detecting spikes, ensuring you can make informed trading decisions - *Market Specific:* Optimized for Boom and Crash markets, providing precise signals in these volatile environme

The "Trend Orbital" indicator is a tool for tracking trends in the financial asset market. It is based on the analysis of price data and provides a visual interpretation of the current direction of price movement.
Options: InpAmplitude: Amplitude - determines the amount of volatility that the indicator takes into account when determining the trend. Group "Arrow": InpCodeUpArrow: Up Arrow Code - Defines the arrow symbol to display an uptrend. InpCodeDnArrow: Down Arrow Code - Defines the arrow

The "Trend Tandem" indicator is a trend analysis tool in financial markets that helps traders determine the direction of price movement.
Options:
RISK: Determines the level of risk taken into account in the trend analysis. The higher the value, the more aggressively volatility is taken into account. SSP (SSP Period): Defines the period of the moving average used to identify a trend. The higher the value, the smoother the trend signal will be. CountBars: Determines the number of bars on whic

This indicator is used to detect spike movements in Boom and Crash pairs in Deriv company and enter into transactions. The pairs used are Boom300, Boom500, Boom1000, Crash300, Crash500, Crash1000.
When the indicator gives an arrow sign in the expected direction, the transaction is entered and Stop Loss should be placed on the support/resistance areas shown by the indicator.
The indicator does not repaint. It is not used for trend following, but for entering transactions in the direction of

ATR 波段警报是一种通道指标,其通道宽度计算为常数乘数(“乘数”)和“平均真实范围”指标的值。与布林带不同,带宽不会经常改变 - 在 ATR 波段警报指标中,波段通常有长直线。
ATR 波段警报的解释基于这样的事实:价格大多数时间都位于波段内,如果价格达到其中一个边界,则可能表示趋势发生变化。
该指标的特点包括: 如果价格超出该区间,我们应该预期趋势将继续走向突破。
该指标使用 DRAW_COLOR_BARS 样式 - 彩色条(请不要与彩色蜡烛图混淆)。因此,建议将图表切换到条形显示模式。
如果趋势反转,指标会显示买入箭头或卖出箭头。这些箭头的代码可分别在“买入箭头代码”和“卖出箭头代码”参数中设置。箭头代码取自“Wingdings”字体。
如果出现趋势,还可以连接警报:可以包含声音文件,警报,电子邮件或推送到移动终端。
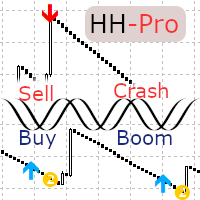
Finally, Harmonic Hybrid Pro is now available with numerous new features. It is highly recommended for utilization with Boom and Crash Synthetics. This tool generates a maximum of two orders per session and is designed to provide buy and sell signals in line with the current trend, effectively filtering out any superfluous signals. Users can optimize settings in the input section of the indicator properties. While the default configuration is suitable for Boon 500, adjustments may be necessary f

该 DYJ SignalSourceOfMACD软件 基于MACD指标。一般而言,当 MACD 和 MACD 指标的信号线交叉时会产生信号。 如果在 MACD 开仓参考位置下方的负数区,MACD 线向上穿越信号线,则产生买进信号。 负数区是 MACD 和信号线的值小于零的区域。 MACD 开仓参考位置的参数以点数设置。但是在代码中它被转化为:MACD 开仓参考位置 * 商品的每点大小。 例如,如果您将该值设为“3”,并对 EUR/USD 应用策略,MACD 开仓参考位置将等于 0.0003(3 点 * 每点大小 0.0001)。请注意,对于买进信号,该参数被解读为一个负值。 如果在 MACD 开仓参考位置上方的正数区,MACD 线向下穿越信号线,则产生 卖出信号 。 正数区是 MACD 和信号线的值大于零的区域。 请使用高概率开仓参数OpenLevel($)控制开仓位置,它决定低买高卖的深度,从而有机会获得更大利润! 并且这些BUY与SELL信号被发送出去,您使用 DYJ GameDevice 跟单软件能接收这些信号,并实现自动开仓和关仓,并能使用博弈策略功能,使得亏损订单变为获利。
DYJ SignalSourceOfRSI 是一种动量振荡器, 它通过将指定数量的周期内收盘价的升降运动进行对比,指示价格强弱 。
DYJ SignalSourceOfRSI 提供两种信号:
DYJ SignalSourceOfRSI 达到超买或超卖水平,然后出现一点反转: DYJ SignalSourceOfRSI 低于水平 (30) 时生成买入信号,RSI 高于水平 (70) 时生成卖出信号; DYJ SignalSourceOfRSI 跌破水平 (30) 然后升至水平 (30) 上方可被解释为买入信号。 DYJ SignalSourceOfRSI 上升到水平 (70) 以上然后跌破水平 (70) 可以被解释为卖出信号。 此外, DYJ SignalSourceOfRSI 振荡器还用彩色箭头标记了入场点和出场点,并且还根据这些持仓实时统计总盈利和最大浮动亏损,这是判断交易概率的重要数据。 并且这些BUY与SELL信号被发送出去,您使用 DYJ GameDevice 跟单软件能接收这些信号,并实现自动开仓和关仓,并能使用博弈策略功能,使得亏损订单变为获利。
I

In the trading world, there is no universal indicator that always provides exceptionally profitable signals regardless of market conditions. Despite your persistence, such a tool simply does not exist. However, with the Trend Master Arrow indicator you will have a reliable assistant in creating your own trading system.
Although following arrow signals requires caution and additional filters, the Trend Master Arrow indicator provides valuable information for identifying possible reversals or s

The Market Might indicator, despite its apparent simplicity, is based on complex analytical algorithms that allow you to accurately determine the moments of entry and exit from transactions. The signals generated by this indicator are accurate and timely, appearing directly on the current candle.
The main task of the Market Might indicator is to determine the moments of entry and exit from trades. Therefore, it displays only the trend line and entry points, which provides a clear view of the

The Currency Master indicator is an intuitive tool for determining the current trend in the market. Its implementation is based on a simple visualization in the form of two-color lines, which makes it easy to use for both new and experienced traders.
This indicator not only helps users determine the direction of the trend, but also serves as a valuable advisor for making decisions about entering the market or closing a position. Due to its simplicity and efficiency, Currency Master is recomme

The "No Reversal Accumatrix AI" is a cutting-edge MetaTrader 5 indicator designed to assist traders in confirming trends without the inconvenience of repainting. Built upon advanced artificial intelligence algorithms, this indicator offers a reliable tool for identifying and validating trends in financial markets. Key Features: Non-Repainting Technology : Unlike traditional indicators prone to repainting, the "No Reversal Accumatrix AI" utilizes innovative algorithms to provide accurate trend co

Do you want to know how an economic event will impact price? What will happen to price after the news? How has an economic news affected price in the past? This indicator can help you with that.
Do you like technical analysis? Do you enjoy studying the tick history to predict the future? But what do you think could be more important than technical analysis, what could improve technical analysis? Of course, it's fundamental analysis! After all, economic events directly impact the market, and t

TrendEdge Indicator
Limited-time Special Opportunity: Seize the moment! Be among the first 10 (Purchasing 1/10) to seize this unique opportunity, and not only will you acquire a top-tier trading algorithm but also enjoy an exclusive discount. Don’t delay; this could be your key to trading success with just a few clicks. Grab it now and prepare to elevate your trading experience! Note: This offer is available solely to the first 10 purchasers. Don’t mis out on this one-of-a-kind chance! Descri
Crash500 Spike Detector v1.0 Crash500 spike detector prints Down non repaint Arrow for catching crash spikes. It is suitable for 1M time frame for majorly crash500 When the Red arrow prints, it indicates high probability of crash spikes downwards. Its pretty straight forward since I designed it to follow strong trends. Use default settings, however, you can change the color of your chart background as may be appropriate. The system uses mathematical approach in to display statistical data inf

We proudly introduce the Forex Ballin Remastered trading system, your key to financial freedom. Developed by a team of experienced traders with trading experience of over 13 years . IMPORTANT! After the purchase please send me a private message to receive the installation manual and the setup instructions. Buy Forex Ballin Remastered and you could get Market Breaker, Tinga Tinga EA for free !*** Ask in private for more details.
*Promotional Price: $ 1199 . The price will increase by $ 5

MACD is probably one of the most popular technical indicators out there. When the market is trending, it actually does a pretty good job, but when the market starts consolidating and moving sideways, the MACD performs not so well. SX Impulse MACD for MT4 is available here . Impulse MACD is a modified version of MACD that works very well for trading Forex, stocks, and cryptocurrencies. It has its own unique feature which perfectly filters out the values in a moving average range and enables it
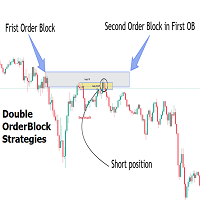
Introduction
The Price Action, styled as the "Smart Money Concept" or "SMC," was introduced by Mr. David J. Crouch in 2000 and is one of the most modern technical styles in the financial world. In financial markets, Smart Money refers to capital controlled by major market players (central banks, funds, etc.), and these traders can accurately predict market trends and achieve the highest profits.
In the "Smart Money" style, various types of "order blocks" can be traded. This indicator
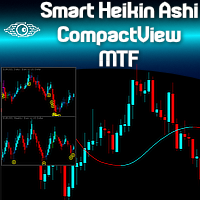
Are you already a fan of the Minions Labs Smart Heikin Ashi chart analysis tool? Or perhaps you're looking for a versatile Heikin Ashi chart capable of operating across multiple timeframes? Want to see the bigger picture before diving into the details, to make smarter ENTRY decisions? Do you want to build your own Dashboard of Symbols in just one chart, without dealing with messy multi-window MT5 stuff? Welcome to the Minions Labs Smart Heikin Ashi CompactView MTF indicator! Please see the power
With this indicator TheStrat bar numbers can be displayed above and below candles of the chart. The numbers have the following meaning: 1 = Inside Bar 2 = Directional Bar 3 = Outside Bar. In TheStrat-method there are Actionable and In-Force patterns / combos to define entries for trades. These patterns are also displayed by the indicator.
Here are the settings that can be configured: Number of lookbar bars : For how many candles in the past numbers are dislayed Color of inside bar : The color

FOTSI (Forex Overview True Strength Index) for MT5! FOTSI is an indicator that analyzes the relative strength of currencies in major Forex pairs. It aims to anticipate corrections in currency pairs following strong trends by identifying potential entry signals through overbought and oversold target areas. Theoretical Logic of Construction: Calculation of Individual Currency Momentum: FOTSI starts by calculating the momentum for each currency pair that includes a specific currency, then aggregat

The indicator illustrates the divergence between the price movements of two financial instruments, such as EURUSD and GBPUSD or US500 and US30 or Gold and Silver. These divergences are plotted in the form of segments on the price chart of the dominant instrument. The dominant instrument refers to the one that exhibits a stronger bullish trend in the case of a bullish divergence, or a stronger bearish trend in the case of a bearish divergence. Investors are encouraged to independently seek correl

The product gives optimized entries for 3min ,1 hr and day timeframes
Does well with indices ASIAN- HK50 AND CHINA A50 USA-US30,US100,US500 GER40 ,UK100 For stocks trade with the day timeframes Happy Entry employs advanced algorithms and real-time data analysis to identify optimal entry points with unprecedented accuracy. Its adaptive nature allows it to seamlessly adjust to changing market conditions, ensuring you never miss out on profitable opportunities. Whether you're a beginner or sea

This simple yet remarkably effective trend-continuation and breakout indicator acts as a powerful tool designed to aid traders in distinguishing genuine trend extensions from false breakouts. Through the utilization of a unique three-time-unit correctional phase guideline, it provides clear signals, offering trading opportunities with attractive risk-reward ratios.
Key Features Reliable Signals: The indicator confirms a genuine trend continuation or breakout if the price continues to trade h

EA + Indicator will be sent by Email. This bot generates 3%-4% daily with low risk level.
The maximun drawdown is around 35%.
Initial investment is only
100$-150$ per lot 0.01
150$-300$ per lot 0.02
300$-450$ per lot 0.03
450$-600$ per lot 0.04
and so on follwing this step
There are 2 indicators you need to install and one EA file.
This is a very safe investment on XAUUSD TF5min only.

The Supernova Momentum indicator facilitates visual perception of the price chart and reduces the time spent on analysis: the absence of a signal means the absence of a transaction, and when an opposite signal appears, it is recommended to close the current position. This arrow indicator is designed to determine the trend.
The indicator implements a trend trading strategy, provides filtering and includes all the necessary functions in one tool! Its operating principle is to automatically dete

The Ultimate Trend and Reversals Detector The Ultimate Trend and Reversals Detector is a powerful tool designed to identify potential trend reversal zones in the financial markets. Here are the key features: Objective : Detect trend directions and reversals. Signal Colors : Green : Indicates a potential bullish trend reversal. Red : Signals a potential bearish trend reversal. Non-Repainting : The indicator’s signals are not redrawn, providing reliable information. Suitable for All Styles : Scal

Using the Future Trend indicator, you can predict the future price movement a certain number of bars ahead. This indicator creates a line depicting simulated future price values, providing you with valuable information for making decisions about entering or exiting the market, and for setting or adjusting stop losses accompanying your position.
In addition, the Future Trend indicator has several parameters: HistoricBars - determines the number of historical bars that are used for analysis. Fu
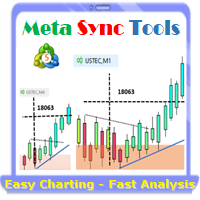
Supercharge Your MetaTrader Analysis and Trading with Meta Sync Tools! Struggling to analyze price action across different timeframes? Meta Sync Tools eliminates the frustration of unsynced crosshairs and charts, allowing seamless multi-timeframe analysis. Missing key correlations between assets and constantly switching between charts? Meta Sync Tools empowers you to visualize relationships between instruments effortlessly. Tired of wasting time on repetitive tasks? With 30+ Customizable Short

当然可以!以下是您提供的文本的中文翻译: 引入 MT4 / MT5 天文指标:您的终极天体交易伙伴 您准备好将交易体验提升到天文高度了吗?不用再寻找,就在我们的革命性 MT4 天文指标中。这个创新工具超越了传统的交易指标,利用复杂的算法提供无与伦比的天文洞察力和精确计算。 指尖上的宇宙信息: 瞻仰一个详尽的面板,展示了一宝藏般的天文数据。了解行星的地理/太阳心坐标,太阳/地球距离,亮度,伸长度,星座,黄道和赤道坐标,甚至是水平坐标——每个细节都经过精心计算并呈现得美轮美奂。指标生成的垂直线对应于时间值,为您的交易旅程提供了宇宙的视角。 行星线条与关系: 在您的图表上欣赏行星线条的魔力,具有可自定义的比例和角度。通过直观的控制面板轻松切换每个行星线条的可见性。通过连结、六分、四分、三分、对冲和逆行等指标,发现行星关系的艺术。在您选择的时间范围内探索这些宇宙构造,使您能够识别重要的交易机会。 揭示甘恩的智慧: 通过受甘恩启发的平方垂直线揭示潜在的反转时机。这种创新修改将甘恩历经考验的原则带入现实,帮助您提前了解市场的转向和趋势。 月亮引导: 在您的图表上优雅地导航月相,

Introduction
The "Smart Money Concept" transcends mere technical trading strategies; it embodies a comprehensive philosophy elucidating market dynamics. Central to this concept is the acknowledgment that influential market participants manipulate price actions, presenting challenges for retail traders.
As a "retail trader", aligning your strategy with the behavior of "Smart Money," primarily market makers, is paramount. Understanding their trading patterns, which revolve around supply
This is one of my most important indicators. Did you ever miss the session open/close? I did, which is why I made this indicator. It took a long time to get this right, since depending on your platform and timezone, it can be incorrect. It should be accurate for everyone now. It takes into account Daylight savings for NY and EU timezones, and should just work like magic on your charts.
MetaTrader市场是您可以下载免费模拟自动交易,用历史数据进行测试和优化的唯一商店。
阅读应用程序的概述和其他客户的评论,直接下载程序到您的程序端并且在购买之前测试一个自动交易。只有在MetaTrader市场可以完全免费测试应用程序。
您错过了交易机会:
- 免费交易应用程序
- 8,000+信号可供复制
- 探索金融市场的经济新闻
注册
登录