适用于MetaTrader 5的技术指标 - 51
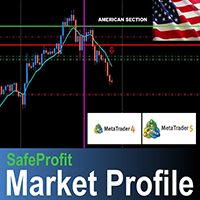
The SafeProfit Market Profile is the most advanced tracking indicator in the Forex Market. It was developed to track the market profile of each session of the day: Asian, European and American. With this indicator you will operate Intraday smiling ... knowing exactly where the Big Players are positioned and the exact moment where they are going to. The indicator is simple, fast and objective, tracking every movement of the Big Players in price. Get out of the 95% statistic that only loses and us

Setup 9.1 strategy created by the North American trader Larry Williams . SIMPLE setup, effective, with a good level of accuracy and excellent return. Attention : The Demo version only works on the tester, if you are interested in running it in real time, please contact me and I will provide another version. Buy Signal:
Exponential moving average of 9 (MME9) is falling, wait it to TURN UP (in closed candle). Place a buy stop order 1 tick above the HIGH of the candle that caused the turn to occur

Trend and Signals MT5 indicator scans 30 trading Instruments (Forex, Metals and Indices). It uses special algorithm on the current market based on Pure Price Action and display the overall trend and signal on the dashboard. When signals are produced the indicator sends alert and notification. Strategy for Signals This indicator uses the daily timeframe to determine the direction of the trend. The hourly timeframe is used to identify possible entries. Main trend and is determined by
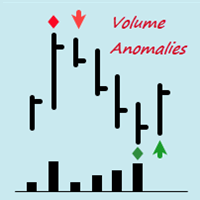
Индикатор VolumeAnomalies показывает аномальное поведение цены при увеличении объема. Эти аномалии могут привести, как минимум, к торможению и, как максимум, к развороту Рынка. Индикатор VolumeAnomalies включает в себя 3 варианта аномалий: 1. Support and Resistance - Поддержка и Сопротивление. При увеличении объема (усилия) уменьшается результат (расстояние между закрытиями баров/свечей). 2. Attenuation UP and DOWN - Затухание вверх и вниз. При увеличении объема (усилия) результат не соразмере
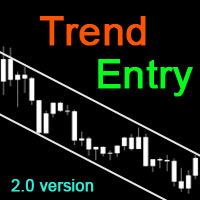
----< High Accuracy Entry Signals and Trend Indicator >----
TrendEntry could tell you the trend direction, resistance and support, when to open orders and where to set stoploss & takeprofit. this is a multifunctional indicator, can work well on all symbols and timeframes.
Features:
real-time analysis of trend direction filter out all the minor waves show resistance and support along as price goes give highly accurate entry signals frequently send alert in popup, email, notification way a

MACD divergence signals MACD称为异同移动平均线,是从双指数移动平均线发展而来的,由快的指数移动平均线(EMA12)减去慢的指数移动平均线(EMA26)得到快线DIF,再用2×(快线DIF-DIF的9日加权移动均线DEA)得到MACD柱。MACD的意义和双移动平均线基本相同, 即由快、慢均线的离散、聚合表征当前的多空状态和股价可能的发展变化趋势,但阅读起来更方便。MACD的变化代表着市场趋势的变化,不同K线级别的MACD代表当前级别周期中的买卖趋势。
1.本指标增加MACD的双线显示, 2.并且对能量柱进行4色不同的渐变 ! 3.增加MACD背离信号显示及提示
合作QQ:556024" 合作wechat:556024" 合作email:556024@qq.com"

Fractal 358 + Caixote
This 'two in one' indicator combines Caixote , a graphic pattern that defines entries, and Fractal 358 , a new way to read and forecast price movements on chart, that shows both exits and threats to operations in the mini-index (WIN) and B3 shares.
Operational Strategy
This indicator can be used with almost any asset and period, but it is more assertive with some than others. By default, it is configured for the Brazilian B3 mini-index (WIN). User can adjust only one p

Se você já ouviu falar do Método de Wyckoff, Análise de dispersão de volume, etc., com certeza chegou até aqui para buscar o indicador que lhe faltava!! Nosso indicador é capaz de lhe mostrar a dispersão de volume negociado pelos grandes players durante todo o período de negociação!
E o grande diferencial deste tipo de abordagem é a capacidade que este indicador possui de lhe mostrar onde está armado o "ACAMPAMENTO" dos BigPlayers e, assim, tirar o melhor proveito em seus trades, entrando jun
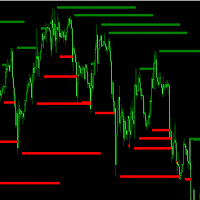
Previous High and Previous Low in the charts usually forms an area of interest for trading on the chart. Price usually move quickly then stall around these areas. This indicator identify Bars which are highest or lowest of the surrounding bars and extend a line out to visualize it. Extend line for how many bars: Define how many bars to extend the bars to the right of the extreme bar. Width of Extreme: Define how many bars it should be the highest/lowest to the left and right of the bar Keep line
The indicator displays a stock chart of a non-standard type, in which the price and time have the same value.
The usual chart of Japanese candlesticks does not take into account all the information that the time analysis can give. Renko charts do not use all the information that price can give in relation to time. The "Chart Price and Time" indicator takes into account price and time equally and shows the predominance of price or time.
Taking into account price and time equally gives an i

Speed indicator. Determines the speed of price movement. An indispensable tool for scalpers. Thanks to its high-speed qualities, we now have the opportunity to assess the current situation in the market and manage to enter a deal at the exact time. This indicator can be used absolutely on any timeframe, on any trading instrument and on absolutely any securities market. They can determine the rate of price movement for a specific period. Its settings also include an additional filter that dete

----< High Accuracy Trend Channel and Entry Signals >----
RSChannel could tell you the trend direction, resistance and support, when to open orders and where to set stoploss & takeprofit. this is a multifunctional indicator, can work well on all symbols and timeframes.
Features:
real-time analysis of trend direction filter out all the minor waves show resistance and support along as price goes give highly accurate entry signals frequently send alert in popup, email, notification way at e

----< High Accuracy Ichimoku Cloud Entry Signals >----
CloudEntry could tell you the trend direction, resistance and support, when to open orders and where to set stoploss & takeprofit. this is a multifunctional indicator, can work well on all symbols and timeframes.
Features: real-time analysis of trend direction filter out all the minor waves show resistance and support along as price goes give highly accurate entry signals frequently send alert in popup, email, notification way at every

The MaxMinTrend indicator displays the highs and lows of the price on the chart. This indicator was created to simplify the determination of trend directions, as well as to support open positions, by transferring Stoploss to the current highs and lows of the price, thereby making a large profit. This indicator is not redrawn.
Input parameters:
BarsCount - 1000 - Number of bars to draw the indicator
maxmin - true - Enabled display of Highs and Lows
line - true - Enabled display of the co
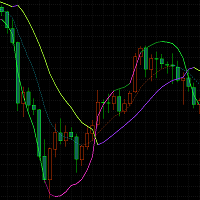
A cross - track indicator that visually shows the current bullish/bearish trend of the market through the midline (mid track), main line (upper track), and sub-lines (lower track). Intersections or upper rail turns can be used as buying and selling positions.
Parameter description: period:10 price: WEIGHTED //HIGH //LOW //OPEN //CLOSE //MEDIAN //TYPICAL //AVERAGE //WEIGHTED method:Linear weighted //Simple //Exponential //Smoothed // Linear weighted main offset:1.5 sub offset:1 base:2 counts ad

The Flat Horizontal Channel Range Price indicator automatically draws a horizontal channel (range) of prices on a higher or current timeframe. This indicator was developed to simplify the determination of sideways movements of the market, as well as to search for entry signals for a pullback from the boundaries of a channel (range) or for its breakdown.
Input parameters:
BarsCount - 1000 - Number of bars to search for a horizontal channel AutoPeriodDraw - true - Enabled automatic drawing of
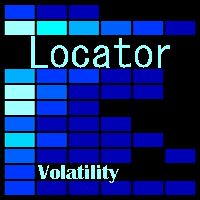
The indicator tracks sharp volatility (moments when the market has shown increased activity and movement may occur), on the selected instruments and time periods.
The information is displayed as colored rectangles. Thus, it is possible to assess at a glance which tool should be given priority attention.
The indicator will be useful for scalpers when they need a quick reaction or for traders working with a large number of instruments. The indicator does not redraw. The indicator displays 8 degr
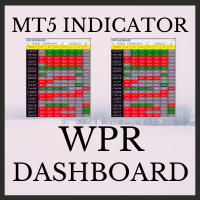
WPR Dashboard uses the value of William's Percent Range indicator. The parameters can be adjusted via the Edit boxes of this dashboard. The monitoring pairs will be selected by adding to the Market Watch (no need to set prefixes or suffixes) , you can monitor many pairs as you like. This dashboard will check almost popular time frame (M1,M5,M15,M30,H1,H4 and D1). The colors can be customized. We can have a look at many pairs and many time frames without opening the chart. In addition, we can

It is an indicator for high quality scalper signals that can be used in any timeframe.
The indicator has an alarm that can alert the trader to the trading starts, and has a proactive system that can be used to improve risk management and also to alert the trader in the trading starts.
The indicator suggests only entry point and take profit, leaving the stop loss to the trader's discretion, its recommended at the last top or bottom, or at a point in accordance with the risk management.
I
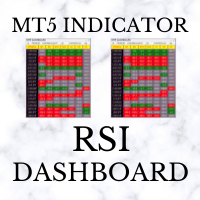
RSI Dashboard uses the value of Relative Strength Index indicator. The parameters can be adjusted via the Edit boxes of this dashboard. The monitoring pairs will be selected by adding to the Market Watch (no need to set prefixes or suffixes) , you can monitor many pairs as you like. This dashboard will check almost popular time frame (M1,M5,M15,M30,H1,H4 and D1). The colors can be customized. We can have a look at many pairs and many time frames without opening the chart. In addition, we can

One of the simplest Pivot Point indicator, easy to operate, and most complete for a single chart in determining Resistance and Support level lines.
In single chart, it will show R&S Level Line with 5 popular types of Pivot Point, Highest&Lowest of closing price Include the Trend and up to 3 Time Frames.
Five types (Floor, Woodie, Camarilla, DeMark, & Fibonacci) of popular Pivot Points in determining Resistance and Support levels. With just using simple button on th

Indicator shows buy/sell arrows depending on volatility factor. Indicator does not repaint! It works on any pair and any timeframe. It is well tested through strategy builders and shows quite interesting results as a good filter indicator and as independent signaler as well (check the screenshots). It is possible to search for a lot of interesting parameters for profitable trading, some of which are shown on the screenshots. There are next inputs in indicator settings: N-volatility period; Level

For those who need a Volume Profile / Market Profile indicator, here is the solution!
It contains the essential information:
Control Point (POC); Higher Value Area (VAH); Lower Value Area (VAL); You can choose to SHOW or NOT SHOW the volume Histogram, according to your wish. If you choose to show the histogram, note that according to the type of asset, it is necessary to adjust the scale of the indicator (last parameter of the indicator).
You can also choose from the data source of your h

6-BAND VWAP (Volume Weighted Average Price)
Fully customized and EA-friendly VWAP Bands Indicator.
Main Features:
Choose the period of VWAP calculation reset (Daily, Weekly or Monthly): For day trading use the Daily VWAP, and for longer term analysis use the Weekly or Monthly calculations. Choose how many bands (deviations) you want to show, up to 6. Choose zero to display only the main VWAP line. Fine adjustment of the deviation of the bands: Find the best band’s deviation for the in

The indicator is designed to display candles (bars) of a higher timeframe on the current one. The indicator has many settings for the displayed candles, as well as a sound signal that will sound a few minutes (seconds) before the bar closes. Input parameters: BarsCount = 50 - the number of displayed bars of the higher timeframe Auto_Candle_UP_TF = false - Automatic selection of a higher timeframe Candle_UP_TF = PERIOD_H1 - Higher timeframe, if Auto_Candle_UP_TF = false Signal_Close_Candle_UP_TF

I am placing the indicator obtained as a result of market analysis, it may be useful to someone. The indicator shows how quickly the price changes (where there is a trend), and where there is no obvious trend. With the right settings, you can know the beginning of the trend in advance.
The indicator measures the slope / rate of change / ratio of the moving average on the current bar relative to the previous bar.
The settings specify the ratio limit for a downtrend and a ratio limit for an u

I present an indicator for professionals. Prof MACD is very similar to classic MACD in appearance and its functions . However, Prof MACD is based on completely new algorithms (for example, it has only one averaging period) and is more robust, especially on small timeframes, since it filters random price walks. The classic MACD indicator (Moving Average Convergence / Divergence) is a very good indicator following the trend, based on the ratio between two moving averages, namely the EMA

自动支持和抵抗Osw MT5
该指标在选定资产的可能支撑点和阻力点绘制线。
它可以在多个时间范围内工作。
允许您配置:
线条的颜色。 线宽。 线的类型。 当指示器开始操作时,它会针对其工作的瞬时性分析较高水平的支撑和阻力。
自动支持和抵抗Osw MT5
该指标在选定资产的可能支撑点和阻力点绘制线。
它可以在多个时间范围内工作。
允许您配置:
线条的颜色。 线宽。 线的类型。 当指示器开始操作时,它会针对其工作的瞬时性分析较高水平的支撑和阻力。 自动支持和抵抗Osw MT5
该指标在选定资产的可能支撑点和阻力点绘制线。
它可以在多个时间范围内工作。
允许您配置:
线条的颜色。 线宽。 线的类型。 当指示器开始操作时,它会针对其工作的瞬时性分析较高水平的支撑和阻力。
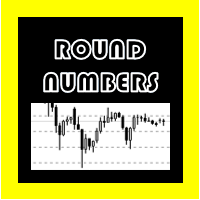
轮数(适用于MetaTrader 5)
该指标使您可以根据资产包含的整数添加水平线。
与其他指标不同,该指标会随着价格的变化自动动态地计算最接近的水平。
适用于货币对,指数,金属,股票等。
以5位数,3位数和10 100或1000的整数取整。
可以在以下参数中调整行:
隐藏您不想显示的行或整数。 线条颜色。 线的粗细。 线条样式。 轮数(适用于MetaTrader 5)
该指标使您可以根据资产包含的整数添加水平线。
与其他指标不同,该指标会随着价格的变化自动动态地计算最接近的水平。
适用于货币对,指数,金属,股票等。
以5位数,3位数和10 100或1000的整数取整。
可以在以下参数中调整行:
隐藏您不想显示的行或整数。 线条颜色。 线的粗细。 线条样式。
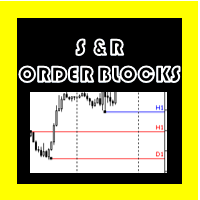
METATRADER 5的支持线和电阻+命令框
定位支撑和阻力的视觉方式更加愉悦,与普通的水平线不同,它们可以从特定点定位,而不会向后延伸,从而使图形看起来不佳,还显示了创建该临时性的名称这样,当您进行操作时,就可以知道它属于哪个临时性。
您还可以以舒适和直观的方式创建订单块,还可以查看其所属的时间性。
按以下键创建行:
“ S”键=支持
“ R”键=电阻
键“ O” =命令块
配置:
线数
支撑线的颜色 电阻线颜色 支撑线的宽度 电阻线宽度 括号线样式 电阻线样式
订单块
订单块的颜色 订单块宽度 订单块样式
METATRADER 5的支持线和电阻+命令框
定位支撑和阻力的视觉方式更加愉悦,与普通的水平线不同,它们可以从特定点定位,而不会向后延伸,从而使图形看起来不佳,还显示了创建该临时性的名称这样,当您进行操作时,就可以知道它属于哪个临时性。
您还可以以舒适和直观的方式创建订单块,还可以查看其所属的时间性。
按以下键创建行:
“ S”键=支持
“ R”键=电阻
键“ O” =命令块
配置:
线数
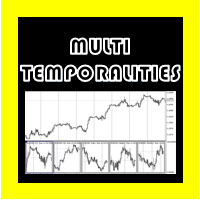
METATRADER 5的多次
该指标在下方的窗口中显示不同时间范围内的当前图表,这可以帮助您在考虑较高时间范围的情况下更好地破译市场。
您可以修改的设置包括:
图表中的价格视图 图形中的时间视图 在不同的时间启用每个图形 (M1,M5,M15,H1,H4,D1,W1,MN1)。 METATRADER 5的多次
该指标在下方的窗口中显示不同时间范围内的当前图表,这可以帮助您在考虑较高时间范围的情况下更好地破译市场。
您可以修改的设置包括:
图表中的价格视图 图形中的时间视图 在不同的时间启用每个图形 (M1,M5,M15,H1,H4,D1,W1,MN1)。 METATRADER 5的多次
该指标在下方的窗口中显示不同时间范围内的当前图表,这可以帮助您在考虑较高时间范围的情况下更好地破译市场。
您可以修改的设置包括:
图表中的价格视图 图形中的时间视图 在不同的时间启用每个图形 (M1,M5,M15,H1,H4,D1,W1,MN1)。
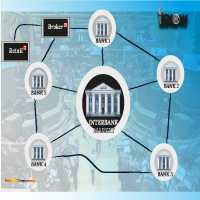
IPDA AND PD RANGES. Interbank Price Delivery Algorithm (IPDA) Range Liquidity and trades in the FX market take place in a decentralized manner as banks, brokers and electronic communication networks (ECNs) interact with one another to set prices. In FX, and ECN is a trading platform or electronic broker that hosts bids and offers and transmit them to users worldwide. ECN broadcasts a price around the world as various participants leave orders to buy and sell. Banks provide streaming prices base

The second indicator from the set for market analysis. The first one is here: https://www.mql5.com/ru/market/product/65258
The indicator draws a line by levels where the price reaches a aliquot of the value in the Step parameter. You can specify the spread of + - points from the required level.
All color settings, line types are customizable.
Example: Step - 500 Deviation - 20 If the symbol reaches the price for example 1.73500 + - 20, i.e. from 1.73480 to 1.73520, lines are being built.

The third indicator from the set for market analysis. The first one is here: https://www.mql5.com/ru/market/product/65258 The second one is here: https://www.mql5.com/ru/market/product/65347
The indicator builds a channel of maximum price fluctuations for a specified period. Additionally, the middle of the channel is drawn.
All color settings, line types are customizable.
The indicator allows you to see the picture of price movement from a slightly different angle. You can use several in

This indicator is based on a mathematical formula and an ANN combined, designed to make a model(using previous prices) of the most recent market condition (any chart*) in order to use the model as a forecasting tool. *This indicator can operate on any chart/timeframe, but it's suggested you use multiple timeframes for each trade because this method relies solely on the time factor, you can not use this indicator to predict price volatility, but if it's fit correctly it will show you when the nex
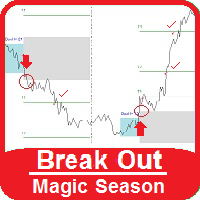
<< See how it works on YouTube >>
Possibilities:
Arrow signal to buy, sell and hit the targets Alert signal send mail Execute custom audio file The Break Out Magic indicator monitors price fluctuations over a set period of time (adjustable rectangle). Then, according to the maximum and minimum price, in the second rectangle, it determines the outline break lines. And sets 3 goals to exit from each side. In the settings we have:
Start Time: Start time of range
End Time: The end of range tim

KDJ Index 4 交易实用必备工具指标 波浪自动计算指标,通道趋势交易 完美的趋势-波浪自动计算通道计算 , MT4版本 完美的趋势-波浪自动计算通道计算 , MT5版本 本地跟单复制交易 Easy And Fast Copy , MT4版本 Easy And Fast Copy , MT5版本 本地跟单复制交易 模拟试用 Easy And Fast Copy , MT4 模拟账号运行 Easy And Fast Copy , MT5 模拟账号运行 "Cooperative QQ:556024 " "Cooperation wechat:556024" "Cooperative email:556024@qq.com" 强烈推荐趋势指标, 波浪的标准自动计算 和 波浪的标准自动计算MT5版本
KDJ指标又叫 随机指标 ,是一种相当新颖、实用的技术分析指标,它起先用于期货市场的分析,后被广泛用于股市的中短期趋势分析,是期货和股票市场上最常用的技术分析工具。 随机指标KDJ一般是用于股票分析的统计体系,根据统计学原理,通过一个特定的周期(常为9日、9周等
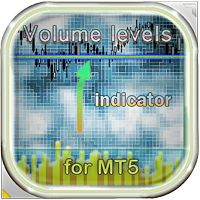
Volume Levels is a very important indicator for exchange trading . At such levels, the majority of transactions were made. In the future, the price often bounces off such levels, and this can be successfully applied in trading. This indicator is able to determine the levels at which there was the most volume over the specified period of history. These levels are shown as lines, and the parameters for determining the levels are configurable. In addition to displaying, this indicator can inform th
花生指示器
此指示器基于金色十字线,死十字线和MACD用蓝色和红色的粗线指示趋势。 您可以在参数设置(MA周期,MACD值)中自由调整数字。
因此,您可以将此指标调整为您的交易货币类型,期间等。 该指标的默认数字适用于USD / JPY M30或H1交易。
如何使用
绿线:风险,买入 红线:秋天,卖出 参数(可自定义)
MAPeriod1(短期) MAPeriod2(长期) MACDBUY_Value(MACD高于值。) MACDSELL_Value(MACD低于值。) Audible_Alerts = true或false 请下载免费的演示版,然后检查产品!
如果您需要更多功能来添加此指示器,请随时与我们联系! 我们将完全按照您想要修改此产品的方式进行工作。
惠普: btntechfx.com
电子邮件:support@btntechfx.com
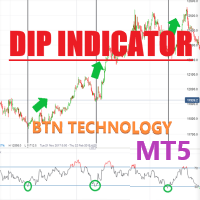
DIP Indicator Oshime DIP指示器Oshime 该指标基于Oshimegai(逢低买入)。这基于移动平均线,因此该指标指示基于长期趋势和短期趋势的线。 因此,当您进行短时交易时,此指标非常有用。因此,当您应该出售或购买仓位时,可以轻松地在 M5 或 M15 和 M30 火焰中找到。 如何使用 蓝色向上箭头-价格将上涨(您应该获得买入的位置。) *什么是Oshimegai(逢低买入)?- https://btntechfx.com/?product=what-is-oshimegaibuying-on-the-dips 参数设置(可定制) Candle_Index Audible_Alerts -------------------------------------------------- -------------------------------------------------- -------------------------------------------------- ----------------------------
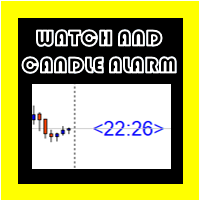
Osw METATRADER 5手表
这是一个指示器,显示了当前蜡烛在手表上到期的剩余时间,该时间始终位于价格之后的最后一根蜡烛旁边,数字与图像中的显示相同,并且可以更改大小和颜色。
您可以在以下设置之间进行设置:
显示时间的数字大小。
显示时间的数字的颜色。
同样在配置中,您可以激活和禁用,以便每次新的蜡烛开始时都会发出警报。
(别忘了检查我的其他指标) Osw METATRADER 5手表
这是一个指示器,显示了当前蜡烛在手表上到期的剩余时间,该时间始终位于价格之后的最后一根蜡烛旁边,数字与图像中的显示相同,并且可以更改大小和颜色。
您可以在以下设置之间进行设置:
显示时间的数字大小。
显示时间的数字的颜色。
同样在配置中,您可以激活和禁用,以便每次新的蜡烛开始时都会发出警报。
(别忘了检查我的其他指标)
Developed to assist in binary options retraction operations, this indicator will show the best assets to operate retractions!
How it works: The indicator will calculate the total length of each candle from low to high, the total of the body and total of shadows (up and down) and calculate a total shadows percentage of various configurable assets. The counter is updated with each new candle.
ATENTION: Demo on the estrategy tester is not functional to show other assets, but still can show how
Developed to assist in binary options retracement operations, this indicator will show the assets with the best retracement percentages!
How it works: The indicator will calculate the total length of each candle from low to high, the total of the body and total of shadows (up and down) and calculate a total shadows percentage of various configurable assets. The counter is updated with each new candle.
ATENTION: Demo on the estrategy tester is not functional to show multiple assets.

This indicator uses support and resistance, volume and some special formula to calculate the volume to filter the candles. If the volume reaches a specific value, And at the same time, Candle breaks the support/resistance line, There would be a signal and we can enter the market. Signals appear when the current candle closes. then you can enter the trade when a new candle appears. Please don't forget to follow your money management plan.
MT4 Version Support/Resistance Breakout MT4 : https

The Fúria indicator was developed to work when the market is in trend, that is, you will rarely see any signs in consolidation zones. It can be used for both Forex and Binary Options.
The signs plotted on the graph do not repaint or recalculate, even if you close and reopen your MT4 / MT5 they will be there.
Wait for the signal to set on the candle before you can enter the next candle.
==================================================
* BUFFERS: 0 (CALL) and 1 (PUT); * TYPE OF ENTRY: n

Looking for reliable levels on a price chart? Already tired of searching for similar indicators? Are the levels not working out as they should? Then this is the indicator for you.
Volume Prices Universal is a reliable indicator of horizontal volumes. What does it show? First of all, the main idea of the indicator is to display at which price mark the price has been for the longest time. Thus, the display of price volumes on the price chart is formed. With the help of which you can very simp

订单块的个人实现,一种简单而有效的头寸交易策略。如果价格范围没有在与突破相反的方向突破,则交易者应进入市场或在最后一个订单块的方向上寻找交易。为清楚起见,未绘制开放块。
[ 安装指南 | 更新指南 | 故障排除 | 常见问题 | 所有产品 ] 一个看涨的开盘是在一个新的市场低点之后的第一个看涨柱 一个看跌的开盘是在一个新的市场高点之后的第一个看跌柱 当打开的块被破坏时出现信号,成为订单块 当一个订单块被打破到相反的一侧时,它就变成了一个反转块 该指标实施各种警报 它不会重新粉刷或重新粉刷
输入参数 周期:创建新高或新低所需的柱线数量。较小的值会产生更多的信号。
最小 ATR 过滤器:订单块的最小主体尺寸,表示为 ATR 的乘数。 Max ATR Filter:订单块的最大主体尺寸,表示为 ATR 的乘数。
颜色:设置线条和箭头的颜色和大小。
警报:启用显示/电子邮件/推送/声音警报。
支持和问题
使用帮助台解决问题或及时获得支持。写一封电子邮件至:help@pointzero-trading.com。
作者 Arturo López Pérez,私人投资者

Mr Crypto Magic Lines is an indicator that draws very strong support and resistance lines, in which the price respects and changes its direction of movement. The generated signals can be used for trend or scalper operations. The indicator adapts to any financial asset and the desired graphic time as it considers the ATR indicator to measure volatility and identify trading signals.
It is possible to trade Forex, stocks, crypto, indices and any other assets on the metatrader
The configurati

VR Cub 这是获得高质量切入点的指标。该指标的开发是为了促进数学计算并简化对仓位入场点的搜索。多年来,该指标所针对的交易策略已被证明其有效性。交易策略的简单性是其巨大的优势,即使是新手交易者也能成功进行交易。 VR Cub 计算开仓点以及获利和止损目标水平,这显着提高了效率和易用性。查看使用以下策略进行交易的屏幕截图,了解简单的交易规则。 设置、设置文件、演示版本、说明、问题解决,可以从以下位置获取 [博客]
您可以在以下位置阅读或撰写评论 [关联]
版本为 [MetaTrader 4] 计算入场点的规则 开仓 要计算入场点,您需要将 VR Cub 工具从最后一个高点拉伸到最后一个低点。 如果第一个点在时间上早于第二个点,交易者等待柱线收于中线上方。 如果第一个点在时间上晚于第二个点,交易者等待柱线收于中线下方。 根据上述条件,严格在 柱线收盘 后建仓。 换句话说,如果我们在小时图上进行交易,那么从最高点到最低点的时间距离必须超过24小时,最高点和最低点之间的点数必须大于或等于平均价格变动每天。 维持和改变市场地位 可以有多个未平仓头寸;每个头寸都可以单独修改。 VR Cu
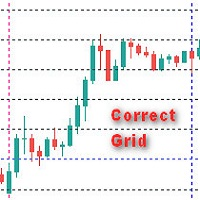
Общие сведения Индикатор отображает правильную сетку с задаваемым в параметрах шага в пунктах , что позволяет более точно визуально оценить масштаб и размер ценовых движений. Параметры индикатора
Step - шаг сетки в пунктах по вертикали Figure - шаг фигуры MaxBars - ограничение истории (0 - вся история)
Цвет вертикальных лини color new_day - Цвет новый день new_week - Цвет новая неделя new_mon - Цвет новый месяц
Цвет горизонтальных линий new_Hfigure - Цвет

Looking for reliable levels on a price chart? Already tired of searching for similar indicators? Are the levels NOT working out as they should? Then this is the indicator for you.
VPU Levels is a more advanced version of the Volume Prices Universal indicator. In this indicator, in addition to the histogram of horizontal volumes, the indicator itself determines the levels from which the user can work. The PeakLevel and Diffraction fields help to adjust the depth of reaction to the histogram an

SupportResistance是一个动态支 撑和阻力指标,基于先前蜡烛的高点和低点。
计算参数是可配置的。 您可以使用前一支蜡烛的最大值和最小值作为参考,也可以使用一组前一支蜡烛的最大值和最小值。
指标使用红线表示阻力,绿线表示支撑。
当支撑或阻力破损时,其线将被点缀,仅在再次变得相关时才恢复。
支撑或阻力突破后,一旦到达相反的线,便会在最后一个有效值处找到新的支撑或阻力。
在历史最高或最低的情况下,将没有有效的支撑线或阻力线。
SupportResistance是一个动态支 撑和阻力指标,基于先前蜡烛的高点和低点。
计算参数是可配置的。 您可以使用前一支蜡烛的最大值和最小值作为参考,也可以使用一组前一支蜡烛的最大值和最小值。
指标使用红线表示阻力,绿线表示支撑。
当支撑或阻力破损时,其线将被点缀,仅在再次变得相关时才恢复。
支撑或阻力突破后,一旦到达相反的线,便会在最后一个有效值处找到新的支撑或阻力。
在历史最高或最低的情况下,将没有有效的支撑线或阻力线。

This is a multi timeframe version of the Supply and Demand indicator . It allows you to analyze a chart using the law of supply and demand on three different timeframes at a time. You will see zones of sales and purchases and determine the most profitable points to open positions. The indicator is based on the principle of market fractality. Supply and demand zones show places where a strong buyer or seller has made the price reverse and change its direction. The indicator has several types of
This indicator show several candle patterns. Very useful to learn and to trading some stocks or forex.
The supported patterns are: bullish spinning top, bearish spinning top, bullish marubozu, bullish force, bearish marubozu, bearish force, bullish kicker, bearish kicker, bullish engulfing, bearish engulfing, bullish harami, bearish harami, piercing line, dark cloud cover, morningstar, evening star, bearish abandoned baby, bullish abandoned baby, three white soldiers, three black soldiers, mo

This indicator marks the relevant volume levels among the day. The two relevant levels are the candle with more volume and the period with more volume of lots transacted.
The filled red background is the range of price with the most relevant volume of the day (probably the big player that is command the game). The purple lines shows the range of price with most volume (probably a area where some big player is accumulating before force a market direction). There is also the dot lines that mark

This indicator shows the candles with the highest volume in the market, based on a period and above-average growth percentage. It is also possible to activate the "Show in-depth analysis" functionality that uses algorithms to paint the candles with the probably market direction instead of painting based on the opening and closing positions.
EA programmers: This indicator does not redraw.
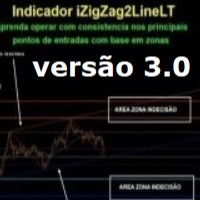
- iZigZag2LineLT
New version 3.0 of the iZigZag2LineLT indicator where it is possible to search for possible exhaustion regions of the market looking for small or large reversals, it follows the same characteristics contained in the indicator of the LTB and LTA lines, Fibonacci, Supports and Resistances with the application of Market Undecided zones (improved version of Stop or Move by Sato´s), in these areas suggestions (through the dotted lines) appear to include pending orders always looki
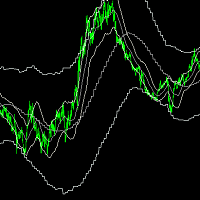
inp_timeframe: Set Timeframe of indicator MA Parameters: (Same as standard moving average indicator) inp_MA_period, inp_MA_shift, inp_MA_method, inp_MA_price: Moving Average Period, Moving Average Shift, Moving Average Method, Moving Average Price Please take note that using a MA_shift of 0 will result in a different result when the indicator is reloaded for higher time frame This indicator only accepts shift>0 This is due to the indicator showing the current time moving average and atr at the c
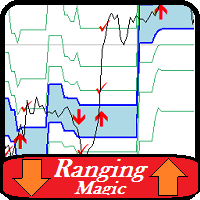
This is a powerful indicator that is very easy to work with. Its default setting is for the euro-dollar pair, but with the right settings it can be used in all markets and all time frames less than daily. The basis of the work of the Ranging indicator is to find areas of price range and get signals from it. You can specify the duration of the valid sufferings and the minimum and maximum price in it. It is also possible to determine the number of reliable signals received from each range.
Othe
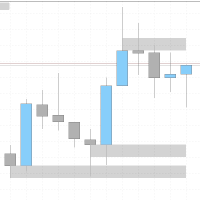
I created an indicator inspired by the "Wicks don´t lie" community on Youtube. It let's you see zones from other timeframes, and lets you keep a zone from a higher timeframe when you go to lower time frames. It operates by creating zones wherever the price has previously turned and not been retested again. This makes it easier to know where to expect a possible hick-up while going with a breakout, or where the price might make a reversal. The indicator also continues to add zones out from the cu
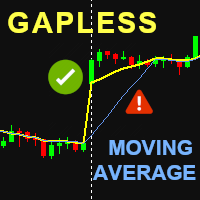
Gapless Moving Average (GMA)
Improved version of standard Moving Average (MA) from MetaTrader library which provides the possibility to eliminate the 'gaps' between candle sticks which distort the average values mainly during the N ('period') initial candles after market opens due to the spread ('gap') between closing price from previous day and opening price from the next day. The greater these 'gaps' are, the more divergent the standard MA is in order to indicate the current price trend

Complete indicator that collects all results from your MT5 trading account. It a ggregates your past trading performance , displays historical price ranges. It also shows key market information, like swaps, current market spread on chosen instrument, floating P&L, number of trades, drowdown etc. Check out the below video presentation.
If you are interested in more of my products, do not hesitate to PM me.

//////////////////////////////////// // /////////////////////////////////////////// /////////////////////////////////
Go My Way是趋势方向或价格走势的超精确指标。
该指标是在其他十二个指标的基础上计算的,并且具有非常复杂的机制。
//////////////////////////////////// // ////////////////////////////////////////// /////////////////////////////////
设置非常简单,但是强烈建议保留它们不变,这在大多数情况下都适用于所有时间范围。
使用此指标,您将始终准确地知道价格走势的方向。
该指标的读数已通过特殊的数学公式精心过滤,以同时滤除噪声并具有最小的延迟。
//////////////////////////////////// // ////////////////////////////////////////// /////

This indicator plots in the candles the divergence found in the selected indicator and can also send a notification by email and / or to the cell phone.
Works on all TIMEFRAMES. Meet Our Products
He identifies the divergences in the indicators:
Relative Strength Index (RSI); Moving Average Convergence and Divergence (MACD); Volume Balance (OBV) and;. iStochastic Stochastic Oscillator (STOCHASTIC).
It is possible to choose the amplitude for checking the divergence and the indicator has
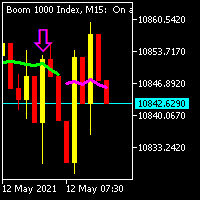
trade boom and crash with trend arrows no repaint arrows direction of use if you buy boom stoploss below arrow if you sell crash stoploss above arrow
please note that you need to follow trend to have perfect trades only use on m15 allow candles to close before taking trades please make sure you find this indicator useful as it has a 80% win rate on m15 h1 and h4 make good trades


This is the spike indicator , determining the highest high and lowest lows of price in the given period , it is also a zigzag indicator , to it may recalculate the values or repaint if a new higher high or lower low forms in that given period,so beware How ever the indicator can be very powerful when used with other technical indicators for entry confirmation Be sure to check out some of my other premium products

Stochastic: It was developed by George Lane in the early 1950s. It is based on the principle that the price closes close to the maximum if the asset is on an uptrend, and close to the minimum if it is on a downtrend. Following the idea of the inercial movement of prices. This indicator can generate possible signals of overbought moments or about asset sales. In a usual way it can used according to some standards;
Slow Stochastic: A moving average of 3 periods is calculated on the stochastic i

Buy and sell signals based on the Reversal Closing Price Setup for trend continuation, created by Stormer.
How does it work? The indicator activates the buy signal when we have a low below the 2 previous lows and a close above the previous close.
For a sell signal we need a high above the 2 previous highs and a close below the previous close.
How to use it? One way of using it, as suggested by Stormer, is to enter the trade with a buy stop order one tick above the high of the candle w

The Alligator indicator uses three smoothed moving averages, set at five, eight, and 13 periods, which are all Fibonacci numbers. The initial smoothed average is calculated with a simple moving average (SMA), adding additional smoothed averages that slow down indicator turns. Scan all your favorite pairs with Alligator, and get notified on your preferred time frames.
Setting is Customizable
Click to change time frame or open new pairs
Notification: Phone/Popup/Email
学习如何在MetaTrader AppStore上购买EA交易,MetaTrader平台的应用程序商店。
MQL5.community支付系统支持通过PayPay、银行卡和热门付款系统进行交易。为更好的客户体验我们强烈建议您在购买前测试EA交易。
您错过了交易机会:
- 免费交易应用程序
- 8,000+信号可供复制
- 探索金融市场的经济新闻
注册
登录