MetaTrader 5용 기술 지표 - 27

The professional tool of stock traders in now available on MetaTrader 5 . The Actual depth of market chart indicator visualizes the depth of market in the form of a histogram displayed on a chart, which refreshes in the real-time mode. Meet new updates according to user requests!
Now Actual Depth of Market indicator displays the current ratio of volume of buy and sell requests (B/S ratio). It shows the share of volume of each type of requests in the entire flow of requests as well as the absol

This indicator is a basic RSI but comes up with a useful feature.
You can set zones within the RSI and these zones can be displayed with different background colours. (You can see on the pictures below) You need to set the zone ranges and their colours at the input parameters. Six different zones can be set.
Should you have any questions or comments, feel free to contact me.
FREE

많은 사람들이 헤지를 통해 거래하는데, 예를 들어 여러 유로스를 하는 동시에 gbpusd를 공매하는 것도 있지만, 많은 사람들은 서로 관련된 두 품종의 실제 가격 차이를 정확하게 계산할 수 있는 전문적인 계량화가 부족하다.맑은 바람 헤지 지표는 완벽한 솔루션을 제공 두 관련 품종의 수십 년 실제 가격 차이를 볼 수 있습니다.
전에 없던 방식으로 완전히 독창적이고 혁신적이다.
상관성이 있는 임의의 2개 품종을 동원하여 그 수십년의 실제가격차 지어는 1분간의 실제가격차를 계산하는것을 허용한다.례하면 eurusd-gbpusd, eurusd-audusd, eurcad-gbpcad, xaueur-xaugbp, audusd-nzdusd, audjpy-nzdjpy 등이다.
두 품종의 가격추세가 일정한 상관성이 있고 등락추세가 같다면이 지표를 리용하여 진실한 가격차를 정확하게 계산할수 있다.
자동화차익거래나 수동차익거래에 있어서 그 의의는 매우 중대하다.
현실가격차액계산은 모든
FREE

The Indicator indicator draws 2 clouds based on Donchian Channels indicator values. The upper cloud is formed by the upper lines values and the lower cloud by the lowers lines values. The indicator allows to change the Channels parameters and the clouds colors the period of the base line and the multiplier of each Donchian Channels instance. The indicator holds 5 buffer index as follow: [0] - Outer values of the upper cloud [1] - Inner values of the upper cloud [2] - Base/Center line values [3
FREE

The RFOC Symbol Background was created to display the name of the asset and the current timeframe in the background of the chart.
Displaying the name of the asset at the bottom of the chart is often used by traders who are designing the screen for spectators, making it easier to identify the asset and the timeframe during a class, for example.
It is available for the user to select the font size (small, medium or large) and select the color for better viewing according to the background colo
FREE

This is an OLD indicator which was rather efficient to be paired with MA Cross, Bollinger Bands, Dochian Channel and many other strategies and this provides you with market change of BEAR and BULL trends. Since there isn't much listed in MT5 Market, I would like to share my very own indicator for your usage. Please feel free to comment or criticize for better and improvement of the indicator listed.
FREE

This Oscillator describes the drift of an asset, as part of the geometric Brownian Motion (GBM). As a data basis the mean reverting log returns of the asset price is considered. It gives the percentile of drift directional. For instance, a value of 0.05 means a drift of 5%, based on the selected sample size. If the value is positive, drift to higher asset values is determined.
This indicator should be used in confluence with other indicators based on volatility, probability and statistics. L
FREE

Advanced Trend Builder is a trend indicator using the original calculation algorithm. ATB can be used on any data and timeframe. My recommendation use for calculation numbers 4 - 16 - 64 - 256 and so on ..., but this is only recommendation. The middle of the trend wave is a special place where market behavior is different, when developed ATB was main idea to find the middle of the wave trend. Input parameters: Bars will be used for calculation - number of bars used for a trend line calculation.
FREE

RUBFX Trend histo mt5 , indicator works on synthetic indices, Currencies , Indices ,Stocks Gold etc , good for follwoing trend on the markets suitable for scalping Buy Rules; When the histo changes to Blue you place buy order ,stop loss just below the previous swing low Sell Rules; When the histo changes to Red you place sell order ,stop loss just below the previous swing high Trade on a timeframe which best suits your trading style

FRB Sell Agression - Indicator shows the Sell Agression Balance of the TIMEFRAMES chosen by the user through a histogram in a new window. - This indicator can only be used if the broker provides data on Volumes. Forex market brokers do not report this data. - B3 (Bovespa - Brazil) informs the data and with that it is possible to use it in Brazilian brokerages.
Settings Color - Define the color that will be shown in the histogram. Use Historical Data - Defines whether the indicator will calc
FREE

Introducing the “Symbol Cost Info MT5” indicator – your ultimate tool for staying ahead in the forex market! This innovative indicator is designed to empower traders with real-time cost information, directly on their charts. Here’s why every trader needs the “Symbol Cost Info MT5” in their arsenal: Real-Time Spread Monitoring : Keep a close eye on the spread for any currency pair, ensuring you enter the market at the most cost-effective times. Pip Value at Your Fingertips : Instantly know the v
FREE

The indicator shows the current spread of the symbol, the minimum, average and maximum values for the current bar in the form of digital, analog and graphic indicators. Has two modes of operation: fixing the system spread, or calculating the spread as the difference between the "Bid" and "Ask" prices on each incoming tick. Parameters The indicator has a single input parameter: Type of calculation - type of spread calculation. It can take the following values: System spread - the spread value
FREE

The indicator ColorCandlesDaily draw candles with different colors depending on the day of the week.
FREE

Modified and updated RSI indicator. Please use arrows on the chart to enter to deals and to exit from deals. The indicator is designed for all currency pairs and time-frames.
Parameters:
PeriodRSI - indicator period;
OpenLevel - level for entering to deals (range diapason 0-100);
CloseLevel - level for exiting from deals (range diapason 0-100);
FlatMode - please enable this trigger in flat mode (i.e. if there are no determined trends).
FREE

BeST_Trend Exploiter is a Metatrader Indicator based on a smart proprietary algorithm which can detect the market Median Trend while it filters out the noise providing Buy and Sell Signals and also wherever it is applicable it provides us with TP Levels of High Probability. Additionally as it has Built Inside all the necessary features it can be used as a Complete Strategy of very Impressive Results. Essential Advantages of the Indicator
Clear and Easily Understandable trading rules. Real

The Volume Heatmap indicator visually shows the INTENSITY of the volume taking into account the concept of standard deviation. Purpose of the Indicator: High volumes are common where there is a strong consensus that prices will increase. An increase in volume often occurs at the beginning of a new upward trend in the price of an asset. Some technical analysts do not rely on trend confirmations without a significant increase in volume. Low volumes usually occur when an asset is heading for a down
FREE
A professional tool for trading - the divergence indicator between the AC and the price, which allows you to receive a signal about a trend reversal in a timely manner or catch price pullback movements (depending on the settings). The indicator settings allow you to adjust the strength of the divergence due to the angle of the AC peaks and the percentage change in price, which makes it possible to fine-tune the signal strength. The indicator code is optimized and is tested very quickly as part
FREE
Equalizer MT5 is a trend indicator that can be used as: trend filter tigger entry trailing stop Trend filter : with blue histogram we have bull market; with red histogram we have bear market and; with gray histogram we have consolidated market. The tigger : with the increase in the size of the histogram bars we can have possible entry points into a trend. The trailing stop : in a trend, when the size of the histogram bars increases we can move the stop loss to the price bar corresponding to the
FREE

The indicator converts two moving averages into histograms and paints their intersection area.
There is a shift trick setting, it is used to smooth the result of calculations. You can see the changes if you reduce this parameter to 1 (minimum value).
Available averages:
MA Simple MA Exponential MA LinearWeighted MA Smoothed DEMA TEMA and
RSI - as a bonus By default, the fast MA is displayed at the top of the histogram, and the slow one at the bottom. You can swap them if you like.
shi
FREE

This is a multi-timeframe indicator that detects and displays support and resistance (S&R) lines using the ZigZag indicator.
Features
The support and resistance lines are not redrawing. The indicator is capable of adding new support and resistance levels as they appear. Each S&R line has a tooltip that displays the price level and start time. Shows the start time, price level and number of touches of all S&R lines when pressing the shortcut Shift+I Save time for multi-timeframe analysis on

Triple Exponential Moving Average (TRIX) It is a strong technical analysis tool. It can help investors determine price momentum and identify oversold and overbought signals in a financial asset.
Advantages of having an indicator like TRIX.
One of the main advantages of TRIX over other trend-following indicators is its excellent filtering of market noise and its tendency to be an early rather than late indicator.
To aid in the operations, a coloring was configured to facilitate the identif
FREE

Highly configurable Rate of Change (ROC) indicator. Features: Highly customizable alert functions (at levels, crosses, direction changes via email, push, sound, popup) Multi timeframe ability Color customization (at levels, crosses, direction changes) Linear interpolation and histogram mode options Works on strategy tester in multi timeframe mode (at weekend without ticks also) Adjustable Levels Parameters:
ROC Timeframe: You can set the current or a higher timeframes for ROC. ROC Bar Shift:
FREE

This indicator looks for 3 rather strong patterns: Spinning Top pattern Hammer or Hanging Man Inverted Hammer or Shooting Star These patterns may indicate a trend continuation or its reversal, depending on the location of the patterns.
Input parameters Distance - distance between the signal and the formed signal Note: the higher the timeframe, the greater the value should be used in Distance to display the signal correctly
Indicator Features Suitable for any currency pair Operating timeframe
FREE

Breakouts with strong momentum are challenging to catch. The purpose of the Super Breakouts Monitor is to identify such market conditions. This indicator is inspired by a concept from renowned Technical Analyst Tushar Chande, who combines two highly adaptive indicators, VIDYA and the Dynamic Momentum Index (both his creations), to capture the early stages of a successful breakout. At Minions Labs, we've added our unique enhancements to adapt these great ideas for modern markets like stocks, cryp

Highly configurable Momentum indicator.
Features: Highly customizable alert functions (at levels, crosses, direction changes via email, push, sound, popup) Multi timeframe ability Color customization (at levels, crosses, direction changes) Linear interpolation and histogram mode options Works on strategy tester in multi timeframe mode (at weekend without ticks also) Adjustable Levels Parameters:
Momentum Timeframe: You can set the lower/higher timeframes for Momentum. Momentum Bar Shift:
FREE

i-Orders is a simple indicator to monitor your own trade/analyze others' trades. I use it for a long time and do not imagine a chart without these arrows, lines and trade result numbers. The features allow you to: change the size and location of the control buttons ( Control buttons size , Control buttons corner ), disable display of opened and closed positions ( Show OPENED , Show CLOSED , Show PENDING ), change colors of arrows and lines for profitable and unprofitable buy and sell positions s

Fibonacci and RSI.
Demo versión only works with GBPUSD. For full version, please, visit visit https://www.mql5.com/en/market/product/52101
The indicator is a combination of the Fibonacci and RSI indicators.
Every time the price touches one of the fibonacci levels and the rsi condition is met, an audible alert and a text alert are generated.
Parameters number_of_candles : It is the number of candles that will be calculated. If you put 100, the indicator will give you the maximum and min
FREE

The MWC COX indicator shows the extreme zones of net short/long positions of the Commitments of Traders Report released by the CFTC once a week for four periods of time. Default settings are periods of 12, 26, 52 and 156 weeks.
Additional Features Displays the sum of all 4 periods in one line MA, MOM and RSI indicators are integrated ( not in the MQL5 Version 1.0 ) Please make sure that you download the MWC_Demo.zip file and unpack it into [...]/MQL5/Files folder. -> www.myweeklycot.com/
FREE

One of the simplest Pivot Point indicator, easy to operate, and most complete for a single chart in determining Resistance and Support level lines.
In single chart, it will show R&S Level Line with 5 popular types of Pivot Point, Highest&Lowest of closing price Include the Trend and up to 3 Time Frames.
Five types (Floor, Woodie, Camarilla, DeMark, & Fibonacci) of popular Pivot Points in determining Resistance and Support levels. With just using simple button on th
FREE

Scalp using the behavior of a short moving average, the indicator gives the slope and identifies the "hyper" moments.
Operational advice:
Use M1 chart. Period 20 : open buy after two rising lows; sell after two max downhill; avoid countertrend openings; when the line goes flat put a stop at the opening price. Avoid actions in low volatility timeslots. When the curve that draws the min / max is very flat, it is better to postpone at least 15'.
Period 50 : matches the trend, when it is
FREE
This is an arbitrage indicator. The indicator displays the chart of an arbitrary combination of trading instruments, described by the entered arithmetic formula. Using the indicator. Add an indicator to any chart. Enter the formula as a string in the indicator's parameters. All symbols used in the formula must exactly match the names in the table "Market Overview" of the terminal. Example of the formula: (SIBN + SNGS) / 'RTS-3.19' + 2.5 * GAZP / LKOH Start the indicator The formula must meet the
FREE

Что такое RSI? Индикатор RSI (Relative Strength Index, индекс относительной силы) — это индикатор, который измеряет соотношение восходящих и нисходящих движений. Расчет ведётся таким образом, что индекс выражается в диапазоне от 0 до 100. Как понять RSI?
Если значение RSI находится равно 70 и больше, считается, что инструмент находится в состоянии перекупленности (ситуация, когда цены выросли выше, нежели того ожидал рынок). Значение RSI на уровне 30 и ниже считается сигналом о том, что инст
FREE

Description by chatGPT:
In the dance of flames, a candle transforms,
From the close of old, a new light is born.
A derivative of candles, changing forms,
Unveiling secrets in the flickering morn.
Like indicators, patterns do precede,
On charts of price, where future paths are sown.
The candle's dance, a signal to take heed,
Foretelling tales in fiery lines shown.
I trust the candlemakers to discern,
Using indicators as their guiding light.
In every flame, a lesson to be learned,
FREE

Free version of https://www.mql5.com/en/market/product/44815 Simple indicator to calculate profit on fibonacci retracement levels with fixed lot size, or calculate lot size on fibonacci levels with fixed profit. Add to chart and move trend line to set the fibonacci retracement levels. Works similar as default fibonacci retracement line study in Metatrader. Inputs Fixed - select what value will be fix, lot or profit (available in full version, lot is set on free version) Fixed value - value tha
FREE

The indicator draws two simple moving averages using High and Low prices. The MA_High line is displayed when the moving average is directed downwards. It can be used for setting a stop order for a sell position. The MA_Low line is displayed when the moving average is directed upwards. It can be used for setting a stop order for a buy position. The indicator is used in the TrailingStop Expert Advisor. Parameters Period - period of calculation of the moving average. Deviation - rate of convergence
FREE
Linear regression AI powered Indicator: Linear regression is a simple yet effective AI technique that is the foundation of complex neural networks, This indicator is built based on linear regression analysis and tries to make predictions on the upcoming event in the market Inputs : train_bars: This controls the number of bars that the price information will be collected and used to train the AI inside it, The greater this value the better also the slower the indicator becomes during initializati

A unique professional tool is a divergence/convergence indicator between AC and price, which allows you to receive a signal about a trend reversal in a timely manner or catch price pullback movements (depending on the settings). It is indispensable for those who trade divergences manually or with an Expert Advisor. The indicator settings allow you to adjust the strength of the divergence /convergence due to the angle of the AC peaks and the percentage change in price, which makes it possible to
FREE


This is a rate of change chart from the baseline. features. comparison of max 5 symbols. free baseline with drag. free timeframes of the sub window. reverse chart selectable if you need.
i.e. set symbols "-US100" notes In the sub window, you can't believe datetime on the chart, because the numbers of bars are different. You can check the baseline if you click symbol name. The dragged baseline is temporary. You must set it to indicator's parameter if you need.
FREE

DETECT THE TREND AND THE BEST PRICE TO ENTER A TRADE
Trend Detection for perfect entry - Distinguish the direction of thetrend and its strength, showing a line of different colors depending on whether the trend is strong bullish, weak bullish, strong bearish or weak bearish.- Best Entry point for perfect entry - Shows an area with the best entry in favor of trend. Never trade against the trend again.
Entry signals and alerts - When the price is in a valid zone, it sends pop up alerts, teleph

This indicator draws price channels. Easy to use. It has various settings, for example, you can configure it to show channels only for buy or sell, you can display trend lines instead of channels. There are many trading strategies that are based on trading in channels, you can trade on the rebound from the borders of the channels, or the breakdown of the channel. Parameters History - the maximum number of bars for building channels; Distance - the minimum distance from one maximum (or minimum

ALPS is a multi timeframes trend and momentum indicator that lets your profits run . It combines Gator Oscillator, ADX and RSI over multi timeframes in an innovative way. You can trade with full confidence on a rapid timeframe chart with insight and benefits of trend and momentum over a larger timeframe. To keep the chart clear and comprehensible, you can toggle any timeframe ON/OFF instantly at any time point. Different color trend bars mark slow, normal or strong trend based on ADX. Overbought
FREE

Weiss Wave with lots of functionality and lightweight. The same can be used both in markets that have access to volume (REAL=Contracts, Tick=Business) or points!
You will be able to:
- Analyze the volume of the market by swings made!
- Define the source of the data presented in the graphic, its size and color! Or simply hide this information!
- Define whether or not to show the swings in the graph and how many swings! In addition to setting the trend line color, thi

Several techniques use volume as an important point in the trade. Whether to indicate strength, exhaustion, pullback weakness, among others.
In chief I quote Richard Wyckoff's theory, which said about the importance of looking price and volume.
However, there are several possibilities to filter what is volume that should be noticed.
PVRSA/PVA users use an indicator with specific colors, which assist in identifying the volume and type of movement that the price has made.
Will the high
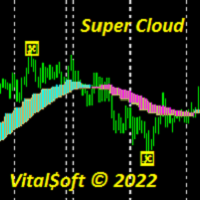
The Super Cloud indicator helps to determine the direction of the trend when trading. Shows on the chart signals about a possible upcoming trend change. The indicator provides an opportunity to detect various features and patterns in price dynamics that are invisible to the naked eye. Based on this information, traders can anticipate further price movement and adjust their strategy accordingly. Works on all timeframes except MN.

Do you like trade Technical Analysis like I do? Then you will like this indicator, because it automatically calculates the support and resistance of the asset in simultaneous timeframes, or the famous MTF (Multi Time Frame). In addition to support and resistance, it is possible to have alert signals when the price breaks or touches (or both). Its configuration is very simple. The visual is fully configurable. Enjoy it!
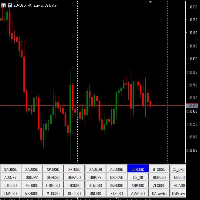
"Symbol Changer" is an indicator created for the Metatrader 5 (MT5) platform, providing the ability to change symbols. To perform all operations with this indicator, use the following characteristics:
Characteristics: Installation: To install the indicator on the MT5 platform, place your .mq5 code in the Indicators folder and restart MT5. Visualization: On the chart, the "Symbol Changer" indicator places special buttons to change symbols. Initial Settings: There are no additional settings for

The best quality application of the famous Super Trend indicator that requires no introduction. It is completely faithful to the original algorithm and powered by the CCI indicator.
- easy to trade - It implements all kinds of warnings. - It implements a multi-timezone dashboard. - It cannot be repainted or backpainted.
Input parameters - ATR Period – This is the average true range period. - ATR Multiplier - The ATR multiplier that defines the trend. - CCI - Makes trend following powerful. -
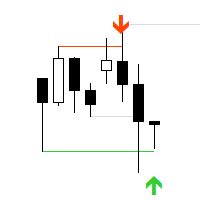
"AV Stop Hunter MT5" is an indicator for MetaTrader 5, which draws entry arrows for long and short after so-called Stop Hunt candles and has several notifications about them. Since this is a smart money concept , the periods H1 and H4 are the best. Increasing volume improves the signal, lines and arrows are then thicker. The MQL5 variant has colored stop-hunting candles. NEW: Signal Buffer: 1, 0 or -1
Definition :
Stop hunting, also known as stop running, is the practice of institutional

The principle of construction - on top of any number of bars set by the user, a channel is constructed with maximum and minimum lines so that the bars touch the maximum and minimum of the channel at exactly three points. The name of the indicator follows from this principle. Both vertical lines can be moved along the graph by the user, thus specifying the period on which the channel is built. After a specified period, channel rays are drawn that define a channel in which the price can move.

Created by trader and journalist Larry Williams, Setup 9.1 is a simple strategy that is easy to understand and execute, which is why it is so well known and popular in the world of traders and technical analysis. It is a REVERSION setup, where operations are sought when the moving average changes direction.
Setup Logic
With the open candlestick chart, at any time chart, it is only necessary to add the 9-period Exponential Moving Average (MME9). That done, we look for assets in which the MME

If you consider the extremes of the daily price as important points, this indicator will help in your trades.
Now, instead of manually drawing lines that mark daily highs and lows, you can use the O (HL) ² C Lines indicator.
Thus, the OHLC Lines indicator automatically plots the lines O (Open for the current day), H (High for the current day), L (Low for the current day) and C (Close for the previous day). Plot also the high and low of the previous day.
Thus, we have 4 static lines

This indicator will draw a label above or below each candle based on Rob Smith's The Strat as they develop over time on your chart.
As price evolves, a candle can switch between three states. When the candle first opens, if it sits completely within the previous candles high and low, then it will start as a Type 1. As time moves on, if it breaks either the high or low of the previous candle, it will be come a type 2, and should the price action be volatile and directionless, it may then
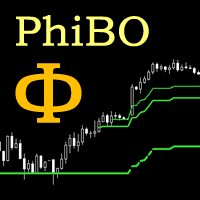
Indicador PHIBO da metodologia PhiCube. Se comporta exatamente como o utilizado pelo Bo Williams em seus videos e estratégias. Quando o preço está sobre, ou abaixo, das três linhas, isso indica que há uma forte tendência. Quando não estão alinhadas, podem indicar suportes, resistências e alvos. Se aparecerem após um longo movimento já esticado, podem indicar que o movimento está terminando.

To calculate strength of currencies and to show in table There is 1 parameter: . Show recommended pairs: true/false -> To show top 1 of strong and weak currency Tips to trade: . To trade only with strongest vs weakest currency . When H1, M30, M15, M5 of specific currency is up or down -> consider to open BUY/SELL . It can combine: + strongest currency vs weakest currency + strongest currency vs 2nd weakest currency + 2nd strongest currency vs weakest currency
FREE

The Multitimeframe-Candles (MCandles) - Indicator for MT5 shows the contour of an higher, free selectable, timeframe as an overlay on the current timeframe. You can freely choose the timeframe, number of candles and color of the overlays. The indicator only calculates the current candle frequently, so it saves computing capacities. If you like the indicator, please left a comment.

An effective indicator that highlights candles with increasing volumes, overshadowing those with shrinking volumes. Also suitable for Forex because it uses tick_volume.
You can set the colors to your liking. It will be easier to spot trends and possible reversals. The increasing volumes indicate the presence of large investors and therefore determine the reliability of the candle under observation
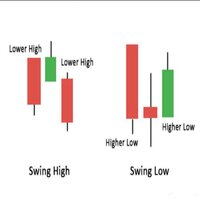
This indicator plots any and every swing high or swing low on your chart.
A swing high or low candle formation comprises of a minimum of 3 candles whereby the middle candles high/low is the highest or lowest point amongst the three candles. The direction (bullish/bearish) of the middle candle is irrelevant. Swings are very useful patterns that can be used to determine market structure as well as potential price reversal points on a chart.
This indicator is derived from the Bill Williams Frac

--- StudentK Sync Chart --- 1. Move charts at the same time 2. Cross check among different Symbols and Timeframes 3. Plan your own trading strategies
--- Context --- StudentK is not indicated as a master or K Sir for knowledgeable person who claims for winning all the time. (But lots of traders should know the fact that it is rarely truth, especially in fluctuated period of time)
StudentK is a group of years-experienced traders who want to share amazing tools in Free and Paid versions. Aimi

The Binary Tend Follower indicator has been designed especially for Binary options trading. The best time frame to use the indicator on is a 1M chart with 1Min expiry's as soon as the signal candle closes. There is no need to over complicate your trading as all the thinking has been done for you. The indicator was designed as simple as possible to take out all the subjectivity of trying to follow a complicated strategy, and allowing the trader to focus on extremely simple entry's. Buy: When the

This is a trend follwing indicator, where you can find signals, when there's a crossover between the lines. When current price is above the lines, you are on a long term situation and when price is below the lines, you are on a short one. Period of calculations can be edited. So, with this, if you add other indicators to filter bad signals, you can have a good profitable strategy.

Chart Walker Smart Lines (CWSL) by Chart Walker Smart Lines is a MetaTrader 5 (MT5) indicator that revolutionizes technical analysis by offering a suite of powerful features to enhance your trading experience. This intelligent tool is designed to automate various aspects of chart analysis, providing traders with valuable insights and saving time on manual tasks. Key Features Automatic Channel Drawing: Smart Lines takes the hassle out of drawing trend channels by automatically identifying and

A flexible 2-Line MACD indicator The default MACD indicator inside MT4, limits you to using the MACD with a fast-EMA, slow-EMA. This MACD indicator allows you to set your own MA-Method choices for these 2 components, separately! You can select from SMA, EMA, SMMA, LWMA, ADAPTIVE MA, FRACTAL MA, DEMA, TEMA, VARIABLE INDEX DYNAMIC MA, and can even use a separate method for each 2 fast-slow. The signal line has options from SMA-EMA-SMMA-LWMA. On-chart colored candles, with drawing condition types i

A fully featured BB indicator You're no longer limited to the built in default of using BB off a SMA method, now you can choose from: SMA - SMMA - EMA - LWMA - ADAPTIVE - FRACTAL ADAPTIVE - DEMA - TEMA - VARIABLE INDEX DYNAMIC
You now also have up to 5 standard deviation levels, with price labels. Styling wise, there are color gradients provided for deviation filling, candles (bars too), deviation lines and texts.
Options: - MTF - 9 choices of MA to base the BB off
- 5 adjustable deviation
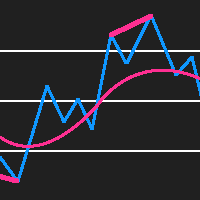
RSI Divergence Detector is an RSI indicator which also detects divergences and plots arrows and trend lines on the chart where you should buy and sell. Please note that this indicator provides 5 buffers and doesn't repaint making it an exceptional indicator for Expert Advisors. The indicator also provides alerts. Buffer 0 = RSI Buffer 1 = Buy Buffer 2 = Sell Buffer 3 = RSIGradient Buffer 4 = PriceGradient
NON REPAINTING
DIVERGENCE DETECTION

Inventory Retracement Trade it is designed based on one of the most popular tradingview indicator. This is mostly combined with other popurlar trend indicator to confirm the strength of the movement. Definition Inventory Retracement Trade is quickly becoming one of the most popular ways to identify where short-term counter trend institutional inventory has subsided and when it’s time to re-enter into a trade’s original trend direction.

This indicator uses the metaquotes ZigZag indicator as base to plot fibonacci extension and fibonacci retracement based in the Elliot waves. A fibonacci retracement will be plotted on every wave draw by the ZigZag. A fibonacci extension will be plotted only after the 2nd wave.
Both fibonacci will be updated over the same wave tendency. Supporting until 9 consecutive elliot waves.
Parameters:
Depth: How much the algorithm will iterate to find the lowest and highest candles Deviation: Amoun

A indicator to show saturation in buying or selling With fast and complex mathematical calculations Easily find saturation points for buying or selling Can be used in all symbols and time frames with many signals Can be combined with different indicators and different time frames With simple settings and simple working methods
Features: Can be used on all symbols Can be used in all time frames Can be used in all markets (Forex, stock, etc.) Large number of signals Same performance on all t

HiLo Trend Matrix is an advanced multi-timeframe trend indicator that scans and analyzes multiple timeframes to determine the overall trend direction, allowing you to effortlessly ride the trend waves as they emerge. By scanning the four higher timeframes, starting from your current timeframe or a selected one from the input parameters, you'll always have a comprehensive view of the market's movements. And when the trend aligns, the HiLo Trend Matrix delivers an alert, so you can seize the oppo

IBB Candles is a tool that is based on the concept of Inverse Bollinger Bands. It compares price relative to state of the bands and plots candles with different colors defining the current state of the market i.e range | trend | strong trend. As the name suggests IBB(Inverse Bollinger Bands) is a technique which is completely different from the traditional Bollinger Bands and proves to be much more effective in analyzing market. This personal implementation makes this tool a more reliable optio
MetaTrader 마켓은 MetaTrader 플랫폼용 애플리케이션을 구입할 수 있는 편리하고 안전한 환경을 제공합니다. Strategy Tester의 테스트를 위해 터미널에서 Expert Advisor 및 인디케이터의 무료 데모 버전을 다운로드하십시오.
MQL5.community 결제 시스템을 이용해 성능을 모니터링하고 원하는 제품에 대해 결제할 수 있도록 다양한 모드로 애플리케이션을 테스트할 수 있습니다.
트레이딩 기회를 놓치고 있어요:
- 무료 트레이딩 앱
- 복사용 8,000 이상의 시그널
- 금융 시장 개척을 위한 경제 뉴스
등록
로그인
계정이 없으시면, 가입하십시오
MQL5.com 웹사이트에 로그인을 하기 위해 쿠키를 허용하십시오.
브라우저에서 필요한 설정을 활성화하시지 않으면, 로그인할 수 없습니다.