MetaTrader 5용 기술 지표 - 2

This indicator finds wedges , which are continuation patterns identified by converging trendlines surrounding a price consolidation period. It signals trades using a donchian breakout alongside the formation breakout. [ Installation Guide | Update Guide | Troubleshooting | FAQ | All Products ] Easy to use Customizable colors and sizes It implements breakout signals It implements alerts of all kinds
Optimal Usage To see wedges of all sizes, which can overlap, load the indicator several times on

WHY IS OUR FXACCCURATE LS MT5 THE PROFITABLE ? PROTECT YOUR CAPITAL WITH RISK MANAGEMENT
Gives entry, stop and target levels from time to time. It finds Trading opportunities by analyzing what the price is doing during established trends. POWERFUL INDICATOR FOR A RELIABLE STRATEGIES
We have made these indicators with a lot of years of hard work. It is made at a very advanced level.
Established trends provide dozens of trading opportunities, but most trend indicators completely ignore them!

이 대시보드는 선택한 기호에 대한 거래 전략에 따라 스캘핑 모드와 장기 모드 모두에서 차트의 공급 및 수요 영역을 검색하고 표시합니다. 또한 대시보드의 스캐너 모드를 통해 원하는 모든 기호를 한눈에 확인하고 적합한 위치를 놓치지 않도록 도와줍니다 / MT4 버전 .
무료 보조지표: Basic Supply Demand
특징 여러 통화쌍에 대한 거래 기회를 볼 수 있으며, 공급 및 수요 영역에 대한 근접성에 따라 순위가 매겨진 모든 쌍을 명확하고 간결하게 볼 수 있습니다. 색상부터 감지 매개변수까지 특정 요구에 맞게 사용자 지정 설정 가능
주요 입력 Indicator mode : 표시기 모드 또는 새로운 기능이 포함된 패널 모드 중에서 선택 가능 Symbols : "28개 주요 통화쌍" 또는 "선택한 심볼" 중에서 선택 Selected Symbols : 쉼표로 구분하여 모니터링하려는 원하는 심볼("EURUSD, GBPUSD, XAUUSD")을 선택합

Professional Scalping Tool on Deriv Attention! The indicator will be sold in limited quantities!!! The previous 5 copies were sold for $250 The remaining 4 copies will be sold for $350 The next price is $500
Description:
This trading indicator is designed for professional traders focused on scalping. Designed with the market in mind, it provides highly accurate spike trading signals. It works on the M1 timeframe and supports the following symbols: Boom 300 Index, Boom 500 Index, Boom 1000 I
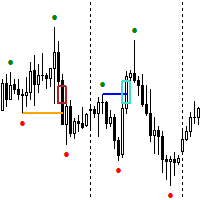
FREE EA for GOLD , Rejection Block Trader can be found here: https://www.mql5.com/en/market/product/116472 The Expert Advisor for this Indicator can be found here: https://www.mql5.com/en/market/product/115476 The Break of Structure (BoS) and Change of Character indicator with Fair Value Gap (FVG) filter is a specialized tool designed to enhance trading strategies by pinpointing high-probability trading opportunities on price charts. By integrating the BoS and Change of Character concepts wit
FREE

이제 메타트레이더에서 사용 가능 범위 및 다음 가능한 움직임 식별 | 추세의 초기 신호와 강도를 확인하세요 | 반전 전 명확한 출구 확보 | 가격이 테스트 할 피보 레벨 파악 비추적, 비지연 지표 - 수동 및 자동 거래에 이상적 - 모든 자산 및 모든 시간 단위에 적합 - 출시 시 50% 할인 - 이후 >> $149로 복귀 구매 후 이 채널로 문의 하여 권장 설정을 확인하세요. MT4 버전: 여기를 클릭하세요 BladeSCALPER 및 PowerZONES 로 전체 방법을 확인하세요.
어떤 서비스인가요?
트렌드디코더는 추세 모니터링을 간단하고 쉽게 하기 위한 여러 혁신 기술의 집약체입니다.
투영 추세선(투영 추세선) - 다가오는 추세의 속도 기준 실시간 추세선과 투영 추세선 비교 - 시장이 이전과 같은 방향으로 움직이고 있는지, 아니면 둔화되고 있는지? 실시간 추세선 교차 - 추세가 궤

ICT Silver Bullet
If you are searching for a reliable indicator to trade the ICT Silver Bullet concept, or ICT concepts, Smart Money Concepts, or SMC, this indicator will respond to your need! Before version 2.2, this indicator was focused only on ICT Silver Bullet, but moving forward, we will include the different elements for smart money concept trading. This indicator will help you identify the following: FVG - fair value gaps Market structure: BOS and CHOCH. It is based on ZIGZAG as it is

What Is Market Imbalance? Market Imbalance, also known as "IPA" or Improper Price Action, is when price moves so quick in one direction with no orders on the other side of the market to mitigate the price movement. We all know Big Banks, or "Smart Money", can move the market by placing huge orders which in turn can move price significantly. They can do this because Big Banks are the top 10 Forex traders in the world . But unfortunately, the Big Banks cannot leave these orders in drawdown and mu

This indicator builds upon the previously posted Nadaraya-Watson smoothers. Here we have created an envelope indicator based on Kernel Smoothing with integrated alerts from crosses between the price and envelope extremities. Unlike the Nadaraya-Watson estimator, this indicator follows a contrarian methodology.
Please note that by default this indicator can be subject to repainting. Users can use a non-repainting smoothing method available from the settings. The triangle labels are designed

기본 캔들 패턴 인디케이터를 사용하면 주요 캔들 패턴을 그 어느 때보다 쉽게 식별할 수 있습니다. 해머, 이브닝 스타, 삼백수형 등 다양한 패턴을 차트에서 한 눈에 확인할 수 있습니다. 직관적인 인터페이스와 명확한 시각적 신호를 통해 빠르고 정확하게 거래 기회를 식별할 수 있습니다 / MT4 버전
이 보조지표용 대시보드 스캐너: ( Basic Candlestick Patterns Dashboard )
특징 정확성 : 주요 캔들 패턴을 자동으로 식별하여 수동 검색이 필요 없습니다. 사용자 지정 : 사용자 지정: 트레이딩 스타일에 맞게 트레이딩 선호도에 따라 매개변수를 조정할 수 있습니다.
하모닉 패턴 포함 상승 패턴 Hammer Inverse hammer Bullish engulfing Morning star 3 White soldiers 약세 패턴 Hanging man Shooting star Bearish engulfing Evening star 3 Black
FREE

Auto Fibo 는 수동 거래를 향상시키기 위해 개발된 지표입니다. 자동으로 황금 비율을 그려 시간을 절약하고 거래를 촉진합니다. 지표를 그래프에 부착하면 정확한 황금 비율이 자동으로 그려지므로 임계점을 찾아야 하는 수고를 덜 수 있습니다. 인터페이스는 컴퓨터에 따라 밴드의 대략적인 고점과 저점으로 조정됩니다. 이 표시기는 대부분의 시작 및 끝 지점 선택 오류를 수정합니다. 각 밴드에 대해 정확한 가격이 표시됩니다. 警告 私はMQL5.com으로 私のEAを販売するだけ입니다.もし誰かが私のEAを売ってくれと連絡してきたら、それはああにの金が また、もしあなたが私のEAを 外部のウェブサイトから購入した場合、それ는 偽의 바 죤으로 あ り, original의 ゝ と 同じ よ に は 動作 ないこ
FREE

이 프로젝트를 좋아한다면 5 스타 리뷰를 남겨주세요. 인스 타 그램: borelatech Volume-weighted average price는 총 거래량에 거래된 값의 비율입니다.
특정 시간대에 거래. 평균 가격의 측정입니다.
주식은 거래 수평선에 거래됩니다. VWAP는 종종 사용됩니다.
투자자의 거래 벤치 마크는 가능한 한 수동으로
실행. 이 지시자로 당신은 VWAP를 당길 수 있을 것입니다: 현재 날. 현재 주. 현재 달. 현재 분기. 현재 년. 또는: 이전 날. 이전 주. 지난 달. 이전 분기. 이전 연도.
FREE
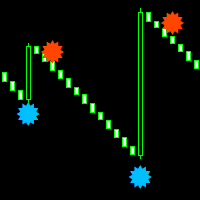
Boom and crash smasher free indicator that works on all timeframe from the one minute to the monthly timeframe. the indicator is 100% non-repaint. the indicator come with sound alerts and email push notification the indicator appears on the current candle stick for faster entries can be used on all charts and renko charts orange dot is your sell signal blue dot is your buy signal
FREE

The indicator combines the features of both the Tick charts and Volume Bar charts. The mode can be selected in the indicator's settings.
Tick charts measure the number of transactions per bar. To give you an example if you have a 233 tick chart, each bar measures 233 transactions per bar and a new bar is plotted after 233 transactions. You can choose any number of ticks per bar but most traders choose Fibonacci numbers (1, 2, 3, 5, 8, 13, 21, 34, 55, 89, 144, 233...). Volume bar charts are desi

당신은 정말 좋은 지표를 가지고 있습니다 ...하지만 당신은 경고를 원하십니까? 신호를 제공했는지 확인하기 위해 표시기를 자세히 살펴보는 것이 지겹습니까? ... 그렇다면이 표시기가 당신을위한 것일 수 있습니다!
Universal Alerts는 차트 표시기 중 하나를 분석하고 자체 매개변수에 따라 신호가 표시될 때 경고를 제공합니다. 이 표시기를 구성하면 매수/매도 신호가 있을 때마다 아이콘이 표시되고 다음에 오는 모든 신호는 경고를 생성하거나 메일을 보내거나 앱 알림을 보냅니다.
경고가 필요하지 않은 경우에도 이 표시기(또는 여러 인스턴스)를 사용하여 신호를 더 명확하게 표시하고 거래 경험 또는 백테스팅을 개선할 수 있습니다. 이 블로그에서 표시기의 가능한 설정에 대해 자세히 알아볼 수 있습니다. 특징 대부분의 지표 지원 : 라인 크로스오버, 레벨 크로스오버, 차트 신호, 색상 변경... 모든 유형의 알림 : 알림, 메일 또는 앱 알림 수신 여부를 선택합니다.

QM (Quasimodo) Pattern is based on Read The Market(RTM) concepts. The purpose of this model is to face the big players of the market (financial institutions and banks), As you know in financial markets, big traders try to fool small traders, but RTM prevent traders from getting trapped. This style is formed in terms of price candles and presented according to market supply and demand areas and no price oscillator is used in it. RTM concepts are very suitable for all kinds of investments, includi
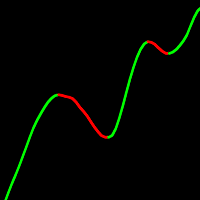
거대한 사용자 정의 옵션 이동 평균. 스무딩의 10 가지 유형. 12 가격 옵션을 구축 할 수 있습니다. 결과 이동의 이산화의 가능성. 빠른 코드. 제한없이 전문가에 사용할 수있는 능력. 범용 표시기는 현대 거래에 사용되는 가장 인기있는 건설 방법을 결합합니다. 따라서 더 이상 많은 다른 지표를 가질 필요가 없습니다. 지표 기반 전문가 고문 이동 평균은 설정된 기간 동안 기기의 평균 가격을 표시하는 가격 기반 후행 지표입니다. 본질적으로 이동 평균은 차트를 해석 할 때"노이즈"를 부드럽게합니다. 이동 평균은 모멘텀을 평가하고 추세를 확인하고 지원 및 저항 영역을 식별하는 좋은 방법입니다. 이동 평균을 사용하는 방법의 거대한 다양성이있다. 다음은 가장 일반적인 사용 방법의 예입니다:이동 평균의 방향(이 방법을 사용하는 주요 규칙은 이동 평균의 일반적인 방향을 추적하는 것입니다:시장에서 지배적 인 추세를 나타냅니다. 이 운동의 방향으로 만 거래를 할 가치가 있습니다. 이러한 간단한 규칙
FREE

이 알고리즘은 86%*정확도로 단기간의 가격 변화를 예측합니다. 과매수 또는 과매도 상태인 경우,이 표시기가 사용자에게 알립니다. 가격이 신호 촛불보다 높거나 낮은 경우 예측한다. 더 큰 시간 프레임에 평균 복귀 거래,바이너리 옵션 또는 선물 계약에 적합합니다. 이 지표는 5 년간의 데이터에 대해 백 테스트되었으며 시간 경과에 따른 가격 반전을 예측하는 데 90%의 정확도가 있습니다.
특징::
간단한 설정 모든 차트로 드래그 앤 드롭 원하는대로 매개 변수 조정(선택 사항) 경고 사용(선택 사항) 그리고 당신은 완료! 시각 및 오디오 경고 휴대 전화로 직접 전송 경고 터미널로 전송 된 팝업 알림 높은 승률 거래의 90%까지 승리 백 테스트 5 년 여러 통화. (백 테스트 세부 정보 및 분석은 웹 사이트를 참조하십시오). 많은 수의 신호 기대 1 에 2 기호 당 하루 신호*. 당신이 표시가있는 경우*이입니다 30 분 촛불. 유연한 외환,지수,상품 및 주식에서 작동합니다. 어떤
FREE

Create Unlimited Dashboards Each dashboard can be upto 28 Symbols x 24 Indicators. Mix and match from 31 leading indicators and all timeframes, to create unlimited unique dashboards. Create Group Alerts to be alerted when your chosen indicators are all aligned. 33 customizable trading strategy alerts (Trend, Breakout, Overbought, Oversold, Thresholds, Saucers etc). Scalper, Day or Long Term Trader? Mega Dash has you covered, design your unique dashboard to suit your trading style. Mega Dash is

To get access to MT4 version please click here . This is the exact conversion from TradingView: "ZLSMA - Zero Lag LSMA" by "veryfid". This is a light-load processing indicator. This is a non-repaint indicator. Buffers are available for processing in EAs. All input fields are available. You can message in private chat for further changes you need. Thanks for downloading
The idea of this trading system from the EMA with a Mediante price from the EMA indicators is based exactly 100% from Ripster47 trading system, me is just the person to create it on the MT5 platform, but with alerts for your own buy/sell settings. Hereby I make a copy from Ripster47 explanation for using that system: " EMA Cloud By Ripster
EMA Cloud System is a Trading System Invented by Ripster where areas are shaded between two desired EMAs. The concept implies the EMA cloud area
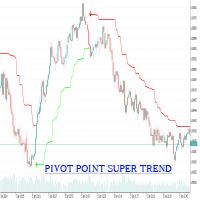
Introducing the Pivot Point SuperTrend MT5 version of the Trading View indicator by LonesomeTheBlue.
A revolutionary script designed to optimize your trading strategies by combining the power of Pivot Points with the precision of SuperTrend indicators. This unique algorithm offers an enhanced approach to identifying and staying within trends, delivering unparalleled performance in today's dynamic markets.
Key Features: Enhanced Trend Identification: By integrating Pivot Points and calculat
How Does It Work?
The Wyckoff Wizard uses Multi-timeframe analysis. In simpler terms, the indicator monitors 2 timeframes. A higher timeframe and a lower timeframe. The indicator determines the trend by analyzing order flow and structure on the higher timeframe(4 hour for instance). Once the trend and order flow have been determined the indicator then uses previous market structure and price action to accurately determine high probability reversal zones. Once the high probability reversal z

The Volume by Price Indicator for MetaTrader 5 features Volume Profile and Market Profile TPO (Time Price Opportunity). Volume and TPO histogram bar and line charts. Volume Footprint charts. TPO letter and block marker collapsed and split structure charts. Session filtering and grouping. Static, dynamic and flexible range segmentation and compositing methods with relative and absolute visualizations. Graphical layering, positioning and styling options to suit the user's analytic and aesthetic n

유동성 및 이동 평균에 따라 달라지는 지표 > 98%의 정확한 매수 및 매도 결정을 제공합니다. 그리고 거래를 마감할 시간. PRICE는 수시로 증가할 것이며 첫 번째 EA가 출시되는 시기는 이 지표에 따라 2k 이상이 될 것입니다. 1 - 매수 또는 매도 포지션을 열 때(두 라인 X의 교차에 따라 다르며 포인트 계산은 선택한 프레임에 따라 다름) (십자가는 색칠된 영역 밖에 있어야 함) 촛불은 십자가 후에 또는 (첫 번째 또는 두 번째에서 다섯 번째까지) 십자가에 닿아야 합니다. 마지막 조건이 십자가 아래에서 직접 확인되었을 때 계산되는 포인트(스크린샷이 있는 표 참조.. 더하기 도구를 사용하여 면적 계산) 2-다음 영역 외부의 노란색 라인 시작 곡선이 위치를 닫으라는 신호일 때 3-works on Frames (1m 5m 10m 15m 30m 1h 4h 매일 주간 및 월간)(모든 쌍>및 모든 상품) 전공 권장 4- ..(55%)의 이득을 얻은 후 트레일 스톱 1000$ 스택에

지원 및 저항 수준은 오랫동안 시장 분석을위한 강력한 도구였습니다. 강력한 지원 지표는 현지 가격 최소값을 기반으로 한 지원 수준과 현지 가격 최대값을 기반으로 한 저항 수준을 나타냅니다.
내 다른 개발은 여기에서 볼 수 있습니다
추세 표시기와 함께 사용하는 것이 좋습니다(예:금 물건)-추세에 따라 거래하고 동시에 통합 또는 추세 반전 영역을 결정할 수있을뿐만 아니라 정지 손실을 설정하고 지원 및 저항 수준에서 이익을 얻을 수 있습니다.
설정 및 개인 보너스를 받기 위해 구입 후 즉시 저에게 연락하십시오!
들어오는 매개 변수 -
이 표시기에는 복잡한 설정이 필요하지 않으며 주요 매개 변수는 색상 스케일 조정입니다.
지원 및 저항 수준은 오랫동안 시장 분석을위한 강력한 도구였습니다. 강력한 지원 지표는 현지 가격 최소값을 기반으로 한 지원 수준과 현지 가격 최대값을 기반으로 한 저항 수준을 나타냅니다.
내 다른 개발은 여기에서 볼 수 있습니다
추세 표

이동 평균 수렴 발산(MACD) 거래 전략은 추세와 흐름 방향의 변화를 식별하는 데 사용되는 인기 있는 기술 분석 도구입니다. MACD는 12기간의 지수 이동 평균(EMA)에서 26기간의 EMA를 빼서 계산됩니다. "신호 선"이라고 불리는 9기간의 EMA는 MACD 위에 표시되어 매수 및 매도 신호를 트리거로 작용합니다. MACD 선이 신호 선 위에 있으면 매수 트렌드로 간주되고, 신호 선 아래에 있으면 매도 트렌드로 간주됩니다. 거래자들은 종종 이 정보를 사용하여 잠재적인 매수 및 매도 기회를 파악합니다. MACD는 다양한 방식으로 사용될 수 있는 다재다능한 지표입니다. 일반적으로 사용되는 몇 가지 방법은 다음과 같습니다. 교차: MACD 선이 신호 선 위로 크로스되면 매수 교차가 발생하고, MACD 선이 신호 선 아래로 크로스되면 매도 교차가 발생합니다. 발산: MACD가 새로운 고점을 형성하면서 기초 자산이 그렇지 않은 경우 매수 발산이 발생하고, MACD가 새로운 저점을 형성
FREE

** All Symbols x All Time frames scan just by pressing scanner button ** ***Contact me after the purchase to send you instructions and add you in "Swing scanner group" for sharing or seeing experiences with other users. Introduction: Swing Scanner is the indicator designed to detect swings in the direction of the trend and possible reversal swings. The indicator studies several price and time vectors to track the aggregate trend direction and detects situations in which the market is o

Trend Chief는 시장 노이즈를 걸러내고 추세, 진입점 및 가능한 출구 수준을 결정하는 고급 지표 알고리즘입니다. 스캘핑에는 더 짧은 시간 프레임을 사용하고 스윙 거래에는 더 높은 시간 프레임을 사용하십시오. Trend Chief는 모든 Metatrader 기호에 적합합니다: 통화, 금속, 암호화 통화, 주식 및 지수
* Trend Chief 지표 사용 방법: - Daily 및 H4 차트를 보고 주요 추세 파악 - 추세가 상승하는 경우 m15와 같은 더 작은 시간 프레임으로 이동하고 거래를 하기 전에 가격이 주요 녹색 선 위로 움직일 때까지 기다리십시오. 다른 모든 선도 녹색이어야 합니다. - 추세가 하락한 경우 m15와 같은 더 작은 시간 프레임으로 이동하여 거래를 하기 전에 가격이 주요 빨간색 라인 아래로 이동할 때까지 기다리십시오. 다른 모든 라인도 빨간색이어야 합니다. - 선의 색상이 변할 때 거래 종료 내 신호 및 기타 제품은 여기에서 찾을 수 있습니다.
무료 표시기 - 무제한 계정 - 내 모든 무료 제품을 보려면 여기를 클릭하세요.
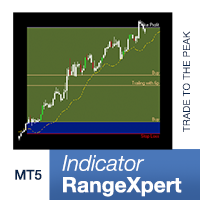
시장에서 완벽한 기회를 포착 하고 돌파를 통해 강력한 추세를 따라갈 때 이 RangeXpert 지표는 귀중한 지원을 제공합니다. 이 지표는 초보자와 준전문가를 위해 특별히 개발되었으며 시장 기회를 정확하게 식별하고 거래 전략을 최적화할 수 있는 탁월한 분석 기능을 제공합니다. RangeXpert는 다양한 포지션 강점과 정교한 수익 분배를 활용하여 까다로운 시장 상황에서도 향상된 적응성과 탄력성을 보여줍니다. 알고리즘을 사용 하면 거래를 시작하기 위한 이상적인 시간을 찾아 RangeXpert를 사용하는 모든 거래자의 성공률을 높일 수 있습니다.
높은 정밀도 AUTOTRADING 이제 거래 시스템(EA)을 사용할 수 있습니다:
RangeXpert MT5 » https://www.mql5.com/de/market/product/103454
FREE

MetaForecast는 가격 데이터의 조화를 기반으로 모든 시장의 미래를 예측하고 시각화합니다. 시장이 항상 예측 가능한 것은 아니지만 가격에 패턴이 있다면 MetaForecast는 가능한 정확하게 미래를 예측할 수 있습니다. 다른 유사한 제품과 비교했을 때, MetaForecast는 시장 동향을 분석하여 더 정확한 결과를 생성할 수 있습니다.
입력 매개변수 Past size (과거 크기) MetaForecast가 미래 예측을 생성하기 위한 모델을 만드는 데 사용하는 막대의 수를 지정합니다. 모델은 선택한 막대 위에 그려진 노란색 선으로 표시됩니다. Future size (미래 크기) 예측해야 할 미래 막대의 수를 지정합니다. 예측된 미래는 핑크색 선으로 표시되며 그 위에 파란색 회귀선이 그려집니다. Degree (차수) 이 입력은 MetaForecast가 시장에서 수행할 분석 수준을 결정합니다. Degree 설명 0 차수 0의 경우, "Past size" 입력에 모든 봉우리
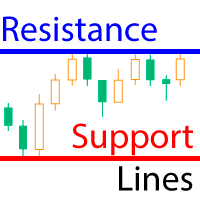
The indicator calculates fractal lines, which are technically psychological support/resistance lines. In fact, these are the highs and lows of the price over a period of time. The indicator works on all charts and timeframes. This free version of the Resistance Support Lines Pro indicator comes as is! Settings: These settings cannot be changed in this version Fractal Candels = 5 - number of candles from which a fractal is built. Calculates the maximum/minimum at which a psychological price can b
FREE
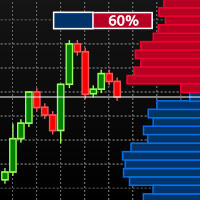
Visual Book on Chart is an indicator designed specially for stocks and futures market. To check if you can use the tool with your Broker open the MT5 Depth Of Market on your terminal and check if there are price and volume data available. Learn more about the MT5 Depth Of Market in the oficial page. The indicator shows the depth of market data on the chart window and use gradient based on the market data to colorize the histogram bars. The indicator is formed by two components: The panel, whic
FREE
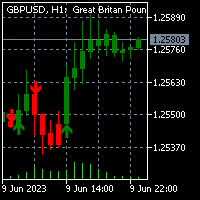
To get access to MT4 version please click here . This is the exact conversion from TradingView: "UT Bot Alerts" by "QuantNomad". This is a light-load processing and non-repaint indicator. Buffers are available for processing in EAs. You can message in private chat for further changes you need. Here is the source code of a simple Expert Advisor operating based on signals from UT Bot Alerts . #include <Trade\Trade.mqh> CTrade trade; int handle_utbot= 0 ; input group "EA Setting" input int magic_

MT4 버전 | Trend Monitor VZ 표시 | Owl Smart Levels 표시 | Owl Smart Levels 전략 | FAQ 엘리엇 웨이브 이론은 가격 차트에 파도의 시각적 모델에 의존하는 금융 시장의 프로세스의 해석이다. 평가 가능한 지그재그 표시기는 시장의 파동 구조를 표시하며,이는 거래 결정을 내리는 데 사용할 수 있습니다. 평가 가능한 지그재그 표시등이 더 안정적이며 종종 고전적인 지그재그 표시와 같은 방향을 변경하지 않습니다,오해의 소지가있는 상인. 이 지표파의 건설에 도형의 사용을 통해 달성된다. Telegram 채팅: @it_trader_chat 새로운 Expert Advisor Prop Master - 트레이딩 터미널에서 테스트해보세요 https://www.mql5.com/ko/market/product/115375
평가 가능한 지그재그는 주로 추세 지표입니다. 그것은 상인이 거래해야하는 주요 방향을 설정하지만 시장 진입의 지표
FREE

The Key level wedge MT5 indicator automatically draws rising wedge pattern and falling wedge pattern for you on the chart. This pattern is really good when used as a confirmation entry at key support & resistance, supply & demand and reversal zones.
Advantages
The Key level wedge MT5 block DOES NOT RE-PAINT, giving you confidence when a signal appears and also helps when looking back. The Key level wedge MT5 includes an on/off button on the chart to easily keep the charts cle

** All Symbols x All Timeframes scan just by pressing scanner button ** *** Contact me after the purchase to send you instructions and add you in "Wolfe Wave Scanner group" for sharing or seeing experiences with other users.
Introduction: A Wolfe Wave is created with five-wave patterns in price. It shows supply and demand and a fight towards a balance price. T hese waves of price actions can help traders identify the boundaries of the trend . Also It helps forecast how the price will mo

BUY INDICATOR AND GET A PIVOT POINT EA FOR FREE AS A BONUS + SOME OTHER GIFTS! Attention, the MT5 version of this application does not work on strategy tester, only on live accounts or demo accounts on live market. If you need an MT5 demo version of the Indicator send me a private message here: https://www.mql5.com/en/users/italobr ITALO PIVOTS INDICATOR is the best pivot point indicator for strong price reversals and continuations of price movements ever created, and why is that? You
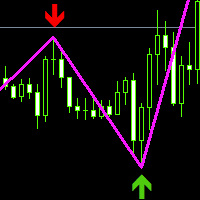
This index is based on the secondary development of zigzag, adding high and low point arrow indication, thickening the line and changing the color. Can be a good display of the current admission trading signals, current long or short. It can be combined with other indicators to determine the trading point, which has great reference value. Compared with the general trend index or oscillation batch standard, the accurate determination is higher from the perspective of historical data research and
FREE

차트에 지지 및 저항 수준과 추진 캔들 갭을 자동으로 그려주므로 다음 가격 방향 및/또는 잠재적 반전 가능성을 확인할 수 있습니다.
이 보조지표는 제 웹사이트(시장 구조 트레이더)에서 가르치는 포지션 트레이딩 방법론의 일부로 사용하도록 설계되었으며 타겟팅 및 잠재적 진입을 위한 주요 정보를 표시합니다. MT4 Version: https://www.mql5.com/en/market/product/97246/ 이 보조지표에는 2가지 핵심 기능과 4가지 추가 기능이 있습니다: 핵심 기능 1 - 일일, 주간 및 월간 시간대의 자동 지지선 및 저항선 이 인디케이터는 지난 2일에서 최대 6주 및 몇 달 전의 가장 최근 지원 및 저항 수준을 자동으로 가져옵니다. 이러한 레벨의 모양을 원하는 대로 완전히 사용자 지정하고 표시되는 레벨 수를 표시할 수 있습니다. 이러한 주요 레벨은 종종 가격이 하락하거나 반전되는 주요 지지 및 저항 구간으로 작용합니다. 또한 가격이 향할 목표가 되기도 하므로

MT4 version | Owl Smart Levels Indicator | Owl Smart Levels 전략 | FAQ
Fractals Indicator 는 Bill Williams 의 저자 거래 전략 요소 중 하나입니다. 가격 차트에서 가격 반전 지점을 검색하고 결과적으로 지원 및 저항 수준을 검색하는 데 사용됩니다. Full Fractals Indicator 는 거의 모든 거래 터미널의 툴킷에서 사용할 수 있는 개선된 Fractals입니다. 유일한 차이점은 프랙탈을 만들기 위해 기본 양초의 왼쪽에 5개의 양초와 오른쪽에 2개의 양초를 사용한다는 것입니다(그림 1 참조). 기본 구성 외에도 Full Fractals는 가격이 한동안 멈춘 수준을 찾습니다. Telegram 채팅: @it_trader_chat 새로운 Expert Advisor Prop Master - 트레이딩 터미널에서 테스트해보세요 https://www.mql5.com/ko/market
FREE

To get access to MT4 version please click here . This is the exact conversion from TradingView: "SwingArm ATR Trend Indicator" by " vsnfnd ". Also known as : "Blackflag FTS" by "Jose Azcarate" This is a light-load processing and non-repaint indicator. All input options are available except multi time frame. Buffers are available for processing in EAs. Extra option to show buy and sell signal alerts. You can message in private chat for further changes you need.

This indicator labels swing highs and swing lows as well as the candle pattern that occurred at that precise point. The indicator can detect the following 6 candle patterns: hammer , inverse hammer , bullish engulfing , hanging man , shooting star and bearish engulfing .
The notations HH, HL, LH, and LL you can see on the labels are defined as follows:
HH : Higher high
HL : Higher low
LH : Lower high
LL : Lower low
Setting
Length: Sensitivity of the swing high/low de

This is the best Support and Resistance Indicator on the market, and it shows both confirmed Support and Resistance as well as Retests. Support & Resistance: Support marks where buying demand halts price declines, acting as a safety net. Resistance caps price surges, driven by selling pressure. Traders leverage these levels to predict reversals, plan entries, exits, and manage risks, making them trading's fundamental guideposts. You can also find Premium and Discount Levels, Strong High/Low,
FREE

Wolfe Waves are naturally occurring trading patterns present in all financial markets and represent a fight towards an equilibrium price. These patterns can develop over short and long-term time frames and are one of the most reliable predictive reversal patterns in existence, normally preceding strong and long price movements. [ Installation Guide | Update Guide | Troubleshooting | FAQ | All Products ] Clear trading signals Amazingly easy to trade Customizable colors and sizes Implements perfo

Was: $99 Now: $34 Blahtech Daily Range indicator displays the average daily range alongside the individual session ranges. Using the daily open price as a reference the indicator shows fixed range and dynamic range targets as lines on the charts. These lines clearly show when the average range has been exhausted. Daily and session ranges can be useful for confirming entries or setting targets and is an excellent odds enhancer for many trading systems. Links [ Documentation | Install |

Our 5 Star Best Seller Beginner or Professional our best selling multi-timeframe Pivot Prof will enhance your trading and bring you great trade opportunities with the Support and Resistance levels that professionals use. Pivot trading is a simple effective method for entering and exiting the market at key levels and has been used by professionals for decades and works on all symbols: Forex, Crypto, Stocks, Indicies etc. Pivot Prof brings premium levels to the trader where the market is most like

RSI divergence indicator finds divergences between price chart and RSI indicator and informs you with alerts (popup, mobile notification or email). Its main use is to find trend reversals in the chart. Always use the divergence indicators with other technical assets like support resistance zones, candlestick patterns and price action to have a higher possibility to find trend reversals. Three confirmation type for RSI divergences: RSI line cross 50 level Price returns to previous H/L C
FREE

기본 렌코 지표는 명확하고 간결한 시장 관점을 찾는 트레이더를 위한 강력한 도구입니다. 이 인디케이터는 추세 시각화를 단순화할 뿐만 아니라 반전에 대한 정확한 알림을 제공하여 거래에서 전략적 우위를 제공합니다 / 무료 MT4 버전
특징 완전 사용자 지정 가능: 고급 사용자 지정 옵션으로 비즈니스 선호도에 맞게 지표를 조정할 수 있습니다. 색상부터 박스 크기 설정까지 차트에 정보가 표시되는 방식을 완벽하게 제어할 수 있습니다. 반전 알림: 반전 알림: 반전 알림을 통해 시장 방향의 잠재적 변화에 대해 가장 먼저 알아보세요. 이를 통해 정보에 입각한 시기적절한 결정을 내려 수익을 극대화하고 손실을 최소화할 수 있습니다.
입력 Size of the boxes: 박스 크기(포인트 기준) Bullish box colour: 상승 박스 색상 Bearish box colour: 약세 상자 색상 Box opacity: 불투명도(0~100 사이)입니다. 불투
FREE

A simple indicator that automatically highlights all FVGs (Fair Value Gaps) formed on the chart, as well as FVGs on history. It is possible to select colors for FVGs of different directions (long or short), select the time interval, select the color of middle point and you can also choose whether to delete filled FVGs or leave them on the chart (the option is beneficial for backtesting). The indicator can be very useful for those, who trade according to the concept of smart money, ICT, or simply
FREE

Was: $69 Now: $34 Blahtech VWAP - Volume Weighted Average Price (VWAP) is the ratio of price to total volume. It provides an average price over a specified time interval. Links [ Install | Update | Documentation ] Feature Highlights
Configurable VWAP Line Sessions, intervals, anchored or continuous Previous day settlement line Standard Deviation bands Alerts at bar close or real time Automatic Broker or Tick volumes Significantly reduced CPU usage
Input Parameters
Expert Advisor

The market is unfair if only because 10% of participants manage 90% of funds. An ordinary trader has slim changes to stand against these "vultures". This problem can be solved. You just need to be among these 10%, learn to predict their intentions and move with them. Volume is the only preemptive factor that faultlessly works on any timeframe and symbol. First, the volume appears and is accumulated, and only then the price moves. The price moves from one volume to another. Areas of volume accumu

The Trend Forecaster indicator utilizes a unique proprietary algorithm to determine entry points for a breakout trading strategy. The indicator identifies price clusters, analyzes price movement near levels, and provides a signal when the price breaks through a level. The Trend Forecaster indicator is suitable for all financial assets, including currencies (Forex), metals, stocks, indices, and cryptocurrencies. You can also adjust the indicator to work on any time frames, although it is recommen

Smart Liquidity Levels is a valuable tool for identifying optimal liquidity levels, enabling retail traders like us to strategically set our stop-loss orders. T he essential tool for traders seeking to maximize their trading success. The liquidity level is a critical component of inner circle trading (ICT). It assists us in determining when and how we should enter the market. Watch the video for detailed instructions. Here's why understanding liquidity levels is crucial in trading and how our

LT 회귀 채널을 발견하세요. 이는 피보나치 분석, 엔벨로프 분석 및 푸리에 외삽의 요소를 결합한 강력한 기술 지표입니다. 이 지표는 시장 변동성을 평가하며 피보나치 분석을 통해 과매수 및 과매도 수준을 정확하게 식별하도록 설계되었습니다. 또한 이러한 지표의 데이터를 통합하여 시장 움직임을 예측하기 위해 푸리에 외삽을 활용합니다. 우리의 다용도 도구는 독립적으로 또는 다른 지표와 조합하여 사용할 수 있습니다. 다양한 시간대 및 차트 유형과 호환되며 Renko 및 Heiken Ashi와 같은 사용자 정의 옵션도 포함됩니다. 일부 재그리기가 발생할 수 있지만 장기 시간대(500 이상 권장)로 갈수록 안정성이 크게 향상됩니다. 더 큰 시간대에서는 더 정확한 예측을 제공합니다. LT 회귀 채널의 힘을 여러분의 거래 전략에 경험해보세요. 지금 바로 시도해 보세요!
FREE

BUY INDICATOR AND GET EA FOR FREE AS A BONUS + SOME OTHER GIFTS! ITALO VOLUME INDICATOR is the best volume indicator ever created, and why is that? The Indicator works on all time-frames and assets, indicator built after 7 years of experience on forex and many other markets. You know many volume indicators around the internet are not complete, does not help, and it's difficult to trade, but the Italo Volume Indicator is different , the Italo Volume Indicator shows the wave volume, when market

지표 소개 이 지표는 RSI 또는 CCI 보다 더 안정적이고 지연이 적은 이동 평균 공식에 따라 설계되었습니다. 지표에는 세 가지 지표 값이 있으며 이동 평균 기간과 선 색상은 수동으로 변경할 수 있습니다. 이 지표는 무엇을 가져올 수 있습니까? 정확한 진입 신호: 표시기는 위쪽 및 아래쪽 화살표 신호를 그립니다. 다중 기간 추세 분석: 이 지표를 큰 기간 차트와 작은 기간 차트에 로드하면 사용 효과가 더 좋아집니다. 큰 시간대 차트의 지표 색상에 따라 추세 방향을 판단하고 작은 시간대 차트의 신호에 따라 시장에 진입하십시오. 고가 및 저가 구간 판단: 지표의 값은 항상 0~100 사이이며, 이를 바탕으로 가격의 상대적 위치를 분석할 수 있습니다. 추세선이 80보다 높고 가격이 과매수 구간에 있으면 매수 포지션을 열 기회를 선택할 수 있습니다. 추세선이 20 미만일 때 가격이 과매도 구간 에 있으면 매도 포지션을 열 수 있는 기회를 선택할 수 있습니다. 새로운 EA

지표는 여러 쌍의 스프레드를 동시에 모니터링하는 스프레드 스크리너를 제공하며 캔들 타이머 카운트다운은 현재 막대가 닫히고 새로운 막대가 형성되기까지 남은 시간을 표시합니다.
기간 한정 제공: 당사의 모든 프리미엄 지표는 단 50$에 제공됩니다. MQL5 블로그에 액세스하면 프리미엄 지표에 대한 모든 세부 정보를 찾을 수 있습니다. 여기를 클릭하세요.
주요 특징들 동시에 확산되는 다중 쌍을 모니터링합니다. 현지 시간이 아닌 서버 시간을 추적합니다. 구성 가능한 텍스트 색상 및 글꼴 크기 CPU 사용량을 줄이기 위해 최적화 개인화 된 쌍 목록.
연락하다 질문이 있거나 도움이 필요하면 비공개 메시지를 통해 저에게 연락하십시오.
경고 경고 모든 지표와 도구는 공식 Metatrader Store( MQL5 Market )를 통해서만 사용할 수 있습니다.
작가 SAYADI ACHREF, 핀테크 소프트웨어 엔지니어이자 Finansya의 설립자
FREE

초보자 또는 전문가 트레이더를 위한 최고의 솔루션!
이 지표는 우리가 독점 기능과 새로운 공식을 통합했기 때문에 독특하고 고품질이며 저렴한 거래 도구입니다. 단 하나의 차트로 28 Forex 쌍의 통화 강도를 읽을 수 있습니다! 새로운 추세 또는 스캘핑 기회의 정확한 트리거 포인트를 정확히 찾아낼 수 있기 때문에 거래가 어떻게 개선될지 상상해 보십시오.
사용 설명서: 여기를 클릭 https://www.mql5.com/en/blogs/post/697384
그것이 첫 번째, 원본입니다! 쓸모없는 지망생 클론을 사지 마십시오.
더 스페셜 강력한 통화 모멘텀을 보여주는 하위 창의 화살표 GAP가 거래를 안내합니다! 기본 또는 호가 통화가 과매도/과매도 영역(외부 시장 피보나치 수준)에 있을 때 개별 차트의 기본 창에 경고 표시가 나타납니다. 통화 강도가 외부 범위에서 떨어질 때 풀백/반전 경고. 교차 패턴의 특별 경고
추세를 빠르게 볼 수 있는 다중 시간 프레임 선택

The indicator displays market profiles of any duration in any place on the chart. Simply create a rectangle on the chart and this rectangle will be automatically filled by the profile. Change the size of the rectangle or move it - the profile will automatically follow the changes.
Operation features
The indicator is controlled directly from the chart window using the panel of buttons and fields for entering parameters. In the lower right corner of the chart window there is a pop-up "AP" but

이 표시기는 다양한 시간 척도의 많은 차트를 더 빠르고 쉽게 검토할 수 있도록 설계되었습니다. 여러 차트에서 시간 및 가격 추적 한 차트의 심볼 변경 및 동일한 심볼의 다른 모든 차트도 변경됩니다. 사용하기 쉽고 빠르게 마스터하기 표시기를 사용하면 동일한 기호에 열려 있는 다른 모든 차트에서 마우스 포인터가 현재 차트에 있는 가격과 시간을 식별할 수 있습니다. 이렇게 하면 일반적으로 동일한 위치를 식별하는 데 약간의 시간을 소비해야 하는 반면 여러 해도에 대한 정보를 빠르게 볼 수 있습니다. 열려 있는 모든 차트에서 시간만 추적하도록 선택할 수도 있습니다. 이를 통해 다이버전스 헌팅 시 쉽게 탐색할 수 있습니다. 한 차트에서 심볼을 변경하면 동일한 심볼의 다른 모든 차트가 해당 기간 설정을 유지하면서 새 심볼로 전환됩니다. 사용하는 방법
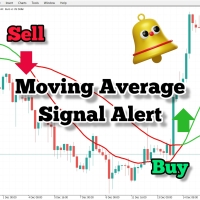
차트를 검토할 때 추세와 거래 수준을 식별하기 위해 여러 기간을 살펴보는 것을 좋아합니다. 나는 그것을 돕기 위해 이 도구를 만들었고 또한 장기간
FREE
촛불이 끝날 때까지의 시간 표시기. 촛불이 끝날 때까지의 시간과 서버 시간을 표시합니다. 텍스트는 캔들의 추세 또는 방향을 표시할 수 있으며 소리 알림이 내장되어 있습니다. 특징:
필요한 경우 조정하거나 비활성화할 수 있는 다른 시간 프레임뿐만 아니라 현재 캔들이 끝날 때까지의 시간을 표시합니다. AW 캔들 타임은 AW Super Trend 지표로 현재 캔들 또는 추세의 방향을 선택할 수 있습니다. 추세 전략은 선택한 색상으로 강조 표시됩니다. 내장형 소리 알림 및 캔들 교체 전 시간 추가 컬러링 디스플레이는 현재 가격 옆이나 차트의 모든 모서리에 구성할 수 있으며 입력 설정에서 유연하게 조정할 수 있습니다. Instruction -> 여기 / 더 많은 제품 -> 여기 입력 변수:
기본 Candle_Time_Location - 캔들 타임스탬프의 위치입니다. 차트의 모서리 또는 현재 가격 옆에 위치할 수 있습니다. Trend_Strategy - 컬러 캔들 타임스탬프를 사용합
FREE
ICT Template Indicator visualizes and automatically updates all important ICT elements for Scalpers, Day and Swing traders. It allows you too keep your chart clean and bring any elements by just one click to the buttons. Thanks to mobile notifications on external liquidity levels, you will not miss any opportunity and you don't have to sit behind the screens whole day. Each element has fully customizable colours, width, line types, max timeframe to be shown etc... so you can really tweak your ch

The indicator draws trendlines on chart. This indicator has six inputs. User can specify alternative labels for both lines. If multiple instances of the indicator are used, the labels must differ. User can set width and color of the lines and depth which specifies what significant peaks should be used. For example, Depth=10 sets trendlines using the current peaks and valleys that have at least 10 bars to the right and to the left and that have highs/lows less/greater than the peak's high/low. In
FREE

The indicator identifies when a divergence occurs between price and an indicator or oscillator. It identifies both regular and hidden divergences. Combined with your own rules and techniques, this indicator will allow you to create (or enhance) your own powerful system. Features
Can detect divergences for the following oscillators/indicators: MACD, OsMA, Stochastics, RSI, CCI, RVI, Awesome, ADX, ATR, OBV, Composite index, MFI and Momentum. Only one oscillator/indicator can be selected. Draws
FREE

BUY INDICATOR AND GET EA FOR FREE AS A BONUS + SOME OTHER GIFTS! ITALO TREND INDICATOR is the best trend indicator on the market, the Indicator works on all time-frames and assets, indicator built after 7 years of experience on forex and many other markets. You know many trend indicators around the internet are not complete, does not help, and it's difficult to trade, but the Italo Trend Indicator is different , the Italo Trend Indicator shows the signal to buy or sell, to confirm the signal t

Indicador en MQL5, que obtiene el promedio de 10 EMAS, que son alineadas según Fibonacci, obteniendo un promedio, que sera suavizado. Se puede ingresar un numero desde 2 a N, que multiplica a los EMA-Fibonacci. Funciona en cualquier criptomoneda, etc. etc... pudiendo calcular el futuro segun la tendencia de las EMAS. Funciona excelentemente en tramos largos, determinando exactamente el mejor inicio/salida.
El precio inicial por apertura sera por un periodo de tiempo, luego aumentará.

ATR Scanner Pro is a multi symbol multi timeframe volatility scanner that monitors and analyzes Average True Range indicator value in up to 28 symbols and 9 timeframes in 3 modes : ATR value: As a volatility dashboard it shows the ATR indicator value in all pairs and timeframes and signals when the ATR value reaches a maximum or minimum in a given duration. Short term ATR/Long term ATR ratio: It shows ratio of 2 ATRs with different periods. It's useful in detecting short term volatility and

** All Symbols x All Timeframes scan just by pressing scanner button ** ***Contact me after purchase to send you instructions and add you in "RSI scanner group" for sharing or seeing experiences with other users. Introduction RSI divergence is a main technique used to determine trend reversing when it’s time to sell or buy because prices are likely to drop or pick in the charts. The RSI Divergence indicator can help you locate the top and bottom of the market. This indicator finds Regular diver
MetaTrader 마켓 - 거래자를 위한 로봇 및 기술 지표는 거래 터미널에서 바로 사용할 수 있습니다.
The MQL5.community 결제 시스템은 MQL5.com 사이트의 모든 등록된 사용자가 MetaTrader 서비스에서 트랜잭션을 수행할 수 있습니다. 여러분께서는 WebMoney, 페이팔, 또는 은행 카드를 통해 자금을 예치하거나 인출하실 수 있습니다.
트레이딩 기회를 놓치고 있어요:
- 무료 트레이딩 앱
- 복사용 8,000 이상의 시그널
- 금융 시장 개척을 위한 경제 뉴스
등록
로그인
계정이 없으시면, 가입하십시오
MQL5.com 웹사이트에 로그인을 하기 위해 쿠키를 허용하십시오.
브라우저에서 필요한 설정을 활성화하시지 않으면, 로그인할 수 없습니다.