Guarda i video tutorial del Market su YouTube
Come acquistare un Robot di Trading o un indicatore
Esegui il tuo EA
hosting virtuale
hosting virtuale
Prova un indicatore/robot di trading prima di acquistarlo
Vuoi guadagnare nel Market?
Come presentare un prodotto per venderlo con successo
Indicatori tecnici per MetaTrader 5 - 59

Indicatore di domanda e offerta reale - ti consentirà di determinare rapidamente la posizione della resistenza e i livelli di supporto in tutti i tempi. L'indicatore sarà utile per coloro che utilizzano l'analisi tecnica nel loro trading. L'indicatore è facile da usare, basta trascinare e rilasciare sul grafico e l'indicatore ti mostrerà i livelli di supporto e resistenza più probabili. Quando si cambiano i periodi di tempo, vedrai i livelli per il periodo di tempo appena selezionato.
R

KT Candlestick Patterns Scanner is a Multi-Symbol and Multi-Timeframe scanner that fetches and shows various candlestick patterns on 28 currency pairs and 9 time-frames concurrently . The scanner finds the candlestick patterns by loading the KT Candlestick Patterns indicator as a resource in the background.
Features
The scanner can find the candlestick patterns on 252* combinations of symbols and time-frames from a single chart. Open the signal's chart loaded with a predefined template with

Configure scaffolding charts and signals based on the scissor pattern, which works great at low times.
Buy and sell signs based on 2 previous candle patterns
It works on the active time form, and when detecting the pattern in 4 time frames, 5 minutes, 15 minutes, 30 minutes and one hour, the alert can be set to notify us of the formation of this pattern.
MetaTrader version 4 click here
How to use:
When there is an opportunity to buy or sell, the marker places a scissors mark on
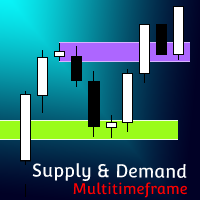
[ MT4 Version ] Supply and Demand Multitimeframe Supply and Demand Multitimeframe is the first indicator in the market that combines multiple aspects like trading volume, price structure and momentum to identify Supply and Demand zones for every asset. The Supply and Demand indicator analyzes simultaneously up to 4 different TFs and represents their information in the current graph. Its interactive UI highlights everytime the price enters a Supply or Demand zone even if the zones are not visible

Only 5 copies of the EA at $30! Next price --> $45 Find charts and signals based on harmonic patterns, which work great in 1-hour timeframes and up.
Buy and sell signs based on different harmonic patterns as follows:
0: ABC_D
1: ABCD_E
2: 3Drive
3: 5_0
4: Gartley
5: Bat
6: Crab
7: Butterfly
8: Cypher
9: NenStar
10: Shark
11: AntiBat
12: AntiGartley
13: AntiCrab
14: AntiButterfly
15: AntiCypher
16: AntiNenStar
17: AntiShark
How to use:
When there is an opportunity to

Offer 249 down from 350 for the next 1 copies. then back to 350 $
Are you tired of using outdated indicators that leave you guessing where to set your profit targets? Look no further than the AK CAP Opening Range Breakout Indicator. This powerful tool is backed by a US patent and has already helped countless traders pass funded challenges like FTMO. We use it daily on our prop traders and internal funds, and now it's available to you as well. The calculation behind the indicator is incredibly
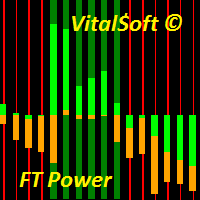
The FT Power indicator system is designed to determine the trend direction of the price chart. Consists of two histograms. The central histogram Bull/Bear Power determines the predominance of bullish or bearish power. When the indicator value is above zero, Bull/Bear Power shows that the bulls are strong, and when the histogram goes below 0, the bulls are exhausted and further growth becomes doubtful. The main histogram is used to determine the trend or flat sections of the chart and confirm the

Indicatore unico che implementa un approccio professionale e quantitativo al trading di reversione. Sfrutta il fatto che il prezzo devia e ritorna alla media in modo prevedibile e misurabile, il che consente regole di entrata e uscita chiare che superano di gran lunga le strategie di trading non quantitative. [ Installation Guide | Update Guide | Troubleshooting | FAQ | All Products ]
Segnali di trading chiari Incredibilmente facile da scambiare Colori e dimensioni personalizzabili Implementa

Il filtro Kolmogorov-Zhurbenko può essere considerato come una speciale funzione di finestra progettata per eliminare le perdite spettrali. Questo filtro è ottimale per uniformare le serie storiche stocastiche (incluse quelle finanziarie). L'indicatore basato su questo filtro contiene i seguenti parametri: iLength - il periodo della finestra rettangolare originale utilizzata per costruire il filtro. Il valore valido è 2 - 255. iDegree - ordine del filtro. Se iDegree=0, si otterrà una media mobi
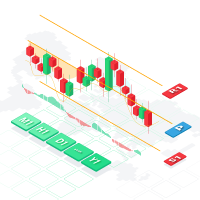
Disegna i punti pivot Traditionnal, Fibonacci, Woodie, Classic, Demark, Camarilla per qualsiasi timeframe
Supporta tutti i tipi di pivot Traditionnal, Fibonacci, Woodie, Classic, Demark, Camarilla Supporta qualsiasi timeframe (M1...H1...D1...MN1...Annuale) Supporto server ora legale Supporta la sezione giornaliera del forex dall'apertura di Sydney alla chiusura degli Stati Uniti Supporta il trading di criptovalute Riempi il divario tra il pivot e la tendenza, molto utile
I punti pivot mostr
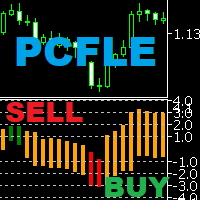
PCFLE Histogram (Price Change From the Last Extreme) - plots the percentage movement from the last extreme. Can be used for graphical representation of percentage movement from last lowest low to current high / from last highest high to current low. Input parametters: InpDigits - the number of decimal places displayed on the y-axis You can set colors and horizontal levels in the indicator properties. Examples of how to trade with the indicator can be found in screenshots.

Mette in evidenza le sessioni di trading sul grafico
Versione a pagamento del prodotto Trading_Sessions_Indicator_Free con la possibilità di personalizzare l'inizio/fine delle sessioni.
L'indicatore delle sessioni di trading evidenzia l'inizio e la fine di ogni sessione di trading.
[OPTION:] Asian session Open Asian session Close Asian session OpenSummertime Asian session CloseSummertime European session Open European session Close European session Open European session Close Timeshift

This indicator is the advanced edition of WRP&KD support resistance designed according to the combination of WPR, Stoch, RSI, CCI, and tick volume indicators. You can add other timeframe's support and resistance on the current chart. When WPR, Stoch, RSI, CCI goes up the same time quickly and the volume become larger, the price may meet strong resistance, many times short order will take profit, but if the price break through it, Long positions are more likely to be profitable, and the

RSI Scanner is a multi symbol multi timeframe RSI dashboard that monitors Relative Strength Index indicator for price entering and exiting overbought and oversold in up to 28 symbols and 9 timeframes.
Download Demo here (Scans only M1, M5 and M10) Settings description here MT4 version here
RSI Scanner features: Signals RSI entering and exiting the overbought and oversold zones. Monitors 28 customizable instruments and 9 timeframes at the same time. Supports all 21 timeframes of Metatra

Benefits of the Surfboard indicator :
Entry signals without repainting If a signal appears and is confirmed, it does NOT disappear anymore, unlike indicators with repainting, which lead to major financial losses because they can show a signal and then remove it. perfect opening of trades The indicator algorithms allow you to find the Peak and floor position to enter a deal (buy or sell an asset), which increases the success rate for each and every trader using it. Surfboard works with any asse

La media di Lehmer può essere considerata come una funzione finestra, i cui coefficienti di peso dipendono dai valori delle variabili utilizzate nel calcolo. Questa media non è lineare perché nel suo calcolo viene utilizzata l'esponenziazione. Le caratteristiche dell'indicatore dipendono da due parametri: iPeriod - periodo dell'indicatore, il valore valido è maggiore o uguale a 2; iPower - esponente, che viene utilizzato durante il calcolo dei valori dell'indicatore. L'intervallo valido è c

its not just an Indicator. its a trading system I'm working on for 3 years and also would be updated you don't need any thing else to trade because its a price action indicator that shows all static and dynamic support and resistance this indicator contains 7 lines that gives us dynamic support and resistance also when main lines (white ones) become flat for 26-52 periods they show strong levels. you can find consolidating areas, strong downtrend(in Green channel) and strong uptrend(in Red Chan
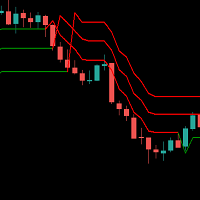
Supertrend indicator uses a combination of a moving average and average true range to detect the trend of a trading instrument.
Supertrend indicator for MetaTrader 5 easily shows the trend as a line following the price.
USAGE THIS INDICATOR If the closing prices are above Supertrend Line, there is a Bullish sentiment at that moment. The opposite is a Bearish sentiment. Three green lines - Strong Bullish sentiment. Three red lines - Bearish sentiment.
For BUY : - Three green lines and pric
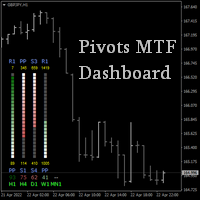
Se fai trading per livelli, allora questo indicatore fa per te.
L'indicatore mostra i livelli di supporto e resistenza per i periodi di tempo selezionati, mostrando inoltre quanti punti ai livelli più vicini, nonché tra quali livelli il prezzo attuale è sotto forma di scala di colori e percentuali.
La posizione in qualsiasi punto del grafico, la possibilità di scalare, l'offset di calcolo tenendo conto della differenza oraria del tuo broker, la scelta dei colori e di altri parametri ti perm

AIS MT5 INDICATOR 5 ALL INCLLUSIVE SET
GUIDE
CHAPTER 1 IMPORTANT INFORMATION <1> THIS INDICATOR IS ONE OF THE SERIES OF NEW AIS INDICATORS AIS MT5 INDICATOR 1 =ADVANCED CLASSIC= AIS MT5 INDICATOR 2 =MULTIFRAMES= AIS MT5 INDICATOR 3 =LINES= AIS MT5 INDICATOR 4 =MARKET PROFILES= AIS MT5 INDICATOR 5 =ALL INCLUSIVE SET
CHAPTER 2 GENERAL FEATURES OF THE SERIES
<1> AIS MT5 INDICATOR 1 =ADVANCED CLASSIC= < DEVELOPMENT PAUSED > DISPLAYS MAIN TIME POINTS AND PRICE LEVELS OF THE CHART

Ayuda a interpretar la tendencia del precio de mercado de acuerdo a las mediciones en tiempo real, ideal para reforzar los resultados mostrados por el RSI las bandas de Bollinguer. Recuerde que el mercado de instrumentos financieros es altamente volatil, no opere con dinero que ponga en riesgo su estabilidad financiera. Solo use fondos que este dispuesto a perder. Resultados pasados no garantizan resultados futuros. Mantenga Siempre control sobre el riesgo.

The Market Sessions Indicator for MT5 helps you predict market turnarounds by detecting major supply and demand areas. These pivot points tend to occur after a new session has started and the previous one is still open. It is also used to gauge how many points or pips the market moves on average during a session. This helps us to place better our take profits and stop losses. The indicator works on all forex pairs, gold, silver, commodities, stocks, indices and any other instrument that yo

The US Dollar Index, also known as DXY, is used by traders seeking a measure of the value of USD against a basket of currencies used by US trade partners. The index will rise if the Dollar strengthens against these currencies and will fall if the Dollar weakens against these currencies. Plan your technical analysis of the US Dollar Index by tracking its price in the chart and keep up with the latest market movements with news, advice pieces, and the dollar index forecast. The U.S. dollar index (

Trend Entry Indicator Your Trading will Be easier with this indicator!!! This Indicator is Developed To make our trading life easier. Get an Arrow for Entry with Take Profit and Slop Loss marks on chart. - Indicator is Based on trend, because thats what we all want we want to follow the trend "it's our friend". - Based on Levels, price action and oscillators. - It works on all currency pairs, all indices, metals and stock. - it works on all pairs/indexes on Deriv including Boom and Crash. - Tim
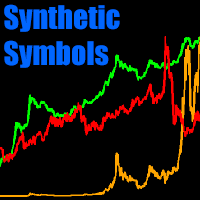
Esegui qualsiasi operazione tra i tuoi simboli terminali (o quelli personalizzati) per creare simboli sintetici personalizzati : scale logaritmiche, performance relative (stock vs SP500, oro vs argento...), indici di valuta... le possibilità sono infinite! Puoi eseguire qualsiasi operazione matematica tra simboli e costanti candela per candela. Sono incluse funzioni per ottenere il minimo [min(a,b)] o il massimo [max(a,b)] tra 2 valori e la radice quadrata [sqrt(x)], valore assoluto [abs(x)]

UN INDICATORE PER TUTTI Pip Scalper è per le tendenze dello scalping. Rimani nelle tendenze più a lungo con questo indicatore. Funziona su tutti i tempi e le risorse. Raccogli pip giornalieri con questo strumento. Usa la media mobile 200 per filtrare le operazioni. Si consigliano tempi più brevi. Utilizzare per il day trading.
Informazioni e modalità di utilizzo:
Pips Scalper si basa sul trend trading a lungo termine. Acquista in blu Vendi su Rosso Usa 200 medie mobili come filtro e fai

Description Price action patterns detection that can work as triggers in any trading strategy, It include Flag, Flag Top, Flag 1234, and micro pullback patterns Support: We create great tools for the entire trading community. Most of them are free. If you believe in what we do Support Us Here. How is this indicator useful? You can use the indicator signals as a trigger to entry in the market and complement any trading strategy. Components Note 1: This indicator should only be considered a
You can identify the strength of the main forex currencies with this tool. You can combine it with different styles and get the best strategy out of it. It has very high power. It can be customized.
MT4 version
This indicator will have many updates and special settings will be added to it.
You can contact us via Instagram, Telegram, WhatsApp, email or here. We are ready to answer you.
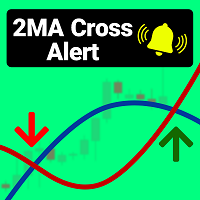
This indicator setup two Moving Average indicators and when the smaller Moving Average (2) crosses the larger one (1) , you will be notified by Popup alert, mobile notification, or Email.
If your strategy works with two Moving Average indicators, you do not need anymore to constantly and tediously look at the chart. You should just add this indicator to the chart according to your required settings, and whenever the defined cross (up or down) is done, it notifies you and you wouldn't miss the
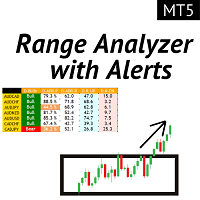
L'intervallo medio giornaliero mostra l'intervallo di pip medio di una coppia Forex misurata in un certo numero di periodi. I trader possono utilizzare l'ADR per visualizzare la potenziale azione sui prezzi al di fuori del movimento medio giornaliero. Quando l'ADR è al di sopra della media, significa che la volatilità giornaliera è superiore al normale, il che implica che la coppia di valute potrebbe estendersi oltre la sua norma.
Il nostro Analizzatore ADR è composto da 5 caratteristiche pri

AUTO MIDAS VWAP Volume Weighted Average Price (VWAP) is a trading benchmark commonly used by Big Players that gives the average price a Symbol has traded throughout the day. It is based on both Volume and price.
Commonly, MIDAS VWAP damand you to determine the initial point of analysis. This indicator plots automatically based on ZigZag Approach.
You will be able to use up to 3 HIGH MIDAS VWAP's and 3 LOW MIDAS VWAP's.
Wish the best trade results!!
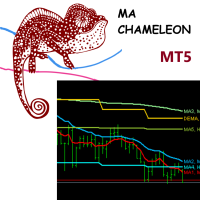
This indicator was developed by me, based on my experiences during my long term daily trading. It allows to get an excellent and compact overview about the current market situation without to have to monitor multiple charts. The default settings are widely used by traders. For example on sites like forexlive.com: https://www.forexlive.com/technical-analysis Features: The Moving Average Swiss Knife-like indicator for Daytraders Allows to setup of up to seven different MAs (MA and DEMA) to use on

The Market Sessions Indicator for MT5 helps you predict market turnarounds by detecting major supply and demand areas. These pivot points tend to occur after a new session has started and the previous one is still open. It is also used to gauge how many points or pips the market moves on average during a session. This helps us to place better our take profits and stop losses. The indicator works on all forex pairs, gold, silver, commodities, stocks, indices and any other instrument that your

Supertrend indicator uses a combination of a moving average and average true range to detect the trend of a trading instrument.
Supertrend indicator for MetaTrader 5 easily shows the trend as a line following the price.
Triple SuperTrend Histo indicator calculate three supertrends to show the trend as a histogram. Changing the color from red to green means you can BUY , from green to red means you can SELL .
Description of the method of drawing a histogram. The price is above the EMA 20
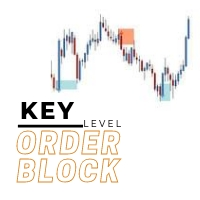
The key level order block indicator automatically draws order-blocks for you on the chart. The indicator compliments any strategy and can also be used as an independent tool. It can work with smart money concepts, harmonic patterns, supply and demand, flag patterns, Quasimodo strategy and many more.
Advantages
The key level order block DOES NOT RE-PAINT, giving you confidence when a signal appears and also helps when looking back. The key level order block includes an on/off button on th

Questo indicatore si basa sulla trasformata discreta di Hartley. L'utilizzo di questa trasformazione consente di applicare approcci diversi durante l'elaborazione di serie temporali finanziarie. Una caratteristica distintiva di questo indicatore è che le sue letture si riferiscono non a un punto del grafico, ma a tutti i punti del periodo dell'indicatore. Durante l'elaborazione di una serie storica, l'indicatore consente di selezionare vari elementi della serie storica. La prima possibilità di

Description: The Multi POC displays multiple Point Of Controls on one chart. This Indicator is also already included in the "VolumeProfile" Indicator .
Features: Customizable Range POC Customizable section POCs with VAL&VAH lines Works on all timeframes Drag & Drop for live calculation
Support: The indicator is constantly being developed and improved. Please do not hesitate to contact me via the MQL5 Platform. I am very grateful about any Bug report, so that i can constantly improve the ind
Questo filtro si basa sui polinomi di Bessel. Il suo principale vantaggio è un piccolo ritardo. Un'altra caratteristica di questo filtro è la sua elevata sensibilità agli ultimi valori delle serie temporali finanziarie. Per questo motivo, l'indicatore evidenzia i movimenti di prezzo attivi, attenuando le deviazioni del rumore. Oltre alla variante classica, all'indicatore sono stati aggiunti come funzione di ponderazione i logaritmi dei coefficienti di Bessel. In questo caso, l'indicatore risult
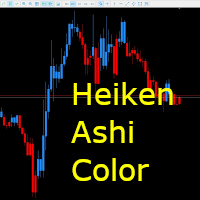
Change the timeframe of a subchart in bulk Change the scale of a subchart in bulk
Reflect only the color of the average bar on the chart
Display the high and low prices of the previous month, the previous week, and the previous day
Indicator.
When the average bar is displayed, it will be difficult to see the chart pattern by all means, so only the color is reflected. This makes it difficult to overlook the shape of candlesticks, such as pin bars and reversals.
It can be recommended f
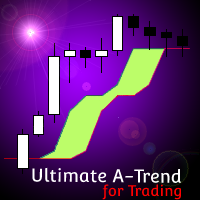
[ MT4 Version ] Ultimate Alpha Trend MT5
Ultimate Alpha Trend is the first trend indicator, which combines volatility, volume, average price and momentum. The results is a highly versatile representation of trendy and sideways market conditions, highlighting, at the same time, significant supply and demand levels. The Ultimate Alpha Trend indicator can be used to find entry oportunities and to set SLs taking into consideration current market volatility, volume and momentum. Besides that, the in
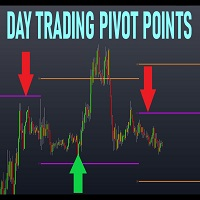
Novice or Expert, our top of the line multi-time span Turn Prof will upgrade your exchanging and carry you extraordinary exchange amazing open doors with the Help and Obstruction levels that experts use.
Turn exchanging is a straightforward compelling technique for entering and leaving the market at key levels and has been utilized by experts for quite a long time and chips away at all images: Forex, Crypto, Stocks, Indicies and so on.
Turn Prof carries premium levels to the broker where th
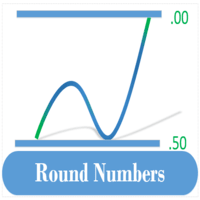
The Round Number Drawer is an indicator that automatically draw lines or zones at the psychological levels (00 or 50) as the market moves. New lines are drawn as the market moves while the old lines are deleted. This ensures that your chart is clutter-free. The user specifies the number of lines preferred on the chat, and the indicator keeps the number of lines constant. The indicator plots two types of levels, the Main Level (00 levels e.g. USDCAD 1.33000, 1.34000) and the Sub Level (50 levels

Supertrend indicator uses a combination of a moving average and average true range to detect the trend of a trading instrument.
Supertrend indicator for MetaTrader 5 easily shows the trend as a line following the price.
You can use the second my indicator: You will see 3 supertrends and EMA 200 lines on the screen.
Working with my product :
https://www.mql5.com/en/market/product/80692

!! FLASH SALE !! Over 80% off !! For ONE week only. Now only $47 - normally $297!
Buy And Sell Arrows On The Chart When The Trend Is About To Continue. Sends Alerts – On MT5 To Your Phone To Your Email.
Does not repaint.
Works on any pair, any timeframe. (Just ajust the settings for your pair and timeframe.)
10 Activations allowed so you are free from limitations
See an example of alerts from today (23 May 2020) using this and 2 other indicators here .
MT4 version here.
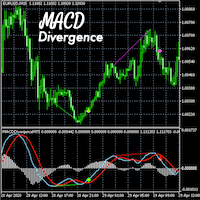
MACD Divergence Detector MT5
- Non-repainting - Live divergence detection - Accurate MACD indicator - Includes 10 indicator buffers - EA friendly - Includes useful customizable settings - Decide which buffers to display on the chart and their colors
The MACD Divergence Detector for MT5 is an accurate and useful tool for detecting and displaying MACD divergences and good places to take long and short trades. It includes 10 buffers and customizable settings. This tool does not repaint and ca

Volume Profile Indicator used by professional Traders at Traders Inside Ltd. If you want to succeed in trading you need to know if current price is cheap, expensive or fair valued. Key features: Fair price (Point of control, POC), high and low price zones (POH, POL) POC in different timeframes for better orientation Symbol and timeframe Chart resize on open positions/orders, VPRmax/min Historic POC - see, how POC has changed the last periods Button to show/hide VPR
Calculated Bars (best results
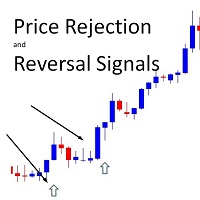
!! FLASH SALE !! Over 80% off !! For ONE week only. Now only $47 - normally $297! >>> Ends on 30 June 2023 - Don't miss it!
Buy And Sell Signal Arrows On The Chart When The Price Is About To Reverse. Also Sends Alerts –On MT5 To Your Phone To Your Email.
Does not repaint.
Works on any pair, any timeframe. (Just ajust the settings for your pair and timeframe.)
10 Activations allowed so you are free from limitations
MT4 version here .
Spreads from 0.1pip RAW/ECN Acco

Do you, like me, like to trade with the trend? Then this indicator will help you! Rainbow Trend is a trend indicator, which uses several Moving Averages on the chart.
It measures different trend strenght zones for different periods: very long term, long term, mid term, short term and very short term.
Each zone has its color, and it is possible to have sound alert when the prices leaves a zone and enters another.
Its configuration is very simple. If you find any bug or have any suggestions, co
!! FLASH SALE !! Over 80% off !! For ONE week only. Now only $47 - normally $297! >>> Ends on 30 June 2023 - Don't miss it!
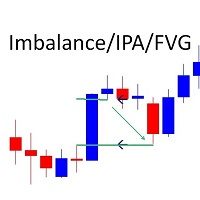
Marks Market I mbalance / Improper Price Action / Fair Value Gaps on The Chart As traders continue to search for the best trading indicators to guide their investments, the I mbalance / I mproper P rice A ction / F air V alue G ap I ndicator has become increasingly popular. This indicator helps to identify opportunities for taking profit . The indicator begins
Александр Сергеевич Рыжков, [12.05.2022 7:02] SWI - Spread Widening Indicator.
Индикатор расширения спреда - должен быть в арсенале каждого опытного пользователя платформы Meta Trader.
Данный индикатор позволяет анализировать, аномальные ночные и новостные расширения спредов,
с помощью чего дополнительно максимизировать свою прибыль и снизить свои риски.
Для использования необходимо просто установить на график и подобрать цвет подходящий под ваш график.

!! FLASH SALE !! Over 80% off !! For ONE week only. Now only $47 - normally $297! >>> Ends on 30 June 2023 - Don't miss it!
Buy and Sell Arrows when price is about to retrace. It Also Sends Alerts – On MT5 To Your Phone To Your Email
Does not repaint.
Works ony any pair, any timeframe.
10 Activations allowed so you are free from limitations
See an example of alerts from today (23 May 2020) using this and 2 other indicators here .
MT4 Version here . Spreads from 0.1p

MACD with fast and slow EMA. Moving average convergence divergence (MACD) is a trend-following momentum indicator that shows the relationship between two moving averages of a security's price . The MACD is calculated by subtracting the fast-period exponential moving average (EMA) from the slow-period EMA. Setup options: Fast EMA period Slow EMA period Signal EMA period Applied price Indicator window height Color MACD Color Signal Color Histogram
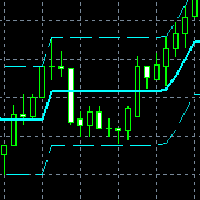
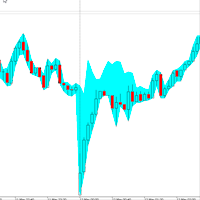
It is a new indicator that frames the price movement and tracks it. It consists of oscillation channel and its center line CL . For its calculation it is only necessary to introduce the amplitude of the channel. Because of this, it is a non-lagging indicator as it is not calculated based on a number of previous candlesticks. It removes any level of noise , showing the underlying price movement cleanly via the center line . It allows you to easily identify the beginnings a
MT4 Version A versatile tool
You do not need any other tools with this tool.
You can enable or disable all indicators.
Their values are adjustable.
In the first line you will see a summary of your account status.
p: The amount of your profit or loss
BP: The amount of your daily profit based on the balance
EP: Equity daily earnings
WP: Your weekly profit
MP: Your monthly profit
The next line shows each of the time frames you selected.
Chikou: The Chikou process
KT: The trend of t
Average Daily Range with factor target and more functions (ADR)
Hello traders,
The upgraded ADR dashboard now is also for MT5 much more better and more convenient for day trader, try it to experience the good things!
How to use Average Daily Range (ADR) Indicator?
ADR is just a simple indicator tool to help trader identify the daily average range of an instrument. So for example we have the pairs EURUSD and that pairs usually makes a peak and bottom during the trading day an

Every indicator has its advantages and disadvantages. Trending ones show good signals during a trend, but lag during a flat. Flat ones thrive in the flat, but die off as soon as a trend comes. All this would not be a problem, if it was easy to predict when a flat changes to a trend and when a trend changes to a flat, but in practice it is an extremely serious task. What if you develop such an algorithm, which could eliminate an indicator's flaws and enhance its strengths? What if such an algorit

The most sensitive indicator you've ever seen! And now with Alerts
POscillator Alert is a sensitive indicator that finds each trend direction change in every timeframe and then notifies you with the necessary alarms. It's a new version of the POscillator Indicator, with the addition of its alarm sending capability. The Indicator can send multiple alerts: email, mobile phone notification, alert window and alert sound. All of these different alarms are optional and you can choose the ones you
Multiple Timeframe Trend Alert
I. Overview
Real-time analysis of trends on nine time frames (M1, M5, M15, M30, H1, H4, D1, W1, MN1) based on the calculation of highs and lows using swing highs and lows and Dow Theory. Indicator sends notifications (alerts) when the trends of the specified time frames match.
II. Advantage
Since this indicator notifies you when a trend coincides, you can seize trading opportunities without having to stay on the charts.
In addition, by introducing this i

New Trend Alerts finds new trends at the changing bar very quickly. If the trend has enough power and a quality up/down angle, then the indicator sends multiple alarms to alert you: via email, mobile notification, alert window and alert sound. All of these different alarms are optional, and you can choose which ones you would like to use. The indicator calculates the derivative of the price chart to reveal the slope of price curve and its sign changes. Red bars indicate a positive sign or uptre
John Bollinger's normalized MFI (Fund Flow Index). Bollinger bands are used to calculate overbought/oversold areas. It takes three input parameters: MFI period - MFI calculation period MFI Applied Volume - Calculates the volume of MFI transactions BB period - Calculation period of the Bollinger band BB deviation - Brin deviation Calculation: NormMFI = (MFI-BL) / (TL-BL) Among them: TL = BBands(MFI, BB period, BB deviation, UPPER_BAND) BL = BBands(MFI, BB period, BB deviation, LOWER_BAND) MFI - M

Indicatore di livello superiore dei prezzi esatti di acquisto e vendita. Adatto a tutti i simboli, devi solo scegliere un'attività di trading conveniente.
L'indicatore mostra i livelli di rimbalzo del prezzo con gli obiettivi per entrare e uscire da una posizione.
Il commento ad ogni livello afferma: cosa fare a livello (ACQUISTA/VENDI); prezzo d'ingresso; prezzo di uscita obiettivo. Nei parametri devi selezionare la tua attività di trading: Investitore a lungo termine Investitore a medio t

///XShea///
Basato sulla logica dell'indicatore (MFI) applicata ai passaggi di livello. Solo Scalping
Dopo diversi mesi di test e applicazione in conto reale ho deciso di metterlo a disposizione
degli acquirenti questo prezioso strumento con il quale se vengono seguite le regole corrispondenti
Sarai in grado di ottenere ottimi profitti sui tuoi conti forex.
Questo indicatore è programmato per inviare avvisi sonori e notifiche

CHART OBJECTS: Blue box : Bullish Order Blocks (OB) Red box : Bearish OB Orange box : Mitigated OB. Price bounce from this area the made a new high/low Light gray box : Price bounced from this area but did not made a new high/low Dark gray box : Broken OB. Filled boxes : TimeFrame 1 Order Blocks
Unfilled boxes : TimeFrame 2 Order Blocks
INDICATOR SETTINGS: Order Block Required Length: Required number of subsequent candles in the same direction to identify Order Block. Default value: 5 Im

In this indicator, Heiken Ashi candles are calculated with the most optimal method. You can also customize the results by adjusting the amount of period and method input. But the most important advantage of this indicator is the adjustment of the time frame value. You can use this to calculate the Heiken Ashi chandels to See in time frames with lottery in the lower time chart. In this case, you get the best signal to buy or sell using two or more Heiken Ashi indicators with different timeframes

Basato sull'indicatore RSI aiuta a capire quando il trend sta cambiando in base ai periodi impostati. E' possibile impostare intervalli di tempo personalizzati e colori delle frecce. Segui l'andamento e valuta anche in base alla volatilità dell'asset. Funziona con ogni coppia di valuta ed è da considerare come un'aiuto ad una valutazione. Puoi associarlo con altri indicatori.

Quantitative analysis software, this indicator came from another country and thanks to my network today I can share this software with you!
Russian Tool plots arrows on your asset, indicating the trend the asset will enter, easy to use and easy to install indicator
We have been working with robots and indicators since 2018! We came to MQL5 to be able to bring better benefits at the time of payment by our customers!,
our Instagram where we post daily stories of operations: https://www.inst
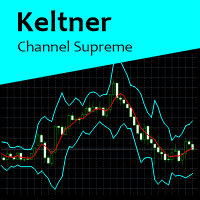
Keltner Channel Supreme is a indicator based on Keltner Channels, with some configuration besides period and Keltner multiplier factor. In this indicator, it is possible to change to an exponential moving average and if prices will be calculated according to close price or typical price. This indicator works on all graphics. If you have some doubt, please PM.
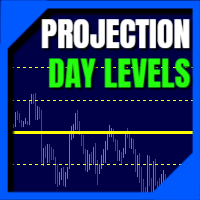
Daily Projection Levels , as the name implies, is an indicator that project the price changes in percentage above and below the opening of the day (or closing of the previous day.
These are "psychological" support and resistance areas where price tries to retrace or break out.
With this you have a powerful tool to predict what these zones will be! You can define which projection levels you want (up to 5 above and below), in addition to have alert messages and visual customization. If you want
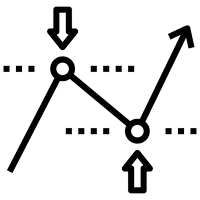
Questo indicatore mostra i livelli ottimali di take profit e stop loss. Questi livelli sono calcolati sulla base di dati storici. Al primo avvio, l'indicatore viene addestrato sulla cronologia. Dopodiché, valuta la probabilità che il prezzo superi questo o quel livello in futuro e seleziona le opzioni più ottimali per piazzare ordini stop. Ad esempio, i valori di take profit sono selezionati in modo che il profitto sia massimo e la probabilità che il prezzo raggiunga il suo livello sia la più a

Donchian Channel DC is the indicator of Donchian Channels, that plots maximum and minimum values of a specific period, besides mean value line. It´s possible to configure simple period for analysis and the indicator will plot all three values. You can trade with this indicator as trend or reversal, according to each strategy. Do not let to test others indicators as soon as others expert advisors.
Il MetaTrader Market offre un luogo pratico e sicuro dove acquistare applicazioni per la piattaforma MetaTrader. Scarica versioni demo gratuite di Expert Advisors e indicatori direttamente dal tuo terminale e testali nello Strategy Tester.
Prova le applicazioni in diverse modalità per monitorare le prestazioni ed effettuare pagamenti per i prodotti desiderati, utilizzando il sistema di pagamento MQL5.community.
Ti stai perdendo delle opportunità di trading:
- App di trading gratuite
- Oltre 8.000 segnali per il copy trading
- Notizie economiche per esplorare i mercati finanziari
Registrazione
Accedi
Se non hai un account, registrati
Consenti l'uso dei cookie per accedere al sito MQL5.com.
Abilita le impostazioni necessarie nel browser, altrimenti non sarà possibile accedere.