Technische Indikatoren für den MetaTrader 5 - 57
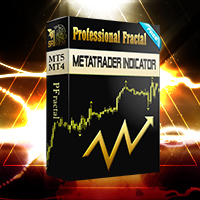
This indicator is based on the same famous fractal indicator with a slight difference:
MetaTrader version 4 click here
Advantages:
Works on all instruments and time series,
Does not redraw its results,
Comparison depth is adjustable,
Works well with any popular strategy,
Adjust the power of fractals
Input settings:
Number of comparisons - The number of candles that each side selects for comparison.
Marker distance from the candlestick
You

This is an advanced Trend Indicator, specifically designed to detect market trends, This MT5 indicator can be used on any symbol . It draws two types of Clouds Buyers & Sellers. A New Trend is then plotted in a break from an older trend. This Powerful indicator is an excellent tool for scalpers or swing Traders. it does not redraw nor Repaint, it's Most reliable when applied on higher timeframes... Tried and Tested on Volatility 75 Index https://t.me/ToyBoyLane
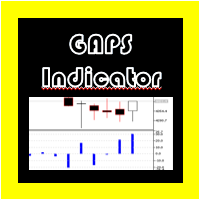
GAPS-Indikator Metatrader 5
Für einige der Strategien, die in Indizes, Aktien und anderen Vermögenswerten verwendet werden, wird der GAP jeder Kerze normalerweise gemessen, aber wenn wir dies manuell tun möchten, kann uns dies zu Berechnungsfehlern führen.
Aus diesem Grund wurde „GAP Indicator“ geschaffen, der automatisch den PIPS-Wert jedes der GAPS anzeigt, die zwischen jeder der Kerzen präsentiert werden, und einen Alarm erzeugt, wenn sie erscheinen, wenn die Option aktiviert ist.

(Automatische Übersetzung) Die meisten Händler kennen den berühmten japanischen Heikin-Ashi- Indikator, der im 18. Jahrhundert von Munehisa Homma entwickelt wurde. Es wird manchmal Heiken-Ashi geschrieben, aber seine Bedeutung bleibt dieselbe, nämlich „durchschnittlicher Balken“ auf Japanisch. Dies ist eine Implementierung des sehr bekannten Heikin-Ashi- Indikators, jedoch mit einigen zusätzlichen Funktionen. Zum einen ermöglicht es die Gewichtung seiner Werte nach dem Volumen , sei es das Tick-

This indicator simplifies your entry zones by displaying the areas where you can plan your entry that potentially could give you high risk/reward ratios. Other than picking the most optimal entry points, the Hot Zone indicator can act as your typical support/resistance indicator for pullbacks for all timeframes. You can use this indicator as the only trading indicator or use it with another indicator for reentry purposes. Besides, when using Hot Zones, the risk/reward ratio should be well abov

Ronal Cutrim has been a dedicated mathematician for 14 years and has more than 10 years of experience in the financial market.
The concept of the theory is simple, find imbalance between buyers and sellers. Which makes a lot of sense, because nothing goes up forever, nothing falls forever. When you find an asset with a mathematical probability of unbalanced equilibrium, it is a great way to get into trading: TUTORIAL: Turn on the subtitles, the video is subtitled

Indicator that shows you at any time the current number of closed deals as well as profit and loss totals of the closed deals of the account that you're logged into for a configurable period.
To do this, it is best to load Deals and "Complete history" in the account history in the terminal and then enter the desired period in the indicator (e.g. 2022.01.01-2023.01.01 would be for calendar year 2022).
Input options:
- Period (Attention: corresponding data must be loaded into the account h

Advanced Indicator Scanner is a multi-symbol multi-timeframe scanner that works with hundreds of custom indicators available across the web including mql5 website market and codebase indicators.
Advanced Indicator Scanner features:
Scans your indicator in 28 customizable instruments and 9 timeframes. Monitors up to 2 lines(buffers) of an indicator. Showing of indicator value on buttons. You can choose between 3 alert modes: Single symbol and timeframe Multiple timeframes of a symbol Multipl
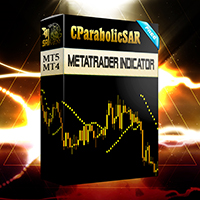
This indicator is based on ParabolicSAR. This indicator does not change the trend easily and does not change the trend until it receives a clause and approval. This indicator can be used for trail stop or trend detection.
MT4 Version
benefits:
Works on all instruments and time series,
Does not redraw its results,
Comparison depth is adjustable,
Works well with any popular strategy,
The power of the areas is adjustable,
We assure you that we we
Indicator - HotKeys allows you to make your work in the MT5 terminal more comfortable
Indicator features: - Calling the creation of an object on the chart with keyboard shortcuts - Enable/disable auto scroll - Quick switching between main custom templates
Preset keyboard shortcuts: - Rectangle - Q - Fibo - E - Horizontal level - R - Cut - T - Auto Scroll - A
You can assign other keyboard shortcuts (capital letters of the English alphabet only)
Important: The indicator does not allow
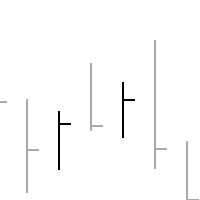
Dieser Indikator hat nur eine Aufgabe - die Darstellung des Charts als HLC-Balken (Balken ohne offene Kurse).
Außerdem weisen diese Bars zwei Besonderheiten auf: Die Farbe des Balkens wird durch den Vergleich des Schlusskurses des aktuellen Balkens mit dem Schlusskurs des vorherigen Balkens bestimmt, so dass es keine Verwechslungen aufgrund von Kurslücken (Gaps) gibt. Ein Beispiel für diese Situation ist in den Screenshots zu sehen (Standard-Kerzenleuchter werden mit den abgebildeten Balken v

Hello Traders
I have created this indicator to Catch SPIKES on Crash1000, Crash500 and Crash300. Follow the below mention instruction for better Result
1. When Red arrow pop up on the Chart, Take a Sell entry
2. Stay in trade until price break below from entry
3. Do not hold trades after all trades went in Blue
4. Keep adding position until spike cross below from intial entry
See Example for more assistance

Der Indikator hilft, gleichzeitig nach einer gewissen Korrektur in einen Trade einzutreten, der dem Trend folgt. Es findet starke Trendbewegungen eines Währungspaares auf einer bestimmten Anzahl von Balken und findet auch Korrekturniveaus für diesen Trend. Wenn der Trend stark genug ist und die Korrektur der in den Parametern angegebenen entspricht, signalisiert der Indikator dies. Sie können unterschiedliche Korrekturwerte einstellen, besser geeignet sind die Werte von 38, 50 und 62 (Fibonacci

A machine translation from English product description was used. We apologies for possible imprecisions. Es wurde eine maschinelle Übersetzung der englischen Produktbeschreibung verwendet. Eventuelle Ungenauigkeiten bitten wir zu entschuldigen. Ein Visualisierungssystem für beliebte Candlestick-Preisaktionsmuster. Nach dem Anbringen markiert der Indikator automatisch die nächsten Muster auf dem Diagramm: Pinocchio Bar – ein kleiner Körperriegel mit einer langen „Nase“, einem sehr bekannten umgek

This simple, yet powerful indicator is very good way to determine actual S/R levels. It's main purpose is making your overview on markets much better.It has built-in arrow signal system, which should be used along with MT indicators for best results.Just try it.
Recommended MT indicators to use along:
Bollinger Bands (default) RSI (period 3, levels 10/90)

Fügen Sie diesen Indikator zum Diagramm hinzu und stellen Sie die ExtDepth-Einstellung von ZigZag ein
Es gibt eine sofortige Warnung, wenn der Preis den oberen, unteren oder mittleren Kanal der Trendlinie berührt
Merkmale :
-Aktivieren / Deaktivieren von Warnungen in der oberen, unteren oder mittleren Zeile - Fügen Sie eine Pause nach einer Warnung in Sekunden hinzu - Trendkanal anhalten oder fortsetzen mit Schaltfläche auf dem Diagramm - Fügen Sie Frühwarnungen hinzu, indem Sie Punkte im
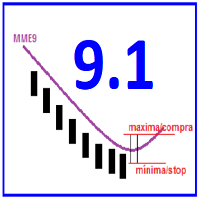
Translate from "Brazil"("PT-BR") Baseado no Setup 9.1 de Larry Williams, Wdi 91 se Adequa a Qualquer Média com o Mesmo Gatilho de Entrada. Experimente.
Como funciona?
Nesse indicador o sinal de compra ou venda acontece quando o fechamento da vela vira a média móvel(Por padrão é MME de 9 períodos) e fica do outro lado da média.
Como usar?
A proposta por Larry Williams é entrar no trade com uma ordem stop um tick acima da máxima do candle com sinal de compra, colocando a ordem de stop loss

BeST Swing Strategy MT5 is a Metatrader indicator based on the corresponding Jim Berg's work about volatility as described in his article "The Truth About Volatitlity" (TASC 2/2005).The indicator consists of 2 channel lines deriving as (MA+/- times the ATR) and can be used as a standalone trading system.The outlier prices of the Market as of the indicator's values can be used for producing Entry and Exit Signals.
Advantages of the indicator
== Uses 2 Swing Strategies
== Never repaints it
Bollinger Band is one if the most useful indicators if used properly. Trend Guard used the parameters based on Bollinger to create a tool that can help traders enter trades at most optimal level. The indicator is useful to all traders since it checks for retracements and changing trend direction. With this indicator, you get the opportunity to open trades early and also lock your profits based on the dotted trend lines that form after a certain level of Bollinger band. We have simplified the ind
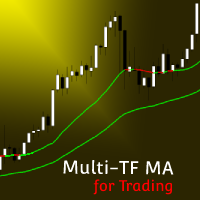
MT4-Version Multi Timeframe MA MT5 Multi Timeframe MA MT5 ist ein Indikator, der die Darstellung von bis zu 3 MAs mit unterschiedlichen Perioden und Zeitrahmen bietet. Auf diese Weise kann der Benutzer Informationen aus einem Zeitrahmen aus anderen Zeitrahmen zeichnen und grafisch darstellen und benachrichtigt werden, wenn einer der MAs einen anderen kreuzt. Multi Timeframe MA ist der erste Indikator auf dem Markt, der Interaktionen mit mehreren Zeitrahmen und eine hohe Anpassungsfähigkeit
KT Bollinger Shots works using a striking blend of the slingshot pattern and the mean-reversion phenomenon applied to financial markets.
In addition, a mathematical algorithm is used with variable deviation to fine-tune the indicator's signals on a different level.
Winning Trade: After a signal, if price touches the middle band in profit, it is considered a winner. Losing Trade: After a signal, if price touches the opposite band or touches the middle band in loss, it is considered a loser.

Introduction to Support Resistance Risk Management Support Resistance is the most trusted technical analysis. However, the risk management for the support and resistance is not practiced often. Hence we provide one effective risk managment method for the support and resistance trader. In the book: Scientific Guide To Price Action and Pattern Trading (Wisdom of Trend, Cycle, and Fractal Wave), how to use Support Resistance is described as well as Fibonacci Analysis, Harmonic Pattern, Elliott Wave
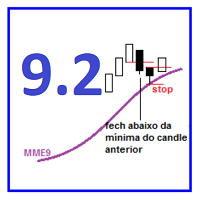
Translate from "Brazil"("PT-BR") Baseado no Setup 9.2 de Larry Williams, Wdi 92 se Adequa a Qualquer Média com o Mesmo Gatilho de Entrada. Experimente.
Como funciona? Nesse indicador o sinal de compra ou venda acontece quando com a continuidade da média móvel(Por padrão é MME de 9 períodos).
Para compra tanto o fechamento quando a abertura da vela precisam estar acima da média, o fechamento precisa ser menor que a mínima anterior e a média precisa estar subindo.
Para venda tanto o fechament
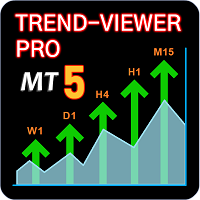
SEE THE TREND ON EVERY TIME FRAME. INTELLIGENT INDICATOR READS PRICE ACTION TO SPOT TRUE MARKET CYCLES AND TREND. This advanced multi-currency and multi-time frame indicator, reads trend in real-time so you always know the trends of the markets you want to trade.
Trend-Viewer Pro has been specifically designed to read the trend of every time frame and every market , simultaneously, making it much easier for you to find markets with time frame correlation , so you can focus on t
PAX BDB Trade Chaos system of Bill Williams (Bearish/Bullish divergent bar). One of the signals of the "Trade Chaos" system of Bill Williams. (First wiseman)
When bar moving away from the "Alligator" indicator and there is divergence on the Awesome Oscillator indicator, it shows a potential point of movement change.
It is based on the opening/closing of the bar, the position relative to the previous ones, the Alligator and AO.
When trading, the entrance is at the breakthrough of the bar(sh

The FX Stewards EA Signals Alert Indicator works with every trading instrument(including synthetic indices). The signals indicator assists with choosing which instrument to trade and the direction to take(follow the trend - the trend is your friend), making it easer for you to enter, re-enter or exit a trade with confidence(you're, however, still required to confirm entry before entering as it might be a false breakout - you'll get multiple contradicting alerts in this instance(mainly in a rangi

Definition : A Market Profile is an intra-day charting technique (price vertical, time/activity horizontal). Market Profile is best understood as a way to see order in the markets. Market Profile was a way for traders to get a better understanding of what was going on, without having to be on the trading floor. The current indicator is developed based on Easy-to-Use architecture including a wide range of visual settings.
Major Features of Indicator : Various Views of Market Profile The indica
Dieser Indicator wird hauptsächlich für meinen SuperDonchain EA genutzt, kann aber auch als einfacher Indicator genutzt werden. Er zeichnet einen Donchain Kanal in das Chart Fenster. Er hat verschiedene Einstellungsmöglichkeiten welche sich auf den Graph auswirken. Weiterhin können die Farben des Graphen eingestellt werden.
Einfach in den Ordner der Indicatoren kopieren und von da in das Chartfenster ziehen. https://www.mql5.com/de/market/product/78025?source=Unknown%3Ahttps%3A%2F%2Fwww.mql5.co
Dieser Indicator wird hauptsächlich für meinen SuperDonchain EA genutzt, kann aber auch als einfacher Indicator genutzt werden. Er zeichnet einen einfachen Supertrend in das Chart Fenster. Er hat verschiedene Einstellungsmöglichkeiten welche sich auf den Graph auswirken. Weiterhin können die Farben des Graphen eingestellt werden.
Einfach in den Ordner der Indicatoren kopieren und von da in das Chartfenster ziehen. https://www.mql5.com/de/market/product/78025?source=Unknown%3Ahttps%3A%2F%2Fwww.m

The indicator draws lines (with line objects) to the close prices of the last closed bars, on selected timeframes. Parameters
Close line 1 close price timeframe - timeframe of the 1st close price Close line 1 color - color of the 1st close price Close line 1 width - width of the 1st close price Close line 1 style - style of the 1st close price Close line 1 max count - the maximum number of lines plotted for the 1st close price, considering the selected timeframe in Close line 1 timeframe parame
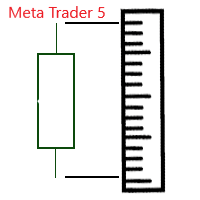
Индикатор отображает размер бара и его направление. ---------------------------------------- Цвета гистограммы: * Красный - Медвежий бар.
* Зелёный - Бычий бар.
* Серый - Цена открытия и цена закрытия равны. * Синяя линия - скользящая средняя.
---------------------------------------- Параметры: - Type of Calculation - Тип расчёта ( High - Low, Open - Close ) - Moving Avarage - Период скользящей средней - Method for MA - Метод усреднения скользящей средней
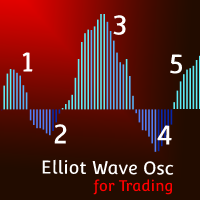
MT4-Version Elliot-Wave-Oszillator MT5 Der Elliot Wave Oscillator MT5 ist ein Indikator, der zur Unterstützung der Elliot Wave-Zählung entwickelt wurde. Die Standardeinstellungen helfen dabei, das Rauschen auf dem Markt herauszufiltern, was eine klare Wahrnehmung der Wellenzahlen in verschiedenen Zeiträumen ermöglicht. Der hohe Anpassungsgrad des Elliot Wave Oscillator ermöglicht es Ihnen, diesen Indikator an Ihre persönlichen Vorlieben anzupassen. Kürzere Zeiträume und schneller reagierende M

Index-Volatilitätstrendindikator.
Haupteigenschaften:
Es wird nur für synthetische Indizes im Binary- oder Deriv-Broker verwendet, die identisch sind. Es hat einen Trendfilter. Es hat einen Tonalarm, um vor einem möglichen Preisverfall zu warnen. Es kann Ihnen mobile Benachrichtigungen senden, wenn Sie es auf ein VPS setzen. Es ist mit dem L566b12-Algorithmus konfiguriert, der für eine bessere Effizienz ausgelegt ist.
So verwenden Sie den Indikator
Es arbeitet in der Zeitlich

TrendHunt is an indicator focus on higher timeframe (H1 and Above) It using breakout strategy, plus MA for filter. Check for Support, Resistance and News before every entry to increase the success rate.
Parameters Moving Average Period - 200 Moving Average Price - Closed Price Entry Period - 20 (Breakthrough 20 High for Long, 20 Low for short) Stop Period - 10 (cross over 10 low for exit long)

Indicator Constant TF Moving Average basically is the same Moving Average indicator, but differently it always shows the price values of chosen time frame. Also, number of periods to show can be selected. Indicators purpose is to use it as support and resistance level in smaller time frames than selected in Input menu. How it looks like you can see in screenshots and video. ---------Main settings-------- Timeframe - choose time frame from dropdown menu Number of periods to show - enter the integ

Upgraded version 3.4 Supply and Demand Indicator , it determines levels of supply and demand by using algorithm such as order blocks , engulfing candle patterns , etc. Signals are visually indicated when the levels are drawn on the chart
Trendline touch and Candle Strick Patterns can also play a role to add as confluence when making trading decisions including `reversal patterns` etc Compatibility : All tradable Instruments ; Currency Pairs, Synthetic indices ,Metals, Crypto, NASDAQ et

The indicator, Big Candle Detect , is based on ATR and Volume to detect candlesticks of buying and selling strength, which is represented through an oscillator indicator. With this indicator you will be able to identify the lateral market, providing better entries according to your strategy.
Big Candle Detect highlights candles with brighter colors when the condition is found, making it easier to identify, in addition to being fully compatible for automation in your EA.
SETTINGS
ATR P
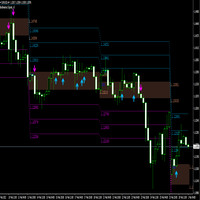
A breakout refers to when the price of an asset moves above a resistance area, or moves below a support area . Breakouts indicate the potential for the price to start trending in the breakout direction. For example, a breakout to the upside from a chart pattern could indicate the price will start trending higher. The indicator works with arrows in case of breakthrough, you also have a level of 1 tp, a level of 2 tp, a level of 3 tp. For more information, welcome to our Telegram Group. https:
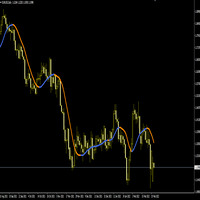
The Hull Moving Average (HMA) attempts to minimize the lag of a traditional moving average while retaining the smoothness of the moving average line. Developed by Alan Hull in 2005, this indicator makes use of weighted moving averages to prioritize more recent values and greatly reduce lag. The resulting average is more responsive and well-suited for identifying entry points. For more information, welcome to our Telegram Group. https://t.me/InfinXx
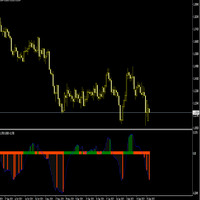
The Slope indicator measures the slope of a linear regression , which is the line of best fit for a data series. A 20-period Slope, therefore, measures the slope of a 20-day linear regression. ... In general, a positive slope indicates an uptrend, while a negative slope indicates a downtrend. How do you use slope Indicator?
By applying the slope indicator to both the price chart and the price relative , chartists can quantify the price trend and relative performance with one indicator. A po

About AIntel
Is there are reason you select RSI 14 or 21? Is there a reason you select EMA 25? Is there a reason you pick these periods for these and any other indicators? Those numbers might have worked 10 or 20 years ago. They might be working for traiding certain currency pair in a certain timeframe.. But they DO NOT give you the best profit and outcome at all times all pairs all trades! AInter is "automated inteligence" series indicators that optimize automatically for best profit so you do

Secreto is a fundamental technical indicator that allows you to assess the current market situation in order to enter the market of the selected currency pair in a trend and with minimal risk. It basically uses the process of identifying the rate of change in price growth and allows you to find entry and exit points from the market. The indicator can be used with an optimal risk-to-reward ratio, it shows good signals. Uses two options for settings. Shows favorable moments for entering the marke

Reservoir is a reversal indicator and is part of a special category of instruments. The indicator not only analyzes the price movement, but also indicates the points of possible reversals. This contributes to the quick and optimal opening of buy or sell orders (depending on the current situation). In this case, the historical data of the analyzed asset is necessarily taken into account. It is the correct implementation of such actions that in many ways helps traders make the right decision in t

Muster-Explorer für Dreiecksmuster wie symmetrisches Dreieck, asymmetrisches Dreieck oder rechtwinkliges Dreieck, Keilmuster wie steigender Keil oder fallender Keil, Expansionsmuster und Trendkanal
Dieser Indikator untersucht sowohl historische Muster als auch aktuelle Muster. Er ist der beste Indikator für diejenigen, die versuchen, Zeit zu sparen, indem sie Trendlinien oder Dreiecke manuell zeichnen und dies für die automatische Analyse der Darstellung der besten Muster im Diagramm verwende

Salinui - Arrow trend indicator, without delay and redrawing, is used by traders in trend strategies in trading in financial markets (Forex, CFD, binary options). The indicator predicts the most likely short-term price movement based on complex mathematical calculations. One of the biggest challenges traders face is finding the right trading system for them. This indicator is designed to detect trends in price movement and allows you to quickly determine not only the direction of the trend, but

Arrow technical indicator without redrawing Vendetta in the Forex market is able to give tips with the least errors. The indicator does not redraw its signals when the price changes. It combines several filters, displaying market entry arrows on the chart.
Every rise and fall is reflected in your emotional state: hope is replaced by fear, and when it passes, hope appears again. The market uses your fear to prevent you from taking advantage of a strong position. At such moments you are most vu
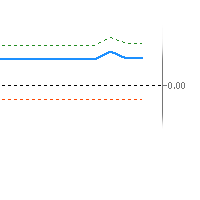
An imbalance indicator that marks imbalance on the chart with zones and gives the amount of imbalance as an oscillator value. There's one line for the amount of short imbalance, one line for the long imbalance and the combined imbalance as a thicker line. The combined imbalance goes above 0 if there's more imbalance above than below the current price and vice versa. The blue thicker line, shows (imblance above - imbalance below). The greeen dotted line shows imbalance above The red dotted line s
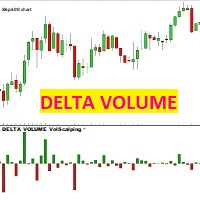
VOLUMENDELTA Volscalping Dieser Indikator zeichnet für jede Preiskerze eine Delta-Kerze, die die Differenz zwischen den gekauften und verkauften Kontrakten darstellt. Die Kerze ist rot und negativ, wenn die im Bid gehandelten (verkauften) Kontrakte die im Ask gehandelten übersteigen, im Gegensatz dazu ist die Kerze grün und positiv, wenn die im ASK gehandelten (gekauften) Kontrakte die im Bid übersteigen.
ACHTUNG: Der Indikator funktioniert nur mit Brokern, die einen echten Marktdatenfluss l
The indicator, Support and Resistance Detect Signal automatically detects support and resistance levels and trend lines, emitting a signal whenever the condition is met, as configured.
It reads support and resistance drawn manually or automatically built into the chart by other external indicators.
Note: Support and Resistance Detect Signal is compatible with almost all external indicators that draw on the chart, support and resistance levels, in addition to trend lines.
Discover our Elit
The indicator, Support and Resistance Detect Signal automatically detects support and resistance levels and trend lines, emitting a signal whenever the condition is met, as configured.
It reads support and resistance drawn manually or automatically built into the chart by other external indicators.
Note: Support and Resistance Detect Signal is compatible with almost all external indicators that draw on the chart, support and resistance levels, in addition to trend lines.
Discover

The indicator "JAC Trend Color Candle" for Meta Trader 5, was created to visually facilitate the trend for the trader. It is based on three parameters, which identifies the uptrend, downtrend and non-trending market. The colors are trader-configurable, and the average trader-configurable as well. trend parameters cannot be configured as they are the indicator's differential.

Passage Victorious is a handy tool, and even if you are used to trading on a clean chart, sometimes you need to take a look at this indicator. If you are not sure how to determine the trend inflection point and are concerned about how to draw trend lines then this indicator is for you. From now on, you do not need to sit near the computer and analyze the price, just use this indicator.
The indicator calculates saturation levels of the price chart. A signal to exit the oversold area is a buy s

Fixation of the Result is a trend indicator, a technical analysis tool that helps determine the exact direction of a trend: either an up or down price movement for a trading pair of currencies. This indicator, although a little late, is still the most reliable signal that a trader can safely focus on. Determining the market trend is an important task for traders.
The indicator is used in the forex markets. One of the main definitions for monitoring the currency market is a trend, which is why

The Signal Sunrise channel indicator automatically builds a trend movement support channel. The price is in its trend movement in a certain range, and not a chaotic spread of the price is unclear in which direction. And if the price deviates within a certain range, then this means that the boundaries of these ranges are support and resistance lines and form a channel.
It is no secret that the wave theory, like many others, is based on observations, however, one of the most important patterns

Element is a Forex arrow indicator that implements a kind of technical analysis based on the idea that the market is cyclical in nature. Follows the market trend with good reliability, ignoring sharp market fluctuations and noise around the average price. Thus, all intersection points will be optimal points at which the movement changes taking into account the indicator period. It catches the trend and shows favorable moments of entering the market with arrows. Displays signals simply and clear

Dependence arrow indicator for forex, futures and binary options without redrawing. It gives a lot of signals, which requires additional indicators to check them. Works only on opening prices. Therefore, reliable and without redrawing. Often signals that went in the wrong direction are canceled out on the next signal.
Unfortunately, most popular indicators in practice give a huge number of false signals, since they all work without any consideration of global trends. That is why in today's co
KF-BB
Professional Bollinger Bands with Alert.
Bollinger bands available in the market are mostly drawn based on simple moving average . KF-BB is the first bollinger bands that can draw the center line using all the usual methods simple , exponential, etc. A very professional indicator, it does not end here other advantages of this indicator include creating an alarm on the desktop and the mobile phone When the candlesticks hit one of the center lines or the upper and lower bands
Features in

It's a multi-symbol and multi-timeframe scanner for our indicator - ACB Breakout Arrows . With default settings, it scans for the buy/sell signals on 28 currency pairs and 9 time-frames concurrently.
Features
It can scan 252* combinations of symbols and time-frames from a single chart. Open the signal's chart loaded with a predefined template with a single click. Easy drag n drop anywhere on the chart. Real-time alerts with popup, sound, push-notifications and email alerts.
Input Para

Naked Forex Kangaroo Tail Indicator Kangaroo Tail Indicator is a pattern recognition indicator for Forex, Stocks, Indices, Futures, Commodities and Cryptos.
The Kangaroo Tail is a multi-bar pattern.
The Kangaroo Tail pattern is very effective and is very simple to trade.
The strategy that comes with the Kangaroo Tail is based on price action.
The indicator does what it was designed for: displaying Kangaroo Tail patterns. Don't expect to follow the up and down arrows and make money . Tr

Naked Forex Big Shadow Indicator Big Shadow Indicator is a pattern recognition indicator for Forex, Stocks, Indices, Futures, Commodities and Cryptos.
When you have a Big Shadow on your chart then this is a strong signal meaning that you might be ahead of a reversal. You can take other elements (momentum, trend, volatility, price action, fundamentals) to build a complete strategy and confirm your entries. Beware that you might not make money just following the arrows generated by the pattern r
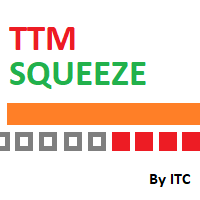
TTM Squeeze Indicator TTM Squeeze is an indicator to time entries based on volatility.
TMM Squeeze might well be one of the best and most overlooked indicator. It was created by famous trader John Carter and is also used by many traders like Nathan Bear.
Why is the TTM Squeeze indicator important? Because in trading correct timing entries might be more important than picking the right direction. This is a concept that is not very well understood in the trading community. Most trader think

Inside Bar Indicator Inside Bar is a very popular candlestick pattern.
Inside Bar indicator can be used to trade Forex, Stocks, Indices, Futures, Commodities and Cryptos.
The Inside Bar indicator will search for inside bar candles pattern in the chart and will generate display them.
The indicator is also able to generate alerts in your screen or sent to your phone.
Inputs of the indicator are:
Symbol : type of char symbol to be displayed in the chart to show Inside Bar patterns Custo

Naked Forex Kangaroo Tail Pro Indicator Kangaroo Tail Pro Indicator is a pattern recognition indicator for Forex, Stocks, Indices, Futures, Commodities and Cryptos.
The Kangaroo Tail is a multi-bar pattern.
The Kangaroo Tail pattern is very effective and is very simple to trade.
The strategy that comes with the Kangaroo Tail is based on price action.
The indicator does what it was designed for: displaying Kangaroo Tail patterns. Don't expect to follow the up and down arrows and make

Naked Forex Tweezer Pro Indicator Tweezer Pro Indicator is a pattern recognition indicator for Forex, Stocks, Indices, Futures, Commodities and Cryptos.
The standard Tweezer is a two bar pattern. Our enhanced version is a multi-bar pattern. We filter the patterns for you so that you only get the best and most effective patterns and ignore the noise.
The Tweezer pattern is a simple and effective pattern to trade.
The strategy that comes with the Tweezer is based on price action.
The

Moving VWAP Indicator Moving VWAP is an important indicator drawing the Volume-Weighted Average Price (VWAP).
The VWAP is a reference used by institutional traders and acts as a level of support / resistance.
If price is above VWAP then means market is bullish.
If price is below VWAP then means market is bearish.
It can be used to enter in the market with low risk (near VWAP) and also identify the correct direction of the market.
The Moving VWAP is as simple as a Simple Moving Average.

Normalized Volume 99% of indicators are based on price analysis.
This indicator is based on volume. Volume is overlooked piece of information in most trading systems.
And this is a big mistake since volume gives important information about market participants.
Normalized Volume is an indicator that can be used to confirm reversal points.
The indicator code volume with colors indicating high, normal and low volume.
You could enhance dramatically your trading system using volume analysis

FX Sniper Yellow Indicator FX Sniper Yellow is an exclusive leading indicator to trade Forex with your Metatrader trading platform.
FX Sniper Yellow is able to analyze market participants behavior and to predict changes in the price direction even before movement starts.
Most indicators are lagging indicators and are useless. FX Sniper Yellow is a unique leading indicator .
The indicator displays arrows in your chart (please see screenshot attached) showing the probable direction of

FX Sniper Magenta Indicator FX Sniper Magenta is an exclusive and leading indicator to trade Forex with your Metatrader trading platform.
FX Sniper Magenta is able to analyze market participants behavior and to predict changes in the price direction even before movement starts.
Most indicators are lagging indicators and are useless. FX Sniper Magenta is a unique leading indicator .
The indicator displays arrows in your chart (please see screenshot attached) showing the probable direc

FX Sniper Orange Indicator FX Sniper Orange is an exclusive indicator to spot situations where market has gone too far and market could reverse soon after.
The indicator displays arrows in your chart indicating probable future price action (see screenshot attached).
FX Sniper Orange never repaints. Once candle is closed signal is confirmed and arrow will never disappear.
Users of the indicator can setup alerts when new arrows are displayed in the chart.
Inputs of the indicator are:
D
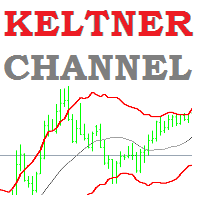
Keltner Channel Indicator Keltner Channel is an oscillator like Bollinger Bands.
Keltner Channel is a very good tool to time entries for your strategy.
Keltner Channel displays a channel where price is supposed to stay unless we are in overbought or oversold situations.
Various strategies use Keltner Channel indicator successfully to spot overbought / oversold situations and look for reversals.
Keltner Channel indicator uses ATR to determine overbought and oversold situations. Inputs of the
MetaTrader Market - Handelsroboter und technische Indikatoren stehen Ihnen direkt im Kundenterminal zur Verfügung.
Das MQL5.community Zahlungssystem wurde für die Services der MetaTrader Plattform entwickelt und steht allen registrierten Nutzern der MQL5.com Webseite zur Verfügung. Man kann Geldmittel durch WebMoney, PayPal und Bankkarten einzahlen und sich auszahlen lassen.
Sie verpassen Handelsmöglichkeiten:
- Freie Handelsapplikationen
- Über 8.000 Signale zum Kopieren
- Wirtschaftsnachrichten für die Lage an den Finanzmärkte
Registrierung
Einloggen
Wenn Sie kein Benutzerkonto haben, registrieren Sie sich
Erlauben Sie die Verwendung von Cookies, um sich auf der Website MQL5.com anzumelden.
Bitte aktivieren Sie die notwendige Einstellung in Ihrem Browser, da Sie sich sonst nicht einloggen können.