• Genel bakış
  • İncelemeler
  • Yorumlar

R Silver Trend

R Silver Trend göstergesi, mevcut trendi doğrudan Metatrader 4 aktivite tablosunda gösteren, trend takip eden bir ticaret göstergesidir.

İki tür mum çeker:
Mavi, yükseliş fiyat hareketi içindir.
Aşağı yönlü fiyat hareketi için kırmızı.

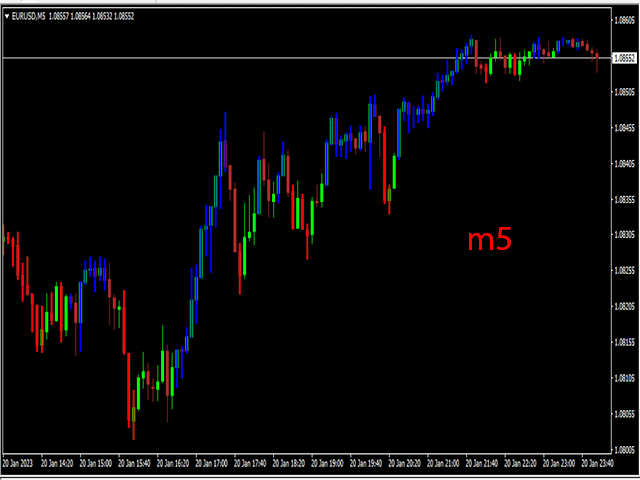
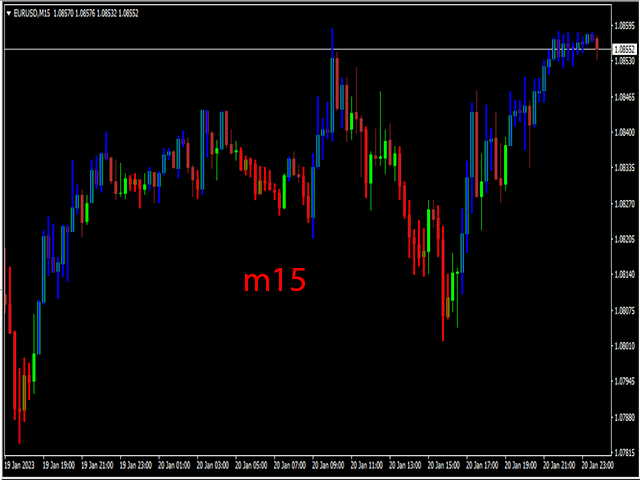
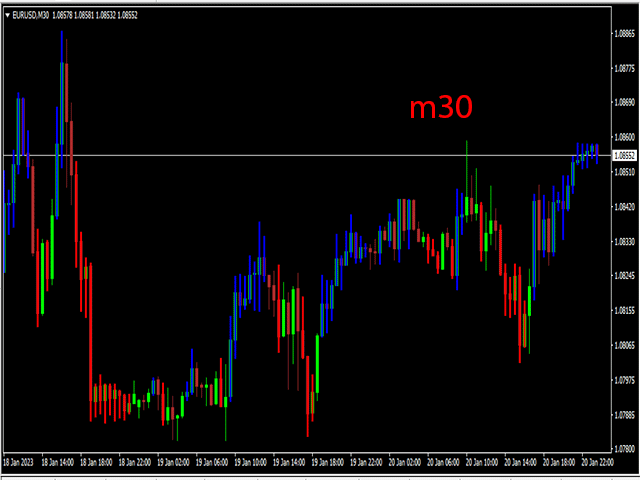
R Silver Trend göstergesi ile işlem yapmak, tamamen yeni başlayanlar için bile oldukça kolaydır ve ölçeklendirme (M1, M5), günlük işlem (M5, M15, M30) ve salıncak ticaret (H1, H4, D1) para birimleri için kullanılabilir.

Temel ticaret sinyalleri
R Silver Trend gösterge sinyallerinin yorumlanması kolaydır ve şöyle görünür:

Satın alma sinyali: gösterge grafikte mavi bir mum çizdiğinde bir satın alma pozisyonu açın.

Satış sinyali: gösterge grafikte kırmızı bir mum çizdiğinde bir satış pozisyonu açın.

İşlem Çıkışı: Ters bir sinyal göründüğünde açık bir işlemi kapatın veya kendi ticaret çıkış yönteminizi kullanın.

R Gümüş Trend göstergesiyle bir düşüş ve satış stratejisi ticareti yapmak için grafiğinize uzun vadeli bir trend takip göstergesi ekleyin ve yalnızca daha uzun trend yönünde pozisyonlar açın.

MT4 göstergesinin özellikleri
Döviz çiftleri: Herhangi biri

Platform: Metatrader 4

Tür: grafik

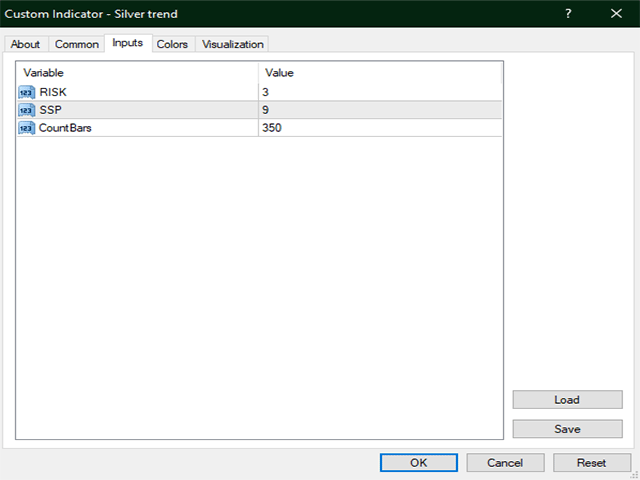
Özelleştirme seçenekleri: Değişken (risk, SSP, CountBars) Renkler, genişlik ve stil.

Zamanlamalar: 1 dakika, 5 dakika, 15 dakika, 30 dakika, 1 saat, 4 saat, 1 gün, 1 hafta, 1 ay.

Tür: Trend
Önerilen ürünler
MA Alignment Scanner
Benedict Jamora
5 (1)
This indicator scans and displays currency pairs that have recently aligned moving averages on a given timeframe. You can configure which pairs the indicator will scan. It also includes all types of alert options. Bullish MA Alignment =  MA1>MA2>MA3>MA4>MA5 Bearish MA Alignment =  MA1<MA2<MA3<MA4<MA5 Features Attach to one chart and scans all the currency pairs configured and visible in the Market Watch Window It can monitor all the available timeframes from M1 to MN1 and sends alerts on ever
Forex Gump
Andrey Kozak
2.83 (6)
Forex Gump is a fully finished semi-automatic trading system. In the form of arrows, signals are displayed on the screen for opening and closing deals. All you need is to follow the instructions of the indicator. When the indicator shows a blue arrow, you need to open a buy order. When the indicator shows a red arrow, you need to open a sell order. Close orders when the indicator draws a yellow cross. In order to get the most effective result, we recommend using the timeframes H1, H4, D1. There
FFx MACD Divergences
Eric Venturi-Bloxs
5 (3)
The purpose of this new version of the MT4 standard indicator provided in your platform is to display in a sub-window multiple timeframes of the same indicator with its divergences. See the example shown in the picture below. But the display isn't like a simple MTF indicator. This is the real display of the indicator on its timeframe. Here's the options available in the FFx divergences indicator: Select the timeframes to be displayed (M1 to Monthly) Define the width (number of bars) for each tim
The Stochastic Oscillator is a momentum indicator that uses support and resistance levels. The term "stochastic" refers to the point of a current price in relation to its price range over a period of time. You can use a New Stochastic in the same way as classical one: Overbought and Oversold areas to make a Buy or Sell orders. This new indicator shows all variety of Fibonacci Levels (from 23.6 to 76.4) which can be used as Overbought and Oversold levels as well as points to close an open positio
VR Cub
Vladimir Pastushak
VR Cub , yüksek kaliteli giriş noktaları elde etmenin bir göstergesidir. Gösterge, matematiksel hesaplamaları kolaylaştırmak ve bir pozisyona giriş noktalarının aranmasını basitleştirmek için geliştirildi. Göstergenin yazıldığı ticaret stratejisi uzun yıllardan beri etkinliğini kanıtlamaktadır. Ticaret stratejisinin basitliği, acemi yatırımcıların bile başarılı bir şekilde ticaret yapmasına olanak tanıyan büyük avantajıdır. VR Cub, pozisyon açılış noktalarını ve Kâr Al ve Zararı Durdur hedef sev
FFx RSI Divergences
Eric Venturi-Bloxs
4 (2)
The purpose of this new version of the MT4 standard indicator provided in your platform is to display in a sub-window multiple timeframes of the same indicator with its divergences. See the example shown in the picture below. But the display isn't like a simple MTF indicator. This is the real display of the indicator on its timeframe. Here's the options available in the FFx divergences indicator: Select the timeframes to be displayed (M1 to Monthly) Define the width (number of bars) for each tim
Metatrader 4 için Süper Ok Forex Sinyal göstergesi, grafik üzerinde doğru alım ve satım okları basan eksiksiz bir FX ticaret sistemidir. Gösterge ana MT4 grafik penceresinde renkli yeşil ve kırmızı oklar olarak görünür. Göstergenin gösterdiği sinyalleri takip etmeniz yeterli! Ticaret sinyalleri: Yeşil ok bir satın alma sinyalidir. Kırmızı ok bir satış sinyalidir. Super Arrow Forex Sinyal göstergesi hem ticarete giriş hem de çıkış için veya diğer stratejiler ve sistemler için trend onay
The Sextet Scalper Pro  is an MT4 indicator that gives signals when new waves are starting in a trend. The trends are calculated using the original " The Sextet " indicator method. You get a free EA to trade with The Sextet Scalper Pro: Free EA . Default settings were optimized on GBPUSD H1 from 2017. EA could be tested on free demo version of The Sextet Scalper Pro, before purchase. Key Features: Uses The Sextet Trend Detection Method which is already a good strategy in itself for detecting l
Lyne
Maksim Kalachev
About the Lyne indicator Lyne is a Metatrader 4 (MT4) indicator, the essence of which is to transform the accumulated historical data. The Lyne indicator makes it possible to detect various features and patterns in price dynamics that are invisible to the naked eye. Based on this information, traders can anticipate further price movement and adjust their strategy accordingly. This indicator has proven itself in the scalping strategy. The indicator works without repainting.
The GGP Wave Trend Oscillator MT4   Indicator is a volatility and momentum tool designed to help traders optimize their trading performance and providing traders find the most accurate market reversals. This indicator is MT4 conversion of the Indicator: WaveTrend Oscillator [WT] by “ LazyBear “ in Trading View website and some alert methods are added to provide real-time alerts when a trading signal is generated, in order to allow traders to act quickly and efficiently. When the oscillator is ab
The indicator displays a matrix of indicators across multiple timeframes with a sum total and optional alert. Custom indicators can also be added to the matrix, in a highly configurable way. The alert threshold can be set to say what percentage of indicators need to be in agreement for an alert to happen. The alerts can turned on/off via on chart tick boxes and can be set to notify to mobile or sent to email, in addition to pop-up. The product offers a great way to create an alert when multiple
Binary Options Assistant (BOA) Multi Currency Dashboard for Binary Options (MT4) . You can use any of the BOA Signals Indicators with the dashboard. Just change the BOA Signals Indicator Name in the dashboard settings to the indicator you want to get signals from. For example: CHILL. BOA_BURN_Indicator_v1   Strategy :   Ana Trader Binary Options Strategy (MACD & Stochastic) BOA_COLD_Indicator_v1   Strategy :  Amalia Trader Binary Options Strategy (Keltner & Stochastic) BOA_CHILL_Indicator_
Numero 07
Abdullah Alrai
Description: Unlock the power of numerology in your trading with our unique Numerology Indicator. This indicator is meticulously designed to provide traders with insights based on numerology principles and 0.7 values, offering a fresh perspective on market analysis. How It Works: Our Numerology Indicator leverages the ancient wisdom of numerology, which assigns numerical significance to various aspects of life. In the context of trading, we've harnessed the mystical power of 0.7 values, aligning
RSI Currency Strength Meter uses RSI (Relative Strength Index) to monitor how strong a currency is, or in other words, if it's being bought or sold by the majority compared to the other currencies. It displays the strength-lines of the currencies of the pair (base and counter currency of the chart) with changeable solid lines. Also, you can add up to five additional currencies to the "comparison pool". If you want to look and compare, for example, EUR, USD and JPY, it will only look at the EURUS
ZhiBiCCI MT4
Qiuyang Zheng
5 (1)
[ZhiBiCCI] indicators are suitable for all cycle use, and are also suitable for all market varieties. [ZhiBiCCI] Green solid line is a reversal of bullish divergence. The green dotted line is a classic bullish divergence. [ZhiBiCCI] The solid line to the red is a reverse bearish divergence. The red dotted line is a classical bearish divergence. [ZhiBiCCI] can be set in the parameters (Alert, Send mail, Send notification), set to (true) to send instant signals to the alarm window, email, in
The purpose of this new version of the MT4 standard indicator provided in your platform is to display in a sub-window multiple timeframes of the same indicator with its divergences. See the example shown in the picture below. But the display isn't like a simple MTF indicator. This is the real display of the indicator on its timeframe. Here's the options available in the FFx divergences indicator: Select the timeframes to be displayed (M1 to Monthly). Define the width (number of bars) for each ti
The indicator depends on the price action's analysis how is based on the rsi indicator and the moving average line from a platform containing multi symbols and different time-frames with the possibility to select your desired symbols and time-frames . Special Characteristics :  *  Real time analysis or at price close .  * The possibility to open several windows with the selected symbols .   *     Different alert systems .    Indicator  Characteristics :  * Multiple symbol and time frame with
Bu, değerleri yumuşatarak filtreleme yeteneğine sahip bir para birimi gücünün (korelasyon) doğrusal bir göstergesidir. 8 ana para biriminin mevcut gücünü ve tarihi değerleri yeniden çizmeden gösterir. Özel bir algoritmaya dayanmaktadır. Hesaplama esası için temel bir döviz çifti kullanılır; döviz çifti, mevcut grafik sembolünden farklı olabilir. Sonuç, göstergenin başlatıldığı seçili grafik zaman dilimine ve temel döviz çiftine bağlıdır. Gösterge, standart döviz çiftlerinin herhangi bir genişlet
FXC iMACD-DivergencE MT4 Indicator This is an advanced MACD indicator that finds trend-turn divergences on the current symbol. The indicator detects divergence between the MACD and the price movements as a strong trend-turn pattern. Main features: Advanced divergence settings Price based on Close, Open or High/Low prices Give Buy/Sell open signals PUSH notifications E-mail sending Pop-up alert Customizeable Information panel Input parameters: MACD Fast-EMA: The Fast-EMA variable of the MACD
FXC iDeM-DivergencE MT4 Indicator This is an advanced DeMarker indicator that finds trend-turn divergences on the current symbol. The indicator detects divergence between the DeMarker and the price movements as a strong trend-turn pattern. Main features: Advanced divergence settings Price based on Close, Open or High/Low prices Give Buy/Sell open signals PUSH notifications E-mail sending Pop-up alert Customizeable Information panel Input parameters: DeM Period: The Period size of the DeMarke
Scalping Modulator is a scalping trading system. The indicator consists of several analytical modules. It automatically analyzes the market and shows the trader all the necessary information for trading. Scalping Modulator draws two trend lines on the chart. One line shows the long-term direction of the price, the second line shows the medium-term direction of the price. The indicator also draws red and blue dots on the chart. They indicate a likely change in price movement. In order to open a
The indicator displays the data of the Stochastic oscillator from a higher timeframe on the chart. The main and signal lines are displayed in a separate window. The stepped response is not smoothed. The indicator is useful for practicing "manual" forex trading strategies, which use the data from several screens with different timeframes of a single symbol. The indicator uses the settings that are identical to the standard ones, and a drop-down list for selecting the timeframe. Indicator Parame
Master Scalping M1 , trendi hızlı ve doğru bir şekilde belirlemek için bir algoritma kullanan yenilikçi bir göstergedir. Gösterge, pozisyonların açılış ve kapanış zamanını hesaplar, gösterge algoritmaları, bir ticarete girmek (bir varlık satın almak veya satmak) için ideal anları bulmanızı sağlar, bu da çoğu tüccar için işlemlerin başarısını artırır. Göstergenin faydaları: Kullanımı kolaydır, çizelgeyi gereksiz bilgilerle aşırı yüklemez. Herhangi bir strateji için bir filtre olarak kullanılabili
SRP Pro
Farhad Kia
5 (1)
Strong Retracement Points Pro edition! SRP (Strong Retracement/Reversal Points) is a powerful and unique support and resistance indicator. It displays the closest important levels which we expect the price retracement/reversal! If all level are broken from one side, it recalculates and draws new support and resistance levels, so the levels might be valid for several days depending on the market! If you are still hesitating to start using this wonderful tool, you can check this link to see how ef
Trendiness Index
Libertas LLC
5 (3)
"The trend is your friend" is one of the best known sayings in investing, because capturing large trendy price movements can be extremely profitable. However, trading with the trend is often easier said than done, because many indicators are based on price reversals not trends. These aren't very effective at identifying trendy periods, or predicting whether trends will continue. We developed the Trendiness Index to help address this problem by indicating the strength and direction of price trend
MN1-W1-D1 Close Price Indicator to Index Trading for MT4 The indicator draws lines to the close prices of the last closed bars of monthly, weekly and daily timeframes. Observably, these prices are significant support and resistance prices at major indices, like Nasdaq, DAX. The info panel always shows the prices relative to each other in the correct order. If the current price is the highest - i.e. higher than the last monthly, weekly and daily closing price - it is in the first row. The lowest
Pip Counter MT4
KEENBASE SOFTWARE SOLUTIONS
KT Pip Counter is a simple and informative indicator that shows some essential data and numbers on a real-time basis. Such critical information and data can benefit a trader during an intense trading session. Features Shows the current profit/loss in currency, pips, and percentage. Shows the current spreads.  Shows the remaining time in the closing of the current bar. The different color schemes for profit/loss scenario. The text position and layout can be fully customized.  It uses minimum
Reversal Indicator
Augustine Kamatu
4 (1)
Have you ever wanted to be able to catch a trend just as it is beginning? This indicator attempts to find the tops and bottoms of a trend. It uses in-built indicators and studies their reversal patterns. It cannot be used on its own it requires Stochastic(14) to confirm signal. Red for sell, Blue for buy. There are no parameters required just attach to a chart and it is ready to go. Check out other great products from  https://www.mql5.com/en/users/augustinekamatu/seller   A Winning Trading Stra
FREE
Alpha Trend
Evgeny Belyaev
3.33 (3)
Alpha Trend is a trend indicator for the MetaTrader 4 platform; it has been developed by a group of professional traders. The Alpha Trend indicator finds the most probable tendency reversal points, which allows making trades at the very beginning of a trend. This indicator features notifications, which are generated whenever a new signal appears (alert, email, push-notification). This allows you to open a position in a timely manner. Alpha Trend does not redraw, which makes it possible to evalua
Market Meeter
Hapu Arachchilage Tharindu Lakmal
Market Meter is designed for explore various trends in current trading symbol.  with Market Meter  you can get a clear idea about the trends running on different time frames of current symbol. This indicator uses separate window to display its data. Every time when a new trend occurred, Indicator shows it with displaying an arrow on related text area. It's very important to identify the trends of higher time frames when you trading lower time frames. Let the Market Meter  to do the work for you.
Bu ürünün alıcıları ayrıca şunları da satın alıyor
Gann Made Easy
Oleg Rodin
4.92 (64)
Gann Made Easy , bay teorisini kullanarak ticaretin en iyi ilkelerine dayanan, profesyonel ve kullanımı kolay bir Forex ticaret sistemidir. WD Gann. Gösterge, Zararı Durdur ve Kâr Al Seviyeleri dahil olmak üzere doğru SATIN AL ve SAT sinyalleri sağlar. PUSH bildirimlerini kullanarak hareket halindeyken bile işlem yapabilirsiniz. Lütfen satın aldıktan sonra benimle iletişime geçin! Alım satım ipuçlarımı ve harika bonus göstergelerini ücretsiz olarak sizinle paylaşacağım! Muhtemelen Gann ticaret y
ŞU ANDA %26 INDIRIMLI Yeni Başlayanlar veya Uzman Tüccarlar için En İyi Çözüm! Bu Gösterge benzersiz, yüksek kaliteli ve uygun fiyatlı bir ticaret aracıdır çünkü bir dizi tescilli özellik ve yeni bir formül ekledik. Sadece BİR grafik ile 28 Forex çifti için Döviz Gücünü okuyabilirsiniz! Yeni bir trendin veya scalping fırsatının tam tetik noktasını belirleyebildiğiniz için ticaretinizin nasıl gelişeceğini hayal edin? Kullanım kılavuzu: buraya tıklayın Bu ilk olan, orijinal! Değersiz bir
74% discount for the next 10 buyers (original price $605): 1 left Get a 50% bonus by buying (or even renting) any of our products. After buying (or renting), send a message for more information. 3 Indicators in 1 indicator Strategy based on price action Made specifically for the best forex currency pairs Can be used in the best time frame of the market at a very reasonable price This indicator is basically 3 different indicatos . But we have combined these 3 indicators in 1 indicator so th
Atomic Analyst
Issam Kassas
5 (3)
Öncelikle belirtmek gerekir ki bu Ticaret Göstergesi Yeniden Çizim Yapmaz, Gecikmez ve Gecikme Göstermez, bu da hem manuel hem de robot ticareti için ideal hale getirir. Kullanıcı kılavuzu: ayarlar, girişler ve strateji. Atom Analisti, Piyasada Daha İyi Bir Avantaj Bulmak İçin Fiyatın Gücünü ve Momentumunu Kullanan PA Fiyat Hareketi Göstergesidir. Gürültüleri ve Yanlış Sinyalleri Kaldırmaya ve Ticaret Potansiyelini Artırmaya Yardımcı Olan Gelişmiş Filtrelerle Donatılmıştır. Birden fazla katma
TPSpro RFI Levels
Roman Podpora
5 (14)
A key element in trading is zones or levels from which decisions to buy or sell a trading instrument are made. Despite attempts by major players to conceal their presence in the market, they inevitably leave traces. Our task was to learn how to identify these traces and interpret them correctly. Reversal First Impulse levels (RFI)   -  Version MT5                INSTRUCTIONS                 RUS                 ENG                                       R ecommended to use with an indicator   -  
TPSproTREND PrO
Roman Podpora
5 (16)
TPSpro TRENDPRO  - is a trend indicator that automatically analyzes the market and provides information about the trend and each of its changes, as well as giving signals for entering trades without redrawing! The indicator uses each candle, analyzing them separately. referring to different impulses - up or down impulse. Exact entry points into transactions for currencies, crypto, metals, stocks, indices!  -  Version MT5               DETAILED DESCRIPTION        /       TRADING SETUPS           
Tanıtım       Kuantum Trend Keskin Nişancı Göstergesi   , trend tersine dönmeleri belirleme ve ticaret yapma şeklinizi değiştiren çığır açan MQL5 Göstergesi! 13 yılı aşkın ticaret tecrübesine sahip deneyimli tüccarlardan oluşan bir ekip tarafından geliştirilmiştir.       Kuantum Trend Keskin Nişancı Göstergesi       trend dönüşlerini son derece yüksek doğrulukla belirlemenin yenilikçi yolu ile ticaret yolculuğunuzu yeni zirvelere taşımak için tasarlanmıştır. ***Kuantum Trend Keskin Nişancı Gö
Break and Retest
Mohamed Hassan
4.6 (10)
New update to V.4 where  Break & Retest automatically draws the take profit & stop loss levels and you also have more signals per day! ‍You can visually backtest Break & Retest to see how it behaved in the past!     Manual guide:   Click here $65  for only 2  copies left! Next price is $120 .  This Indicator only places quality trades when the market is really in your favor with a clear break and retest. Patience is key with this price action strategy! If you want more alert
Öncelikle, bu Ticaret Aracının Non-Repainting, Non-Redrawing ve Non-Lagging Gösterge olduğunu vurgulamakta fayda var, bu da onu profesyonel ticaret için ideal hale getiriyor. Çevrimiçi kurs, kullanıcı kılavuzu ve demo. Akıllı Fiyat Hareketi Kavramları Göstergesi, hem yeni hem de deneyimli tüccarlar için çok güçlü bir araçtır. İleri ticaret fikirlerini, Inner Circle Trader Analizi ve Smart Money Concepts Ticaret Stratejileri gibi 20'den fazla kullanışlı göstergeyi bir araya getirerek bir araya g
Scalper Inside PRO
Alexey Minkov
4.75 (57)
An exclusive indicator that utilizes an innovative algorithm to swiftly and accurately determine the market trend. The indicator automatically calculates opening, closing, and profit levels, providing detailed trading statistics. With these features, you can choose the most appropriate trading instrument for the current market conditions. Additionally, you can easily integrate your own arrow indicators into Scalper Inside Pro to quickly evaluate their statistics and profitability. Scalper Inside
FX Volume
Daniel Stein
4.6 (35)
Sabah Brifingimiz aracılığıyla ayrıntılar ve ekran görüntüleri ile günlük piyasa güncellemenizi alın burada mql5 ve on Telegram ! FX Volume, bir brokerin bakış açısından piyasa duyarlılığı hakkında GERÇEK bir fikir veren İLK ve TEK hacim göstergesidir. COT raporlarından çok daha hızlı bir şekilde, brokerlar gibi kurumsal piyasa katılımcılarının Forex piyasasında nasıl konumlandıklarına dair harika bilgiler sağlar. Bu bilgileri doğrudan grafiğinizde görmek, ticaretiniz için gerçek oyun değiştir
Advanced Supply Demand
Bernhard Schweigert
4.92 (310)
CURRENTLY 26% OFF !! Best Solution for any Newbie or Expert Trader! This indicator is a unique, high quality and affordable trading tool because we have incorporated a number of proprietary features and a new formula. With this update, you will be able to show double timeframe zones. You will not only be able to show a higher TF but to show both, the chart TF, PLUS the higher TF: SHOWING NESTED ZONES. All Supply Demand traders will love it. :) Important Information Revealed Maximize the potenti
Özel MT4 göstergemizle başarılı forex ticaretinin sırrını keşfedin! Forex piyasasında nasıl başarıya ulaşacağınızı hiç merak ettiniz, riski en aza indirirken sürekli olarak kar kazandınız mı? İşte aradığınız cevap! Ticaret yaklaşımınızda devrim yaratacak tescilli MT4 göstergimizi tanıtmamıza izin verin. Benzersiz çok yönlülük Göstergemiz, Renko ve RangeBar Mum oluşumlarını tercih eden kullanıcılar için özel olarak tasarlanmıştır. Bu grafik türlerinin birçok deneyimli tüccar tarafından ter
Trend Screener
STE S.S.COMPANY
4.83 (88)
Trend Göstergesi, Trend Alım Satım ve Filtreleme için Çığır Açan Benzersiz Çözüm, Tüm Önemli Trend Özellikleriyle Tek Bir Araç İçinde Yerleştirildi! Forex, emtialar, kripto para birimleri, endeksler ve hisse senetleri gibi tüm sembollerde/araçlarda kullanılabilen %100 yeniden boyamayan çoklu zaman çerçevesi ve Çoklu para birimi göstergesidir. Trend Screener, grafikte noktalarla ok trend sinyalleri sağlayan etkili bir trend trend göstergesidir. Trend analizörü göstergesinde bulunan özellikler: 1.
Quantum Breakout Indicator PRO
Bogdan Ion Puscasu
4.96 (26)
Tanıtım       Quantum Breakout PRO   , Breakout Bölgeleri ile ticaret yapma şeklinizi değiştiren çığır açan MQL5 Göstergesi! 13 yılı aşkın ticaret deneyimine sahip deneyimli tüccarlardan oluşan bir ekip tarafından geliştirilen   Quantum Breakout PRO   , yenilikçi ve dinamik koparma bölgesi stratejisiyle ticaret yolculuğunuzu yeni zirvelere taşımak için tasarlanmıştır. Kuantum Breakout Göstergesi, size 5 kar hedefi bölgesi ile kırılma bölgelerinde sinyal okları ve kırılma kutusuna dayalı ol
Scalper Vault
Oleg Rodin
5 (28)
Scalper Vault , başarılı bir scalping için ihtiyacınız olan her şeyi size sağlayan profesyonel bir scalping sistemidir. Bu gösterge, forex ve ikili opsiyon tüccarları tarafından kullanılabilecek eksiksiz bir ticaret sistemidir. Önerilen zaman çerçevesi M5'tir. Sistem size trend yönünde doğru ok sinyalleri sağlar. Ayrıca size üst ve alt sinyaller ve Gann piyasa seviyeleri sağlar. Göstergeler, PUSH bildirimleri dahil her türlü uyarıyı sağlar. Göstergeyi satın aldıktan sonra lütfen benimle iletişim
Fiyat tersine döndükçe ve geri çekildikçe piyasa yapısından elde edilen kâr değişir. Piyasa yapısını tersine çevirme uyarısı göstergesi, bir trendin veya fiyat hareketinin ne zaman tükenmeye yaklaştığını ve tersine dönmeye hazır olduğunu tanımlar. Genellikle bir geri dönüş veya büyük bir geri çekilme meydana gelmek üzereyken meydana gelen piyasa yapısındaki değişiklikler konusunda sizi uyarır. Gösterge, olası bir tükenme noktasının yakınında her yeni yüksek veya düşük oluştuğunda, başlangıçta
PRO Renko Sistemi, RENKO grafikleri ticareti için özel olarak tasarlanmış son derece hassas bir ticaret sistemidir. Bu, çeşitli ticaret araçlarına uygulanabilen evrensel bir sistemdir. Sistemi etkin piyasa sana doğru ters sinyallerine erişim hakkı denilen ses nötralize eder. Göstergenin kullanımı çok kolaydır ve sinyal üretiminden sorumlu tek bir parametreye sahiptir. Aracı, seçtiğiniz herhangi bir ticaret aracına ve renko çubuğunun boyutuna kolayca uyarlayabilirsiniz. Yazılımımla karlı b
FX Power MT4 NG
Daniel Stein
5 (10)
Sabah Brifingimiz burada mql5 ve on Telegram! FX Power MT4 NG , uzun zamandır çok popüler olan döviz gücü ölçerimiz FX Power'ın yeni neslidir. Peki bu yeni nesil güç ölçer ne sunuyor? Orijinal FX Power hakkında sevdiğiniz her şey PLUS GOLD/XAU güç analizi Daha da hassas hesaplama sonuçları Ayrı ayrı yapılandırılabilir analiz dönemleri Daha da iyi performans için özelleştirilebilir hesaplama limiti Özel çokluDaha fazlasını görmek isteyenler için örnek ayarlar Her grafikte en sevdiğiniz renkler i
ADR Ters Çevirme Göstergesi, normal ortalama günlük aralığına göre fiyatın şu anda nerede işlem gördüğünü bir bakışta size gösterir. Fiyat, ortalama aralığı ve seçtiğiniz seviyenin üzerindeki seviyeleri aştığında, açılır pencere, e-posta veya push yoluyla anında uyarılar alacaksınız, böylece hızlı bir şekilde geri çekilmelere ve geri dönüşlere atlayabilirsiniz. Gösterge, grafikte ortalama günlük aralık uç noktalarında yatay çizgiler ve ayrıca fiyatları aşan matematiksel olasılıkları olan seviye
Şu anda %20 İNDİRİMLİ! Herhangi bir Acemi veya Uzman Tüccar için En İyi Çözüm! Bu gösterge paneli yazılımı 28 döviz çifti üzerinde çalışıyor. Ana göstergelerimizden 2'sine (Gelişmiş Para Birimi Gücü 28 ve Gelişmiş Para Birimi Dürtüsü) dayanmaktadır. Tüm Forex piyasasına harika bir genel bakış sağlar. Gelişmiş Para Birimi Gücü değerlerini, para birimi hareket hızını ve tüm (9) zaman dilimlerinde 28 Forex çifti için sinyalleri gösterir. Trendleri ve / veya scalping fırsatlarını belirlemek içi
GOLD Impulse with Alert
Bernhard Schweigert
4.56 (9)
Bu gösterge, 2 ürünümüz Advanced Currency IMPULSE with ALERT  +   Currency Strength Exotics  'in süper bir kombinasyonudur. Tüm zaman dilimleri için çalışır ve 8 ana para birimi artı bir Sembol için grafiksel olarak güç veya zayıflık dürtüsünü gösterir! Bu Gösterge, Altın, Egzotik Çiftler, Emtialar, Endeksler veya Vadeli İşlemler gibi herhangi bir sembol için para birimi gücü ivmesini göstermek için uzmanlaşmıştır. Türünün ilk örneğidir, Altın, Gümüş, Petrol, DAX, US30, MXN, TRY, CNH vb.
TrendMaestro
Stefano Frisetti
5 (2)
note: this indicator is for METATRADER4, if you want the version for METATRADER5 this is the link:  https://www.mql5.com/it/market/product/108106 TRENDMAESTRO ver 2.4 TRENDMAESTRO recognizes a new TREND in the bud, he never makes mistakes. The certainty of identifying a new TREND is priceless. DESCRIPTION TRENDMAESTRO identifies a new TREND in the bud, this indicator examines the volatility, volumes and momentum to identify the moment in which there is an explosion of one or more of these data a
RSI / TDI uyarı panosu, ticaret yaptığınız her büyük çiftte RSI'leri (sizin tarafınızdan seçilebilir) bir kerede izlemenize olanak tanır. İki şekilde kullanabilirsiniz: 1. Birden fazla zaman çerçevesi seçin ve çizgi, normal ticaret koşullarının ötesine geçen birden fazla zaman çerçevesi olduğunda size gösterecektir. Birden fazla zaman diliminde aşırı alım veya aşırı satım seviyesine ulaştığı için fiyatın son zamanlarda sert bir şekilde yükseldiğinin harika bir göstergesi, bu nedenle yakın
Currency Strength Wizard , başarılı ticaret için size hepsi bir arada çözüm sağlayan çok güçlü bir göstergedir. Gösterge, birden çok zaman dilimindeki tüm para birimlerinin verilerini kullanarak şu veya bu forex çiftinin gücünü hesaplar. Bu veriler, şu veya bu para biriminin gücünü görmek için kullanabileceğiniz, kullanımı kolay para birimi endeksi ve para birimi güç hatları biçiminde temsil edilir. İhtiyacınız olan tek şey, işlem yapmak istediğiniz tabloya göstergeyi eklemektir ve gösterge size
on free demo press zoom out button to see back.. cnt number is bar numbers.you can change up to 3000 related to chart bars numbers. minimum value is 500. there is g value set to 10000. no need to change it. this indicator almost grail,no repaint and all pairs ,all timeframe indicator. there is red and blue histograms. if gold x sign comes on red histogram that is sell signal. if blue x sign comes on blue histogram that is buy signal. this indicator on thise version works all pairs.al timeframe
Automated Trendlines
Georgios Kalomoiropoulos
5 (16)
Trend çizgileri, forex ticaretinde en önemli teknik analiz aracıdır. Ne yazık ki, çoğu tüccar onları doğru şekilde çizmez. Otomatik Trend Çizgileri göstergesi, piyasaların trend hareketini görselleştirmenize yardımcı olan ciddi tüccarlar için profesyonel bir araçtır. İki tür Trend Çizgisi, Boğa Trend Çizgisi ve Ayı Trend Çizgisi vardır. Yükseliş trendinde, Forex trend çizgisi, fiyat hareketinin en düşük salınım noktalarından geçer. En az iki "en düşük düşük"ü birleştirmek, bir trend çiz
TrendDecoder Premium
Christophe Pa Trouillas
5 (3)
Aralıkları ve bir sonraki olası hamleleri belirleyin   |  Trendlerin en erken sinyallerini ve gücünü alın   |  Geri dönüşten önce net çıkışlar alın   |  Fiyatın test edeceği Fibo seviyelerini tespit edin Gecikmesiz, takip edilmeyen gösterge - manuel ve otomatik ticaret için ideal - tüm varlıklar ve tüm zaman birimleri için uygun Sınırlı süreli teklif >>   %50 İNDİRİM Satın aldıktan sonra, kişiselleştirilmiş ayarlar için bu kanaldan benimle iletişime geçin . MT5   sürümü:   buraya tıklayın Tam y
Bu gösterge panosu, piyasa yapısını tersine çevirme göstergesiyle kullanım için bir uyarı aracıdır. Birincil amacı, belirli zaman dilimlerinde geri dönüş fırsatları ve ayrıca göstergenin yaptığı gibi uyarıların yeniden test edilmesi (onay) konusunda sizi uyarmaktır. Pano, kendi başına bir grafik üzerinde oturacak ve seçtiğiniz çiftler ve zaman dilimlerinde size uyarılar göndermek için arka planda çalışacak şekilde tasarlanmıştır. Piyasa tersine çevrilme göstergesinin tek bir MT4'te birden fazla
ŞU ANDA %31 INDIRIMLI !!! Yeni Başlayanlar veya Uzman Tüccarlar için En İyi Çözüm! Bu gösterge benzersiz, yüksek kaliteli ve uygun fiyatlı bir ticaret aracıdır çünkü bir dizi tescilli özellik ve gizli bir formül ekledik. Yalnızca BİR grafikle 28 döviz çiftinin tümü için Uyarılar verir. Yeni bir trendin veya scalping fırsatının tam tetik noktasını belirleyebildiğiniz için ticaretinizin nasıl gelişeceğini hayal edin! Yeni temel algoritmalar üzerine inşa edilen bu sistem, potansiyel işlemler
Yazarın diğer ürünleri
Metatrader 4 için R İç Çubuk göstergesi, iç çubuklara dayalı olarak kullanımı kolay fiyat kırılma seviyeleri sağlar. Saf fiyat hareketi üzerinde çalışır ve hiçbir şekilde yeniden boyamaz ve ana MT4 grafik penceresinde gerçek iç çubuğun üstünde ve altında 2 renkli yatay çizgi şeklinde açılır. Yeşil yatay çizgi direnç görevi görür ve kırmızı çizgi destek görevi görür. Uzun ve kısa ticaret fikri Şamdan yeşil iç çubuk çizgisinin üzerinde kapanıyorsa ve genel eğilim yukarı yönlüyse bir satın a
FREE
R 3MA Cross
Rwy Ksyby
3.5 (2)
R 3MA Çapraz göstergesi, 3 hareketli ortalamanın kesişmesine dayalı uyarıları olan popüler bir trend göstergesidir; daha hızlı, orta ve daha yavaş hareketli bir ortalamadan oluşur. Anahtar noktaları Daha hızlı hareket eden ortalama hem orta hem de daha yavaş hareket eden ortalamayı yukarı doğru geçtiğinde bir satın alma uyarısı oluşur. Daha hızlı hareket eden ortalama hem orta hem de daha yavaş hareket eden ortalamayı aşağıya doğru geçtiğinde bir satış uyarısı oluşur. Onunla ticaret nasıl
FREE
R Scalper Arrow göstergesi, döviz çiftleri için okunması kolay alış ve satış sinyal okları sağlar. Kısa vadeli eğilimleri tahmin etmek için iyidir. Yukarı ok paritenin kısa vadeli bir yükseliş trendinde olduğunu gösterir. Aşağı ok, paritenin kısa vadeli bir düşüş trendinde olduğunu gösterir. Uzun vadeli işlemler için, zararı durdur'u piplerin altına yerleştirin. Kısa işlemler için pip başına bir zararı durdur ayarlayın. ile gidiyorum Bu gösterge, basit hareketli ortalama ve üstel hareketl
FREE
R Chimp Scalper, forex spekülatörleri ve günlük tüccarlar için mükemmel bir ticaret aracıdır. Bu ölçeklendirme göstergesinin sinyalleri çok nettir ve okunması kolaydır. Ayrı ticaret pencerelerinde sıfır seviyesinin üstüne ve altına yeşil ve kırmızı çubuklar çizin: Yeşil çubuklar, sıfır seviyesinin üzerinde sıralanarak yükseliş spekülasyon eğilimini gösteriyor. Kırmızı çubuklar, sıfırın altında sıralanarak, aşağı yönlü bir ölçeklendirme trendini gösteriyor. Sıfır seviyesinin üzerindeki göste
FREE
R Hareket Kolaylığı Metatrader 4 forex göstergesi mavi renkli bir EMZ ticaret osilatörüdür. Bir yükseliş ve düşüş ticaret alanı oluşturan osilatör tipi bir forex göstergesidir. Sıfır seviyesinin üzerindeki değerlerin yükseliş, sıfır seviyesinin altındaki değerlerin düşüş olduğu söylenir. R Ease of Movement osilatörü tek başına iyi sonuçlar vermez, teknik göstergeyi takip eden bir trend ile birlikte işlem görmesi gerekir. İyi forex trend göstergeleri şunları içerir: SMA, EMA, PSAR, Bollinger B
FREE
R Stoploss Sinyalleri göstergesi, üstel hareketli ortalamayı izleyen bir trendi temel alır. Bu forex göstergesi, aktivite tablosunda çizilen mavi ve kırmızı çizgiler şeklinde alım satım sinyalleri üretir. Mavi renkli çizgiler, trendin yukarıya doğru olduğunu gösterir ve bu, döviz çiftini satın almak için bir sinyaldir. Kırmızı renkli çizgiler, trendin aşağı yönlü olduğunu gösterir ve bu, döviz çiftini satma sinyalidir. Bu forex göstergesine önerilen bir stop-loss hattı da dahildir. Satın
FREE
R Alligator göstergesi Bill Williams tarafından tanıtıldı, 3 düzleştirilmiş hareketli ortalamanın yardımıyla trendi takip ediyor. Varsayılan olarak aşağıdaki değerler kullanılır: 13 dönemlik düzleştirilmiş hareketli ortalama (Çene olarak bilinir) 8 dönemlik düzleştirilmiş hareketli ortalama (Diş olarak bilinir) 5 dönemlik düzleştirilmiş hareketli ortalama (Dudaklar olarak bilinir) R Alligator göstergesi, hareketli ortalamaları yumuşatarak yanlış trend işlemlerinin sayısını azaltır. Temel
R Wolfe Wave göstergesi, fiyat hareketini analiz eder ve birikmiş verileri güçlü bir Wolfe Wave grafik modeli teknik aracına dönüştürür. Temelde, R Wolfe Wave grafik paterni hem yükseliş hem de düşüş eğilimi gösterebilir ve tüccarların gecikmeli göstergeler olmadan alım satım işlemleri açmasına yardımcı olabilir. Anahtar noktaları Güçlü Wolfe Wave modellerini tanımlar Gelişmiş tüccarlar için Herhangi bir döviz çifti için çalışır Gösterge koleksiyonunuza eklemeye değer Bu gösterge, herhangi bi
Bu gösterge, yüksek kazançlı sinyal alım satımları oluşturmak için birden fazla gösterge kullanır R Sinyalleri göstergesi, grafikte doğru alış ve satış oklarını basan eksiksiz bir FX ticaret sistemidir. Gösterge, ana MT4 grafik penceresinde renkli yeşil ve kırmızı oklar olarak görünür. Alım satım yaparken tek bir gösterge tarafından üretilen sinyalleri kullanmak riskli olabilir. Bunun nedeni, işlem yapmak için yalnızca bir gösterge kullanmanın daha fazla yanlış sinyal verebilmesidir. Bu ned
MT4 için R 2EMA Renk göstergesi, 2 EMA'nın geçişine dayalı sağlam alım satım sinyalleri sağlar. Anahtar noktaları Fiyat iki yeşil EMA'nın üzerine çıkıp kapandığında, bir alım satım sinyali oluşturur. Fiyat iki kırmızı EMA'nın üzerine çıkıp kapandığında, bir satış sinyali oluşturur. R 2EMA Renkli Forex göstergesi, ne zaman alım satım zamanı geldiğini belirlemeyi daha da kolaylaştırır 2 EMA satırı yeşile döndüğünde bir satın alma sinyali oluşur. 2 EMA çizgisi kırmızıya döndüğünde bir satış si
R Var Hareketli Ortalama Göstergesi, zorlu trend takipçileri için tasarlanmış bir trend takip göstergesidir. Hisse senedi tüccarları ve emtia tüccarları arasında oldukça popüler bir forex ticaret göstergesidir ve popülaritesi, kullanıcılarına gerçek para kazanma sinyalleri verme yeteneğinden kaynaklanmaktadır. Gösterge, bir sienna çizgisi üzerine yerleştirilmiş yeşil ve kırmızı noktalardan oluşur. Yeşil nokta yükseliş sinyalini, kırmızı nokta ise düşüş sinyalini gösteriyor. Temel Ticaret
R Wavy Dash göstergesi, fiyat verilerini ticarete giriş ve çıkış için çalışan mükemmel bir trend takip eden sinyaller göstergesine dönüştürür. Ana grafikte renkli bir sinyal çizgisi olarak görünür ve bağımsız bir ticaret aracı olarak kullanılabilir. R Wavy Dash göstergesi çok güvenilirdir, hafiftir ve ticaret platformunuzu yavaşlatmaz. Anahtar noktaları Trend sinyali göstergesi Çaylak dostu yeniden boyanmaz Gösterge koleksiyonunuza eklemeye değer Bu gösterge, olası bir trend tersine çevirme
Metatrader 4 için R Show Ticks göstergesi, ana ticaret penceresinde gerçek zamanlı olarak yukarı/aşağı tikleri gösterir. Temel Çıkarımlar Beyaz ok bir yükseliştir. Kırmızı ok bir düşüş işaretidir. Gösterge, tercih ettiğiniz herhangi bir döviz çifti ve zaman çerçevesi için çalışır. Gösterge Özellikleri İşlem Platformu: Metatrader 4 (MT4) için geliştirildi Döviz çiftleri: Herhangi bir çift için çalışır Zaman dilimleri: Herhangi bir zaman dilimi için çalışır Giriş Parametreleri: Giriş se
R Delta RSI göstergesi, hızlı bir RSI (periyot 14) ve yavaş RSI'nin (50 periyodu) bir sinyal seviyesiyle kesişmesine dayalı olarak renkli bir alış ve satış histogramı çizer. Kırmızı renkli bir histogram, trendin yükselişe geçtiğini gösterir (alış sinyali). Yeşil renkli bir histogram, trendin düşüş eğiliminde olduğunu gösterir (satış sinyali). Gri renkli bir histogram, trendin düz veya aralığa bağlı olduğunu (sinyal yok) gösterir. Bu forex göstergesi, tek başına veya diğer trend takip göster
Filtrele:
İnceleme yok
İncelemeye yanıt