Super Neuro Trend
- Göstergeler
- Mati Maello
- Sürüm: 1.0
- Etkinleştirmeler: 5
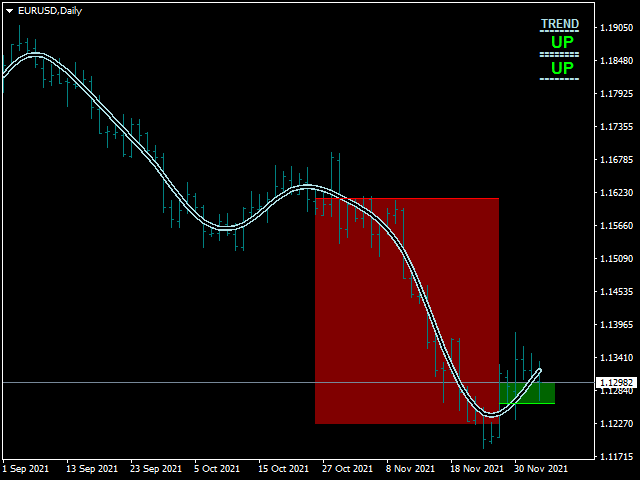
This indicator Super Neuro Trend indicator.Indicator displays trend movement.Indicator helps to buy and sell.
Features
- FiltPer- displays indicator period.
- deviation - displaus indicator deviation.
- Trend - displaus indicator trend.( true,false)
- Rectangle - displaus indicator rectangle. (true,false)
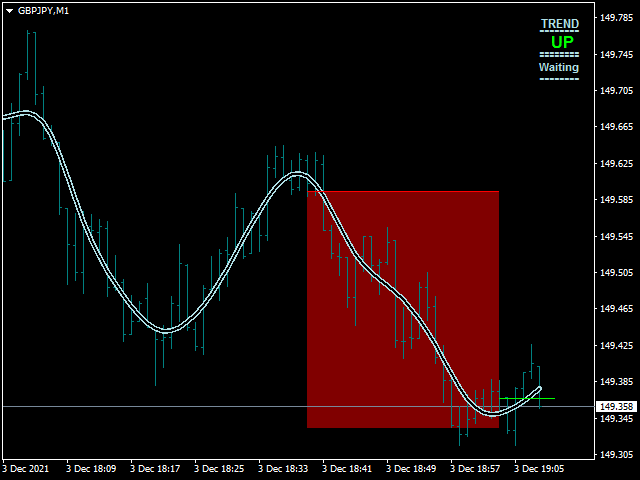
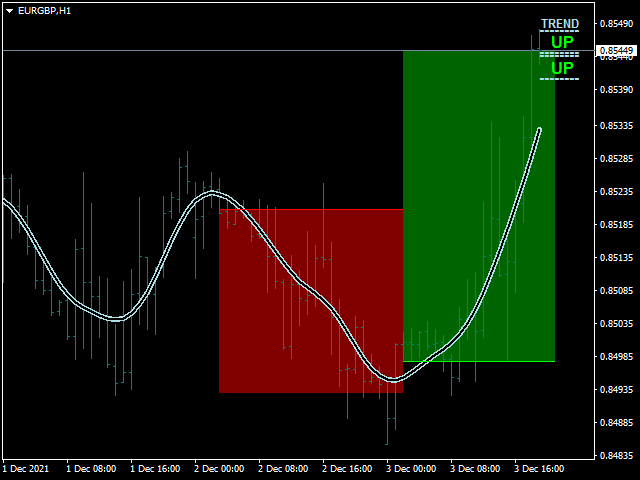
How to understand the status:
- If the trend color is green, trend is up.
- If the trend color is red, trend is down.
- If the trend waiting,trend waiting.
////////////////////////////////////////////////////////////////////////////////////////////////////////////////////////////////////////////////////
//////////////////////////////////////////////////////////////////////////////////////////////////////////////////////////////////////////////////////
//////////////////////////////////////////////////////////////////////////////////////////////////////////////////////////////////////////////////////
//////////////////////////////////////////////////////////////////////////////////////////////////////////////////////////////////////////////////////
//////////////////////////////////////////////////////////////////////////////////////////////////////////////////////////////////////////////////////
//////////////////////////////////////////////////////////////////////////////////////////////////////////////////////////////////////////////////////
//////////////////////////////////////////////////////////////////////////////////////////////////////////////////////////////////////////////////////
//////////////////////////////////////////////////////////////////////////////////////////////////////////////////////////////////////////////////////
//////////////////////////////////////////////////////////////////////////////////////////////////////////////////////////////////////////////////////
//////////////////////////////////////////////////////////////////////////////////////////////////////////////////////////////////////////////////////
//////////////////////////////////////////////////////////////////////////////////////////////////////////////////////////////////////////////////////
//////////////////////////////////////////////////////////////////////////////////////////////////////////////////////////////////////////////////////
//////////////////////////////////////////////////////////////////////////////////////////////////////////////////////////////////////////////////////
/////////////////////////////////////////////////////////////////////////////////////////////////////////////////////////////////////////////////////
/////////////////////////////////////////////////////////////////////////////////////////////////////////////////////////////////////////////////////
/////////////////////////////////////////////////////////////////////////////////////////////////////////////////////////////////////////////////////
////////////////////////////////////////////////////////////////////////////////////////////////////////////////////////////////////////////////////
////////////////////////////////////////////////////////////////////////////////////////////////////////////////////////////////////////////////////