Dashboard RSI Multicurrency
- Göstergeler
- Taras Slobodyanik
- Sürüm: 5.20
- Güncellendi: 14 Mart 2024
- Etkinleştirmeler: 10
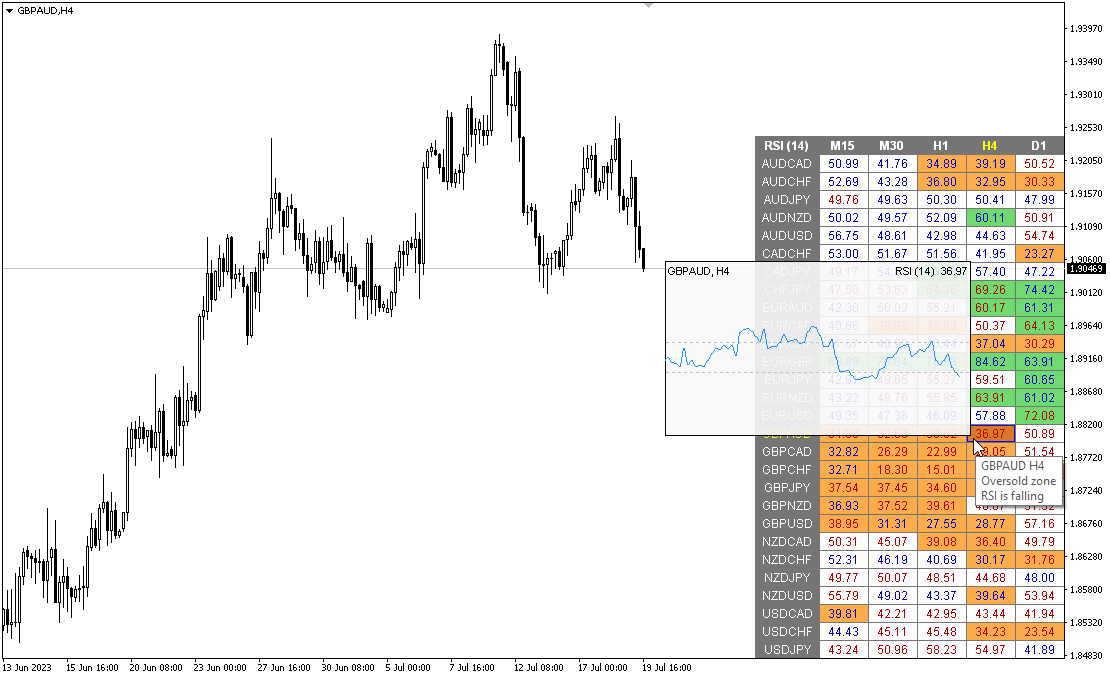
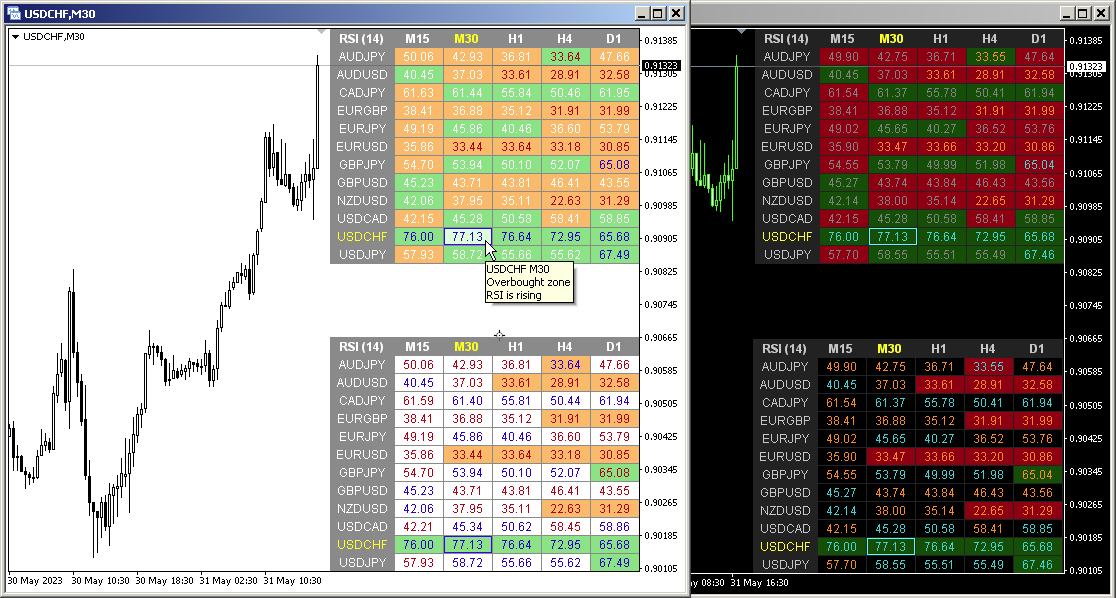
Göreceli Güç Endeksi (RSI) göstergesinin çoklu para birimi ve çoklu zaman çerçeveli modifikasyonu. Parametrelerde istediğiniz para birimini ve zaman dilimlerini belirtebilirsiniz. Ayrıca panel aşırı alım ve aşırı satım seviyelerini geçerken bildirim gönderebilir. Noktalı bir hücreye tıkladığınızda bu sembol ve nokta açılacaktır. Bu MTF Tarayıcıdır.
Kontrol panelini grafikten gizlemenin anahtarı varsayılan olarak "D"dir.
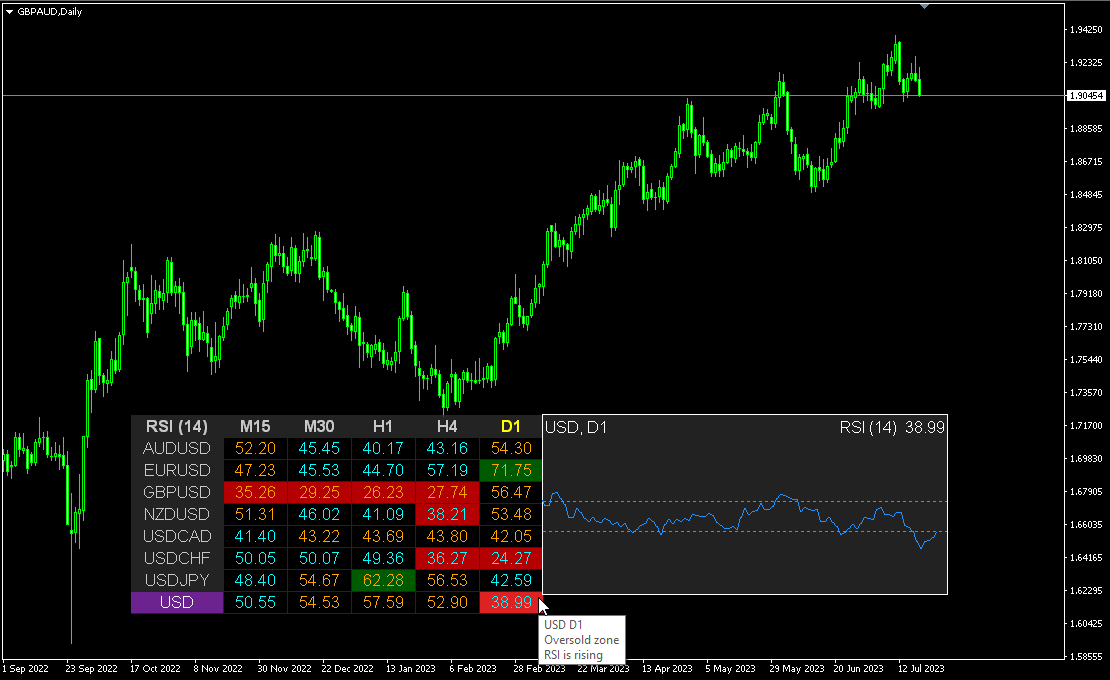
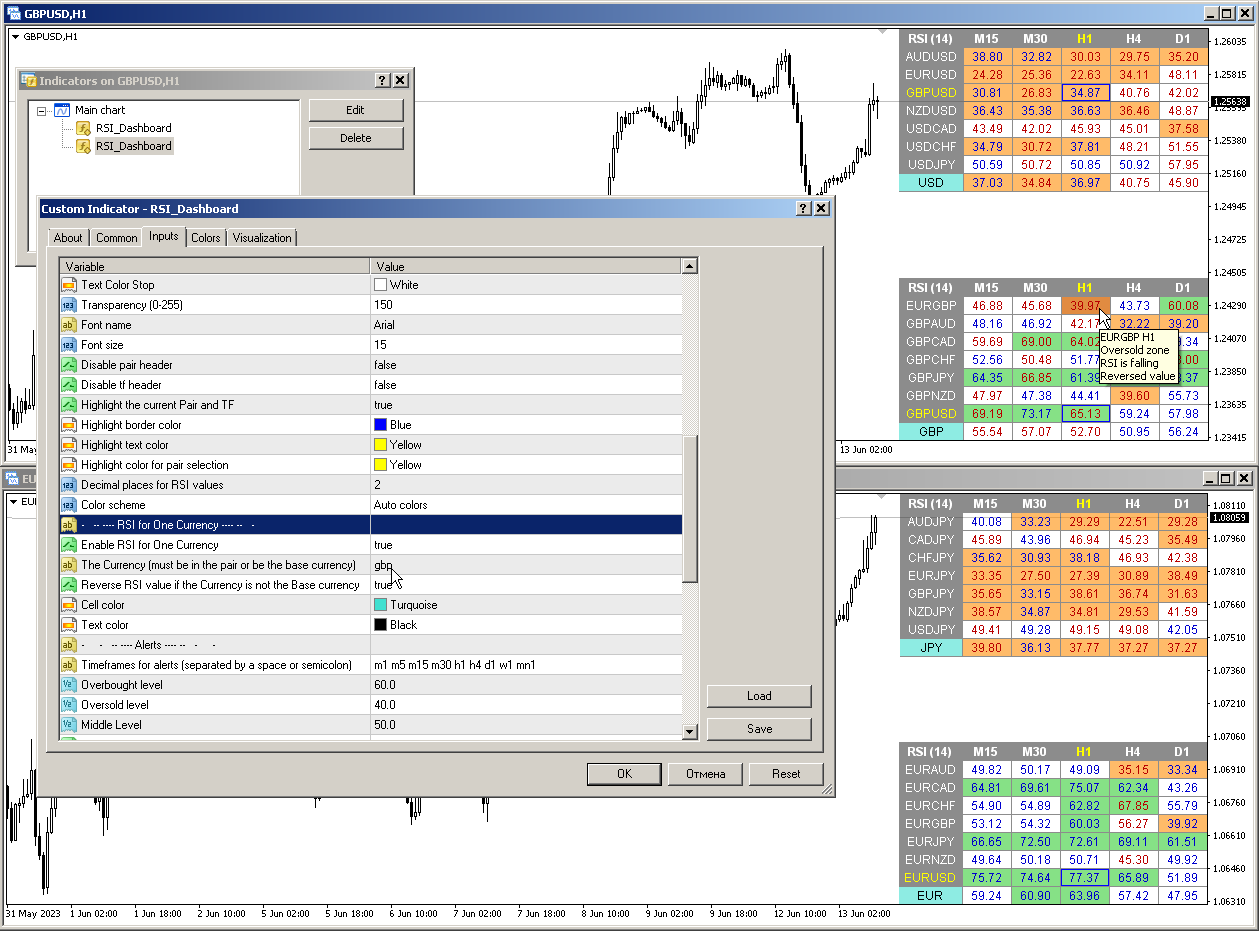
Para Birimi Gücü Ölçer'e benzer şekilde, Kontrol Paneli, belirtilen Para Birimini içeren çiftleri veya bu Para Birimini temel alan çiftleri otomatik olarak seçebilir. Gösterge ayrıca bu Para Birimi için RSI'yi ayrı bir satırda hesaplayacaktır.
Parametreler
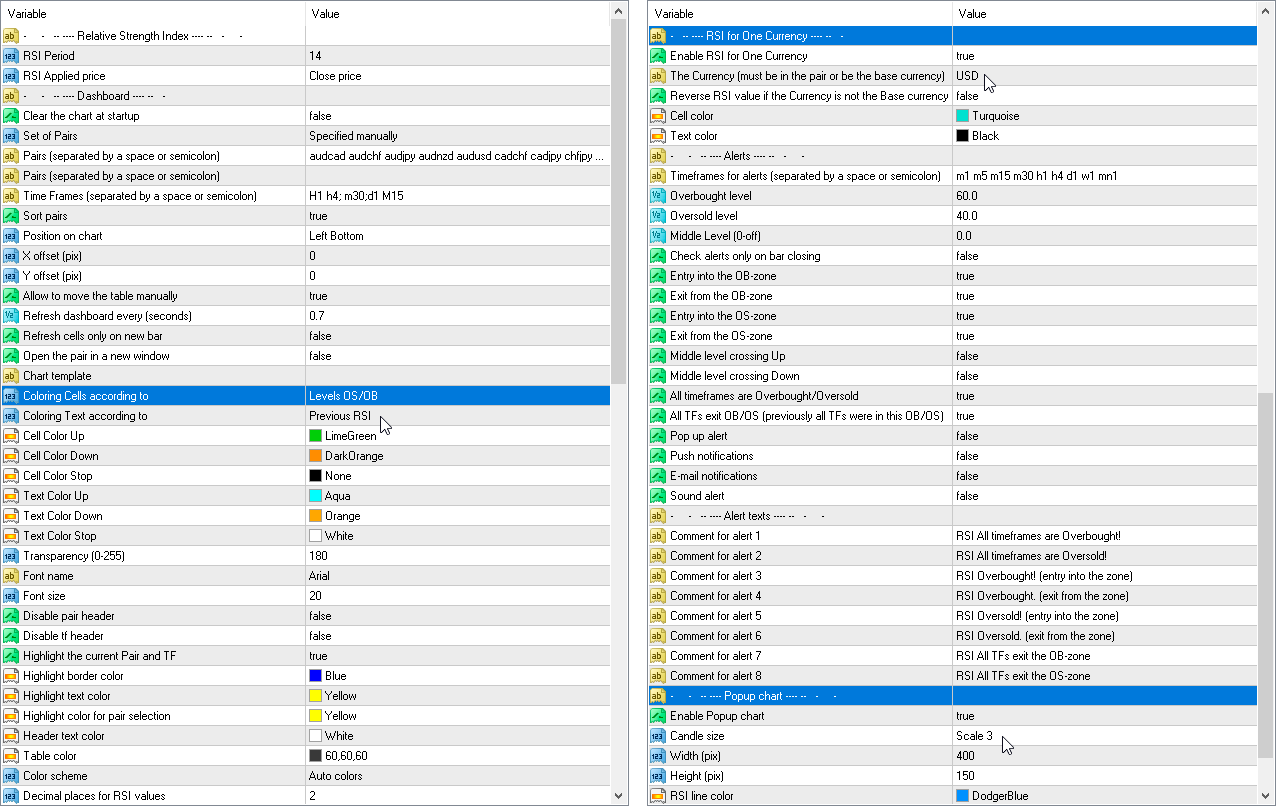
RSI Period — ortalama dönem.
RSI Applied price — fiyat türü.
Clear the chart at startup — başlangıçta grafiği temizleyin.
Set of Pairs — semboller kümesi
— Market Watch — "Piyasa Gözlemi"nden eşlemeler.— Specified manually — "Çiftler" parametrelerinde manüel olarak belirtilen çiftler.— Current pair — yalnızca geçerli çifti gösterir.
Pairs (separated by a space or semicolon) — boşluk veya noktalı virgülle ayrılmış sembollerin listesi. Para birimi adları, büyük/küçük harf ve önek/sonek korunarak tam olarak komisyoncununki gibi yazılmalıdır.
Time Frames (separated by a space or semicolon) — boşluk veya noktalı virgülle ayrılmış zaman dilimlerinin listesi (çoklu zaman dilimi).
Sort pairs — çiftlerin listesini sıralama.
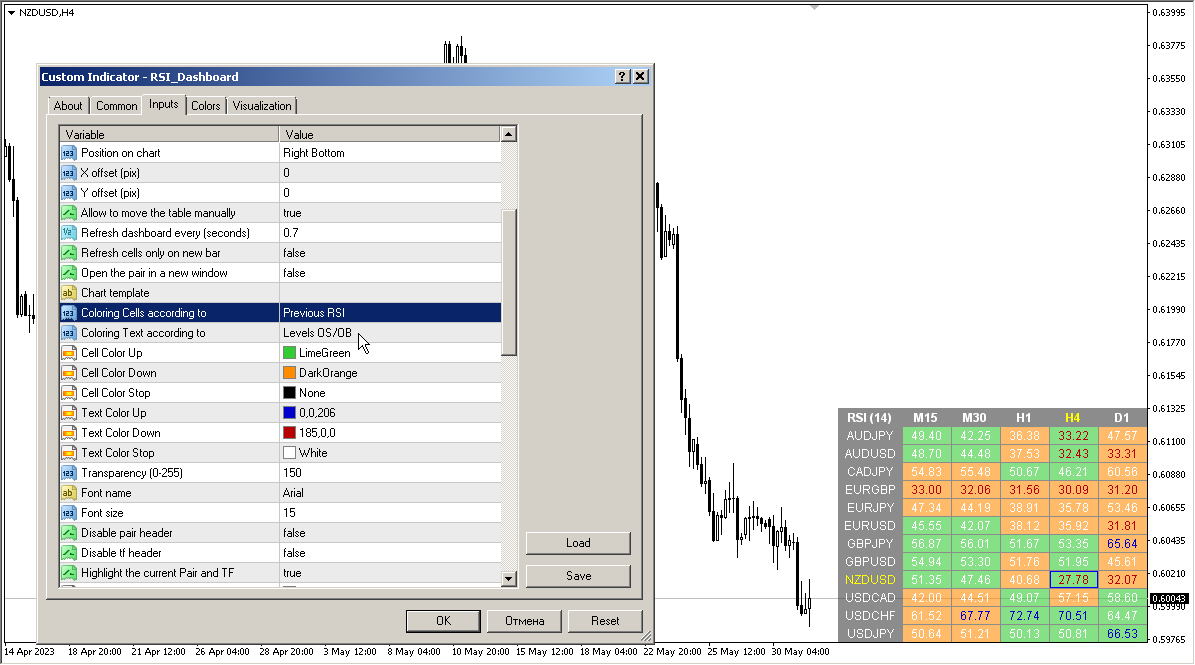
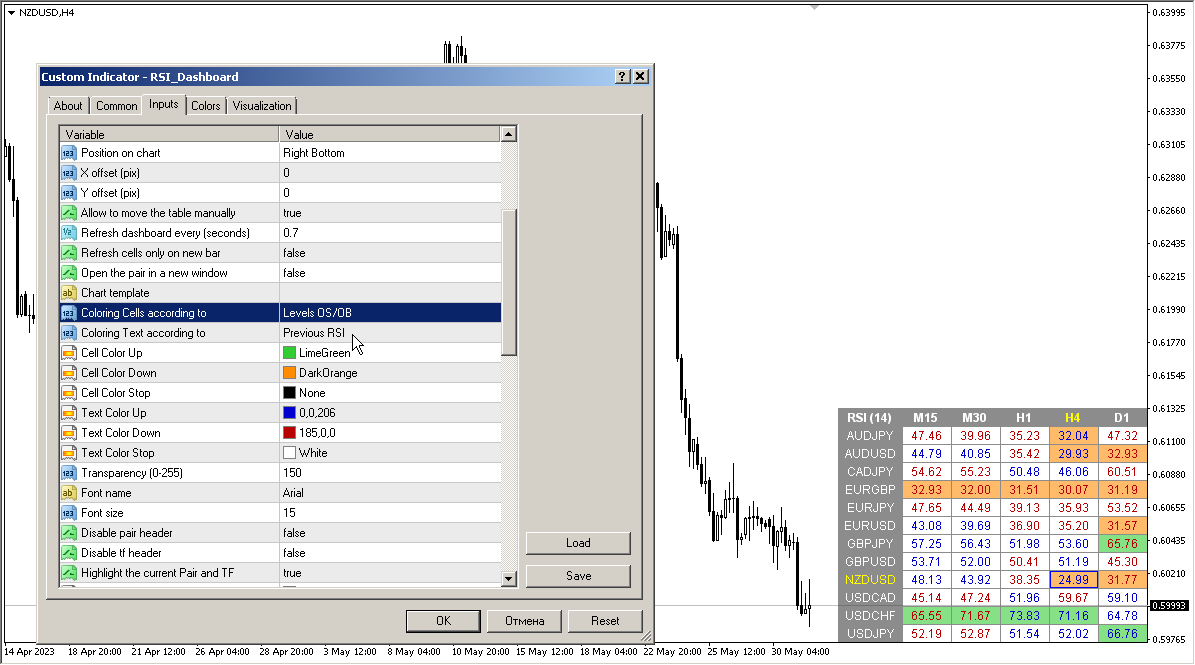
Position on chart — panelin grafikte görüntüleneceği köşe.
X offset (pix) — paneli X ekseni boyunca kaydırın;
Y offset (pix) — paneli Y ekseni boyunca kaydırın;
Refresh dashboard every (seconds) — tüm çiftler ve zaman dilimleri için güncelleme süresi.
Refresh cells only on new bar — hücre güncellemeleri (ve uyarılar) yalnızca yeni bir çubuk göründüğünde gerçekleşir.
Open the pair in a new window — tıklayarak yeni bir grafik penceresinde bir sembol açın.
Chart template — Grafik şablonu — grafik yeni bir pencerede açılırsa, grafiğin şablonunun adı.
Coloring the cells according to the — Tablodaki hücreleri aşırı alım/aşırı satım seviyelerine veya önceki mumun yönüne göre boyayın.
Color Up — gösterge artarsa hücre rengi.
Color Down — gösterge azalırsa hücre rengi.
Color Stop — gösterge değişmezse hücre rengi.
Transparency (0-255) — panelin şeffaflığı.
Font name — yazı tipi adı.
Font size — yazı tipi boyutu.
Uyarılar
Timeframes for alerts (separated by a space or semicolon) — Uyarılar için zaman dilimleri (boşluk veya noktalı virgülle ayrılmış olarak) — uyarının gönderileceği dönemlerin listesi (boşluk veya noktalı virgülle ayrılmış olarak).
Overbought level — uyarılar için aşırı alım seviyesi.
Oversold level — uyarılar için aşırı satış seviyesi.
Middle Level — Orta seviye
Check alerts only on bar closing — hemzemin geçidi yalnızca çubuk kapandıktan sonra kontrol edin.
Entry into the OB-zone — OB bölgesine giriş
Exit from the OB-zone — OB bölgesinden çıkış
Entry into the OS-zone — İşletim sistemi bölgesine giriş
Exit from the OS-zone — İşletim sistemi bölgesinden çıkış
Middle level crossing Up — Orta seviye geçişi Yukarı
Middle level crossing Down — Orta seviye geçiş Aşağı
Alert when RSI direction changes — RSI yönü değiştiğinde uyarı
All timeframes are Overbought/Oversold — Tüm zaman dilimleri Aşırı Alım/Aşırı Satıştır
All TFs exit OB/OS (previously all TFs were in this OB/OS) — Tüm TF'ler OB/OS'tan çıkar (daha önce tüm TF'ler bu OB/OS'taydı)
Pop up alert — açılır pencere uyarısı.
Push notifications — anında bildirim.
E-mail notifications — e-posta bildirimi.
Sound alert — sesli uyarı.


TARAS is the "KING OF THE DASHBOARDS", not even close! Responds promptly and professionally to any inquiries and takes into consideration your request / suggestion if it will improve the indicator. Very clever features with a robust alert system. His Heiken Ashi Dash is equally superb. This cat is not your average Joe! THANKS!