RSI Pro Analyser MT4
- Göstergeler
- Frederic Jacques Collomb
- Sürüm: 1.0
- Etkinleştirmeler: 5
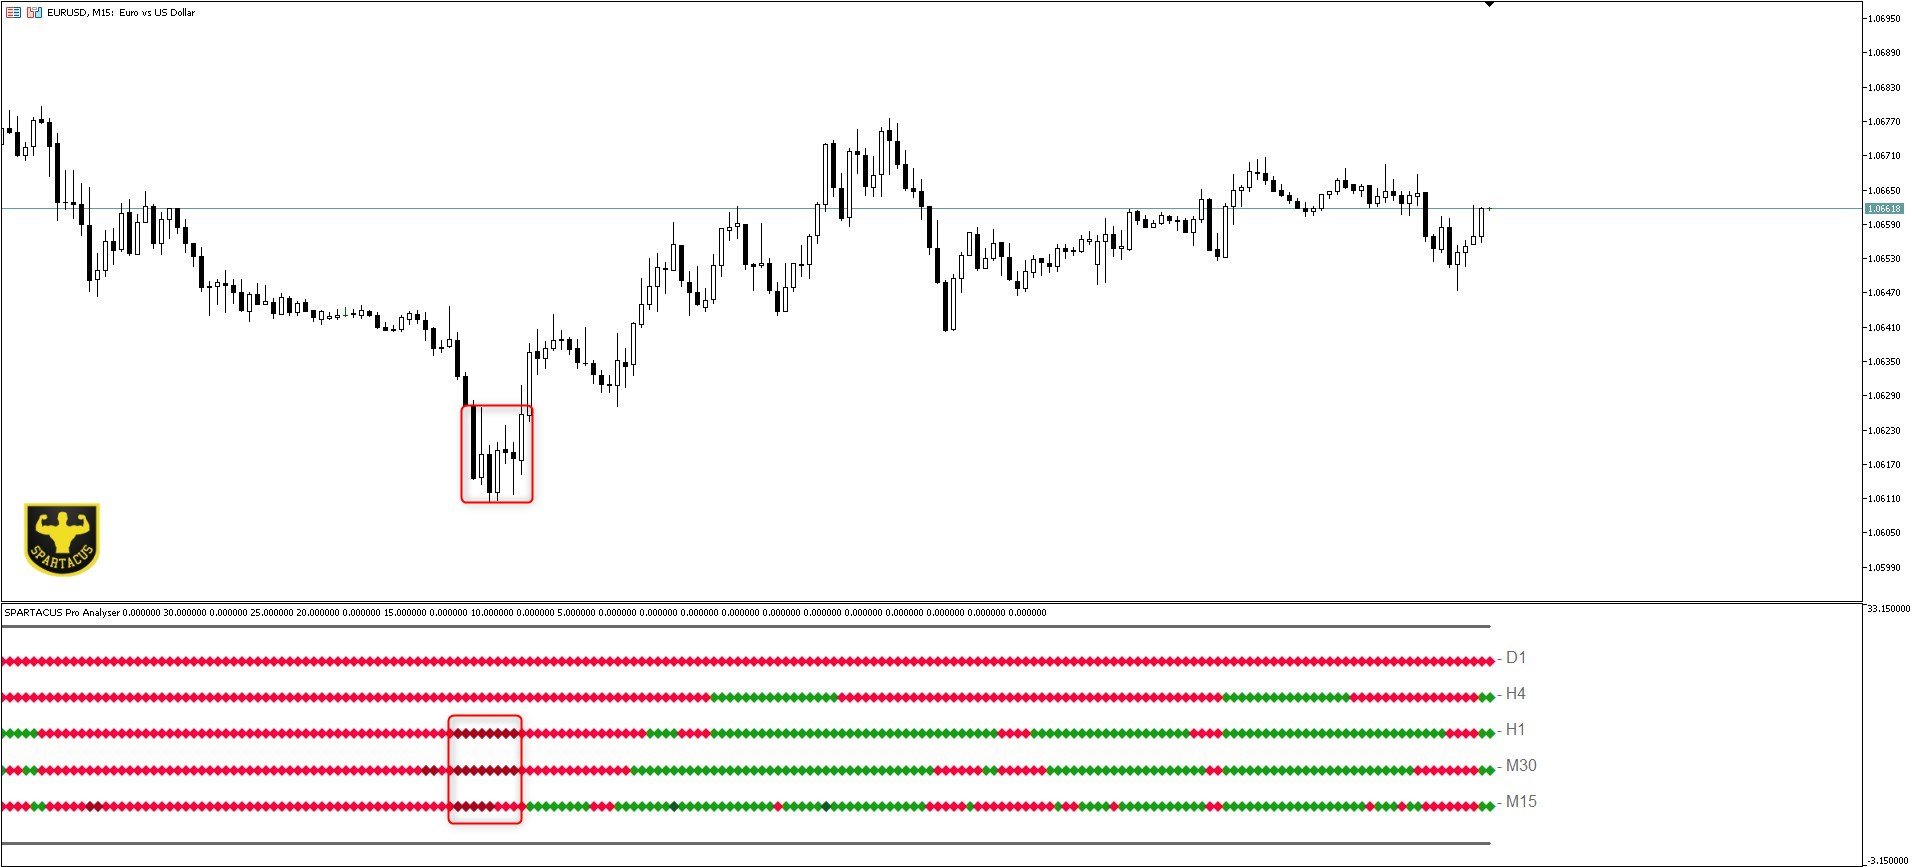
RSI Pro Analyser Göstergesi, aynı anda birden fazla zaman diliminde bilinçli kararlar vermek isteyen yatırımcılar için tasarlanmış güçlü bir araçtır. Bu gösterge aşırı alım, aşırı satış ve trend sinyalleri sağlamak için RSI'yı kullanarak piyasaya giriş fırsatlarını tanımlamayı kolaylaştırır. Farklı piyasa koşullarını gösteren açık ve belirgin renk kodları sayesinde okuma kolaylığı sağlaması en büyük avantajıdır.
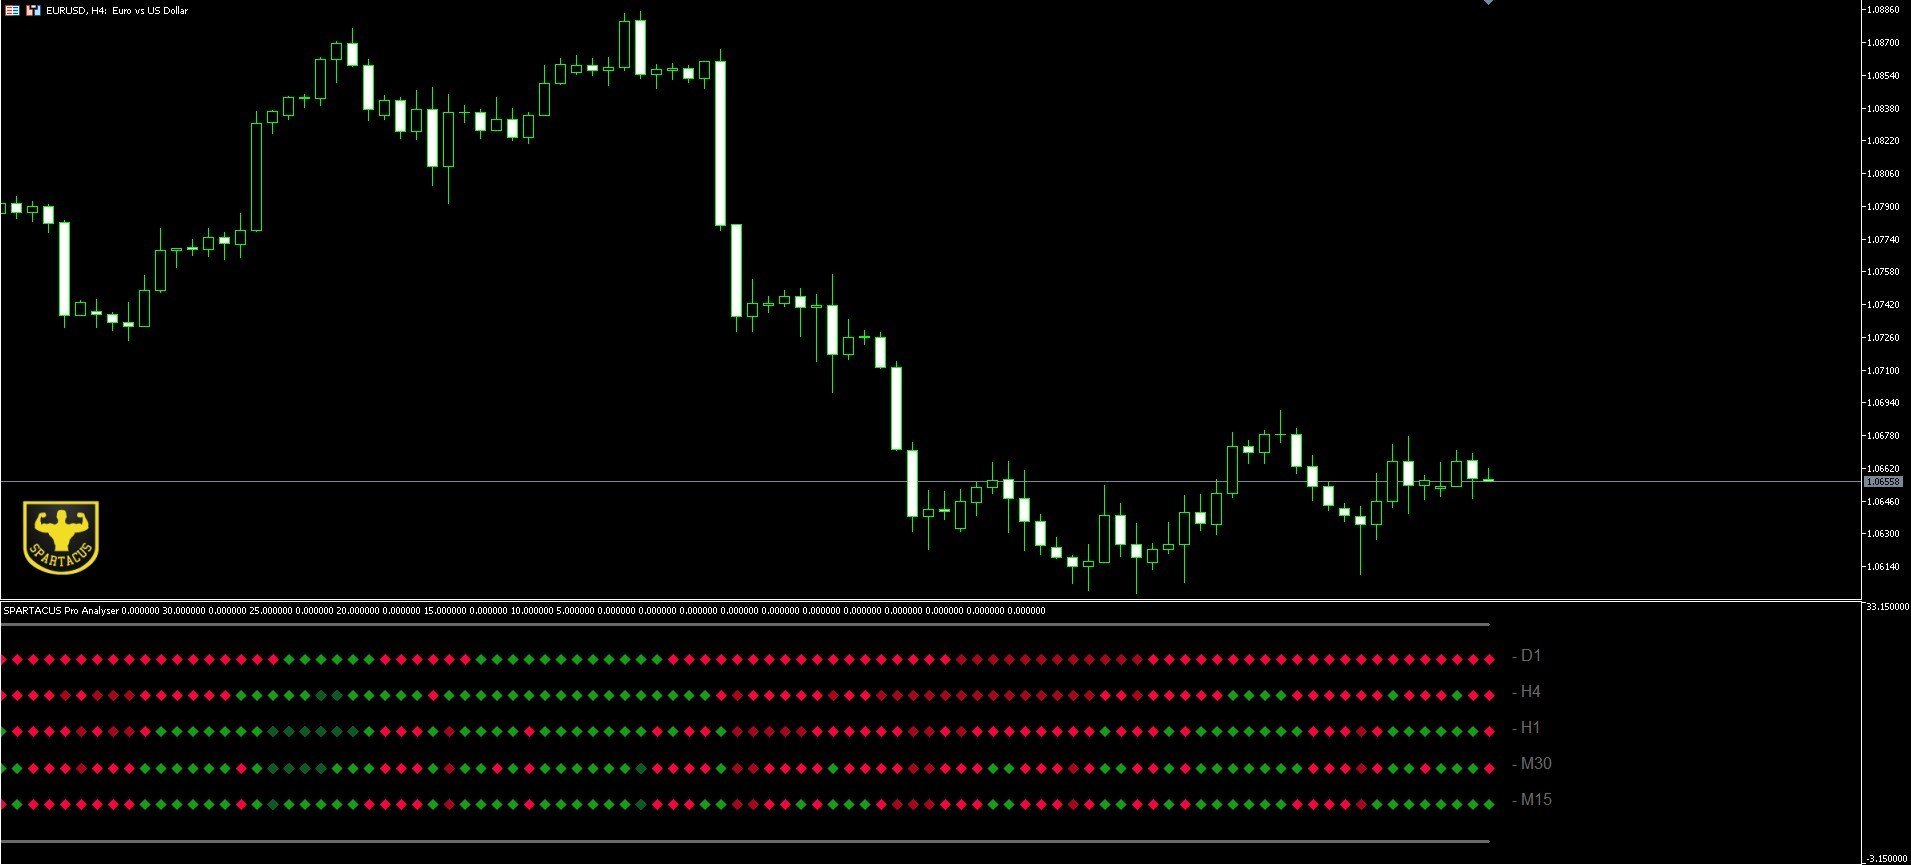
Gösterge, RSI değerlerini ve ilgili sinyalleri beş farklı zaman diliminde (D,H4,H1,M30,M15) görüntüleyerek yatırımcıların kapsamlı bir piyasa perspektifi elde etmesine ve birden fazla zaman diliminde bilinçli kararlar almasına olanak tanır.
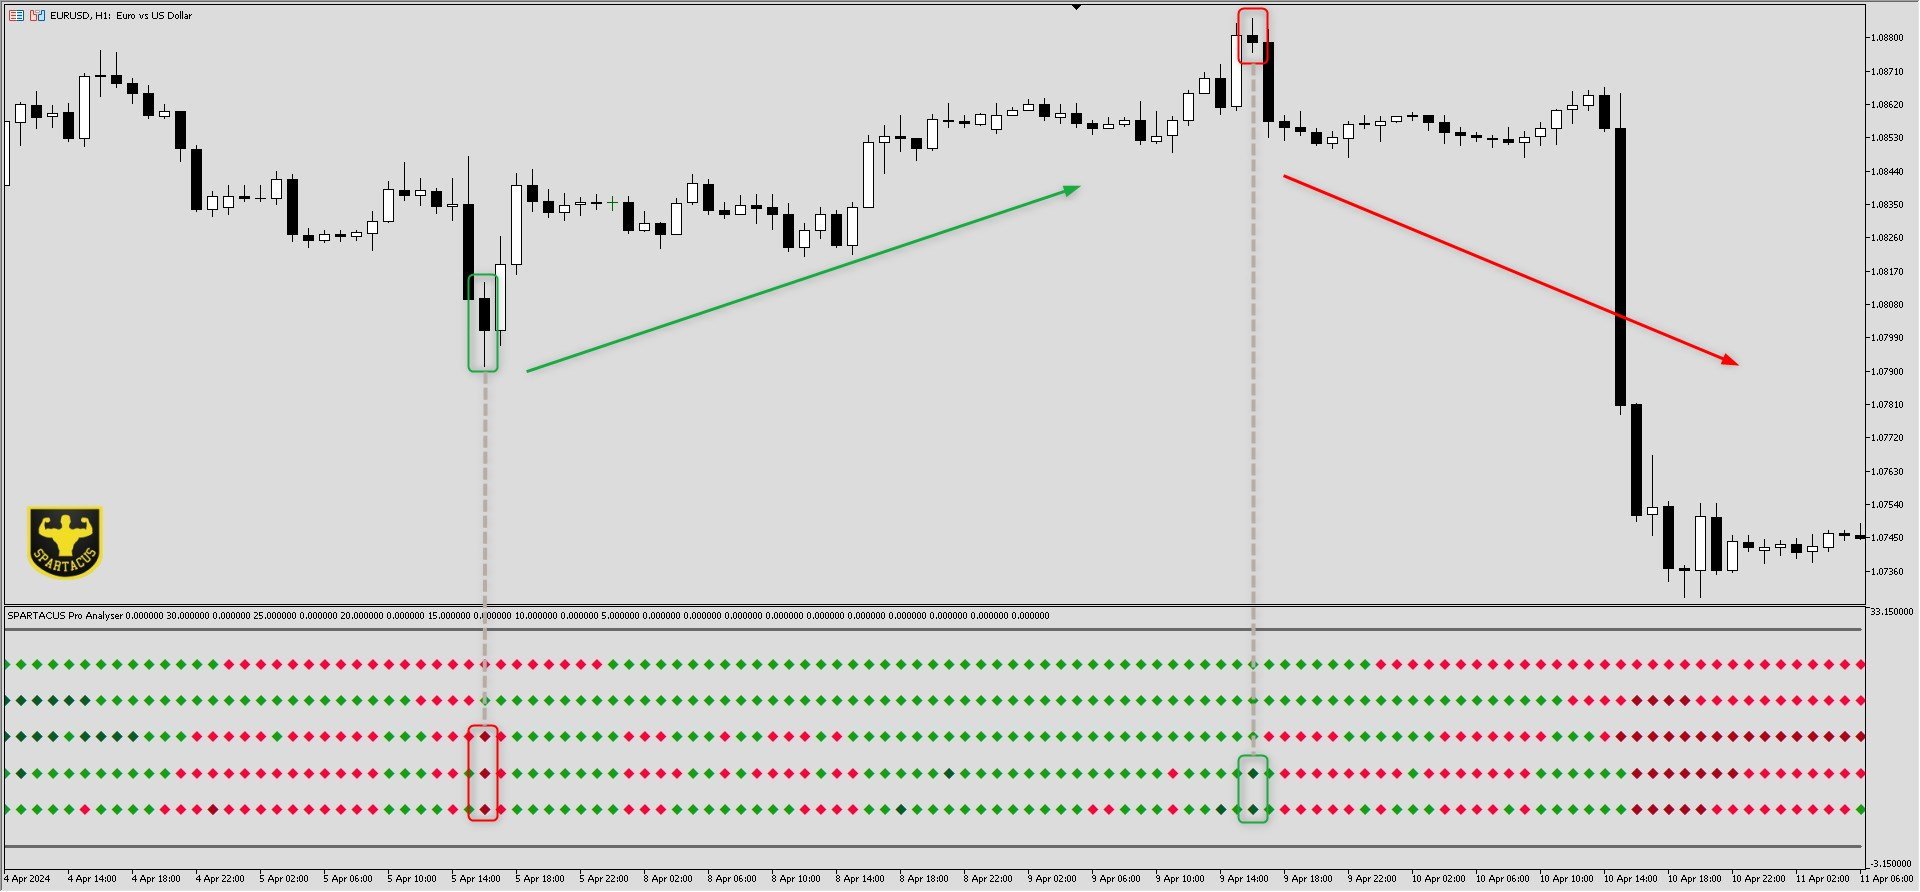
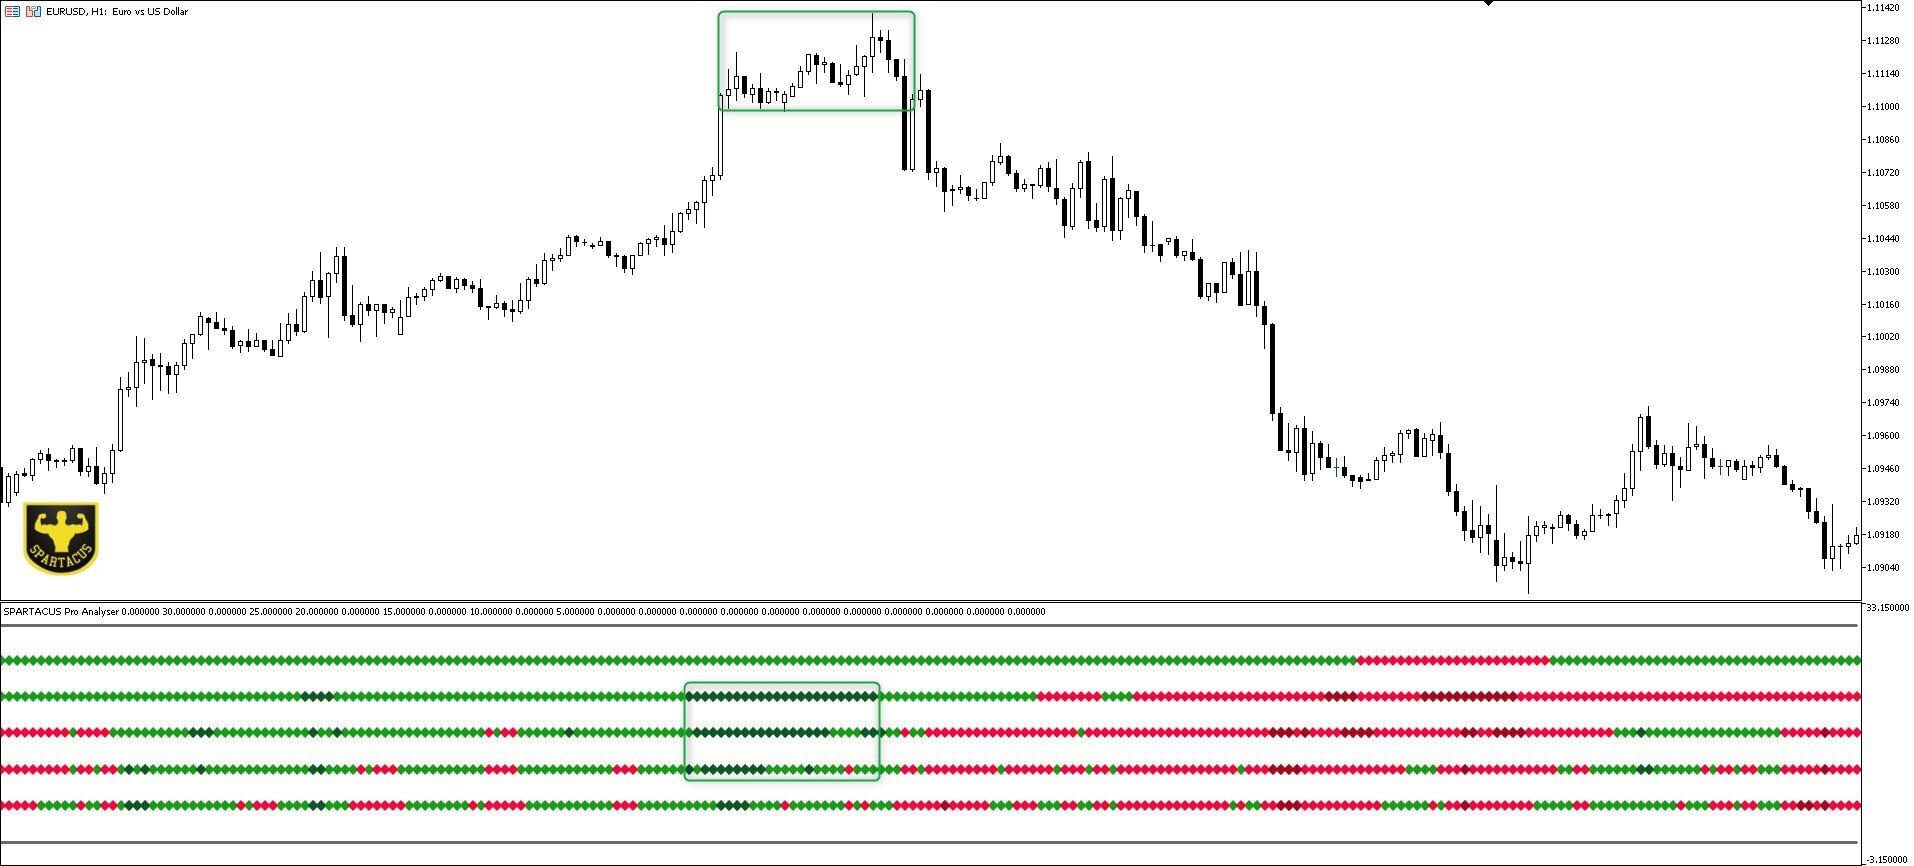
Farklı zaman dilimlerindeki eğilimleri ve olası geri dönüşleri belirlemek için renk değişikliklerini kullanın. Karşı trendi veya trendin tersine çevrilmesi ticaret fırsatlarını tespit etmek için aşırı alım ve aşırı satım alanlarını arayın.
Kırmızı: RSI düşüş trendini gösteriyor.
Yeşil: RSI yükseliş trendini gösteriyor.
Koyu kırmızı: RSI aşırı satım bölgesini işaret ediyor.
Koyu yeşil: RSI aşırı alım bölgesine işaret ediyor.
Ayrıca Pop-Up, e-posta ve Push bildirimi yoluyla gönderilebilecek kesin uyarılarla satın alma ve satış girişlerinden haberdar olabilirsiniz.
RSI Pro Analizörü göstergesi, yatırımcının karar verme sürecinde tamamlayıcı bir araçtır. Piyasaya genel bir bakış elde etmek için diğer göstergeler ve analizlerle birlikte kullanılması tavsiye edilir.
MT5 sürümü.
Giriş parametresi:
RSI period: 14 (varsayılan), tercihlerinize göre ayarlanabilir.
Enable/disable alert: 3 tür uyarıyı, Açılır Pencere/posta ve Anlık bildirimi etkinleştirin veya devre dışı bırakın.
Buy/Sell text: Tamamen yapılandırılabilir uyarı metni.
SPARTACUS®2024
Gösterge, RSI değerlerini ve ilgili sinyalleri beş farklı zaman diliminde (D,H4,H1,M30,M15) görüntüleyerek yatırımcıların kapsamlı bir piyasa perspektifi elde etmesine ve birden fazla zaman diliminde bilinçli kararlar almasına olanak tanır.
Farklı zaman dilimlerindeki eğilimleri ve olası geri dönüşleri belirlemek için renk değişikliklerini kullanın. Karşı trendi veya trendin tersine çevrilmesi ticaret fırsatlarını tespit etmek için aşırı alım ve aşırı satım alanlarını arayın.
Kırmızı: RSI düşüş trendini gösteriyor.
Yeşil: RSI yükseliş trendini gösteriyor.
Koyu kırmızı: RSI aşırı satım bölgesini işaret ediyor.
Koyu yeşil: RSI aşırı alım bölgesine işaret ediyor.
Ayrıca Pop-Up, e-posta ve Push bildirimi yoluyla gönderilebilecek kesin uyarılarla satın alma ve satış girişlerinden haberdar olabilirsiniz.
RSI Pro Analizörü göstergesi, yatırımcının karar verme sürecinde tamamlayıcı bir araçtır. Piyasaya genel bir bakış elde etmek için diğer göstergeler ve analizlerle birlikte kullanılması tavsiye edilir.
MT5 sürümü.
Giriş parametresi:
RSI period: 14 (varsayılan), tercihlerinize göre ayarlanabilir.
Enable/disable alert: 3 tür uyarıyı, Açılır Pencere/posta ve Anlık bildirimi etkinleştirin veya devre dışı bırakın.
Buy/Sell text: Tamamen yapılandırılabilir uyarı metni.
SPARTACUS®2024