• Genel bakış
  • İncelemeler
  • Yorumlar

ATR Zone MT5

ATR is an important indicator for any financial market. The abbreviation ATR stands for Average True Range. This indicator is a tool to determine the volatility of the market, this is its direct purpose. ATR shows the average price movement for the selected period of time.

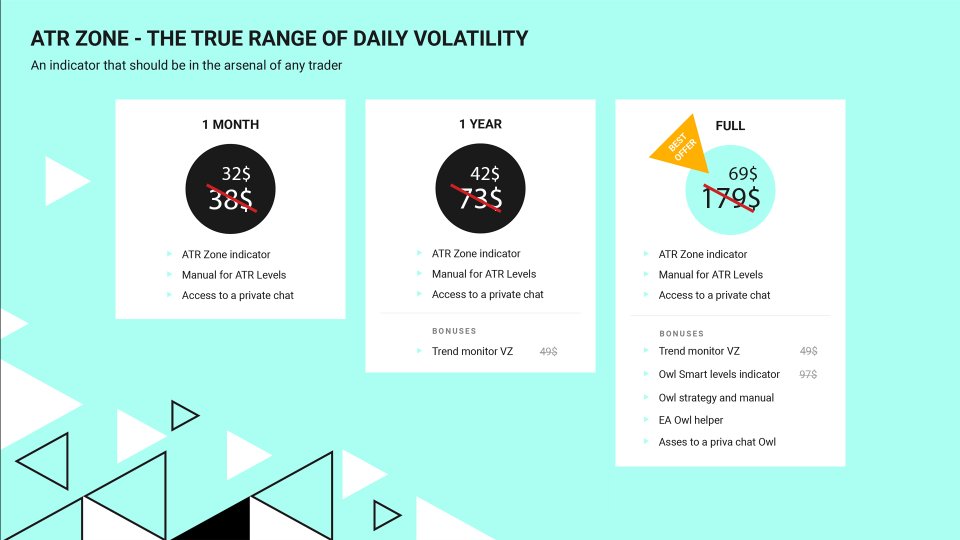
The initial price of the indicator is 63$. The price will increase every 10 sales up to 179$

The original ATR indicator is present in many trading programs. The ATR indicator is not very informative, so I modified its data and got the ATR Zone Indicator. The ATR Zone Indicator displays levels on the chart, which are more understandable and convenient for making trading decisions. In addition, I have added some important recommendations on calculating the indicator from trading guru Alexander Gerchik.

After purchase write me in private messages and you will receive:

  • A manual with detailed instructions for the indicator
  • Trend Monitor Indicator
  • Owl Smart Levels Indicator
  • Owl Helper Expert Advisor
  • Access to private user chat

How does the Indicator calculate?

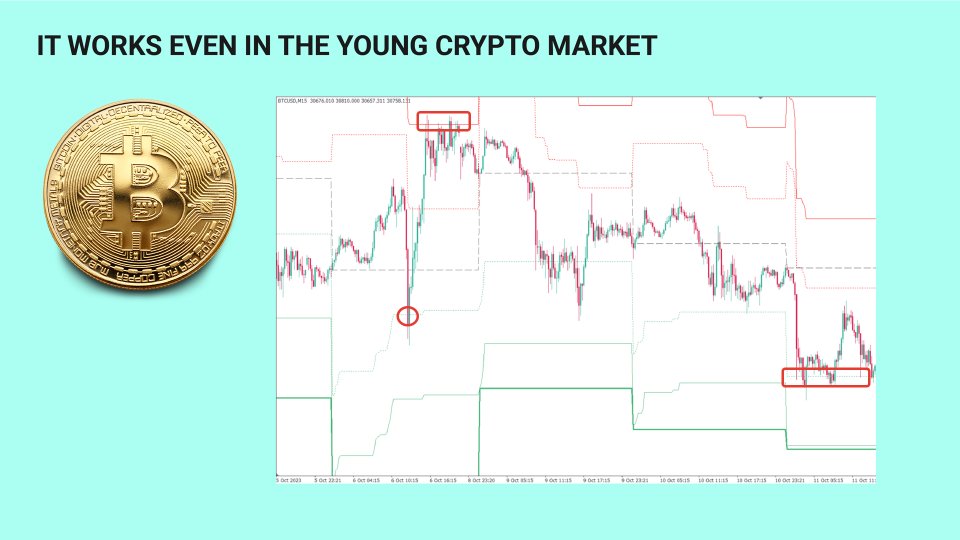
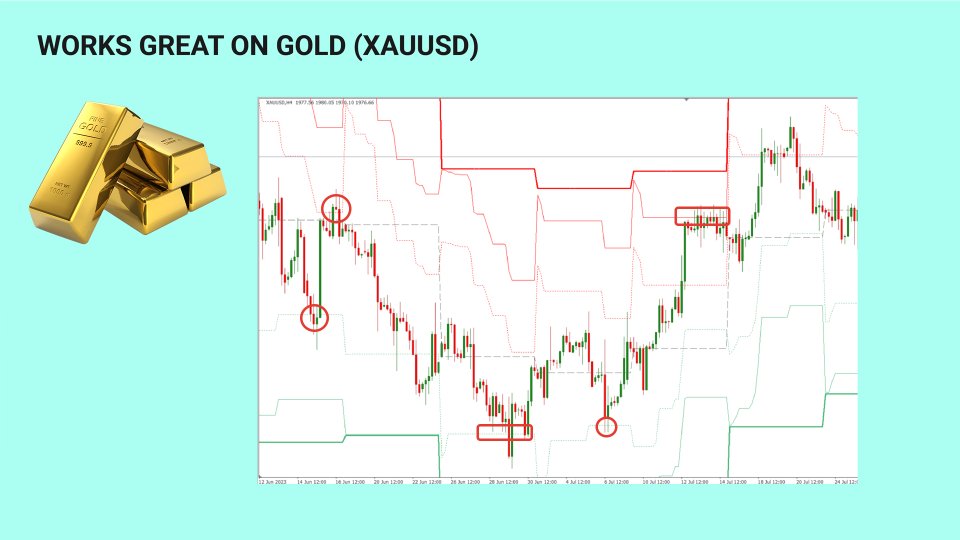
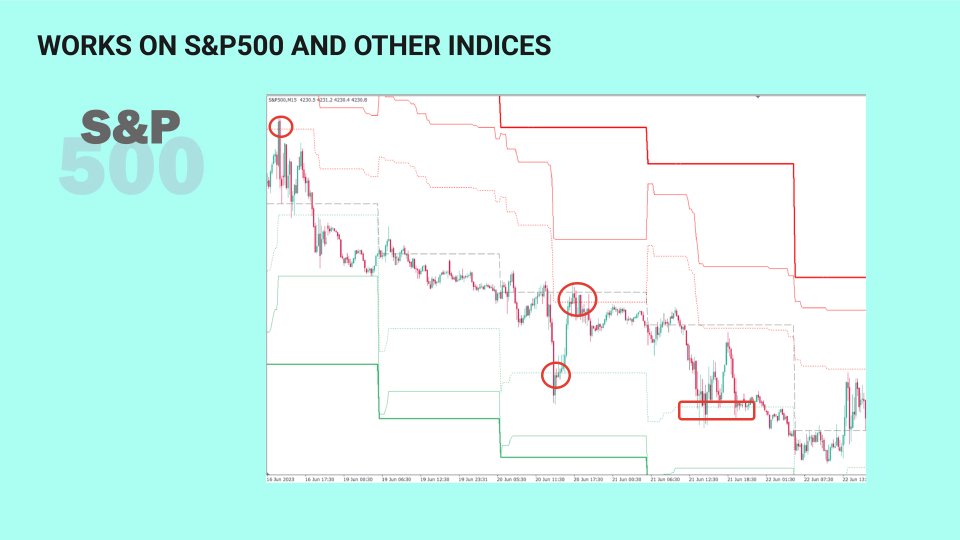
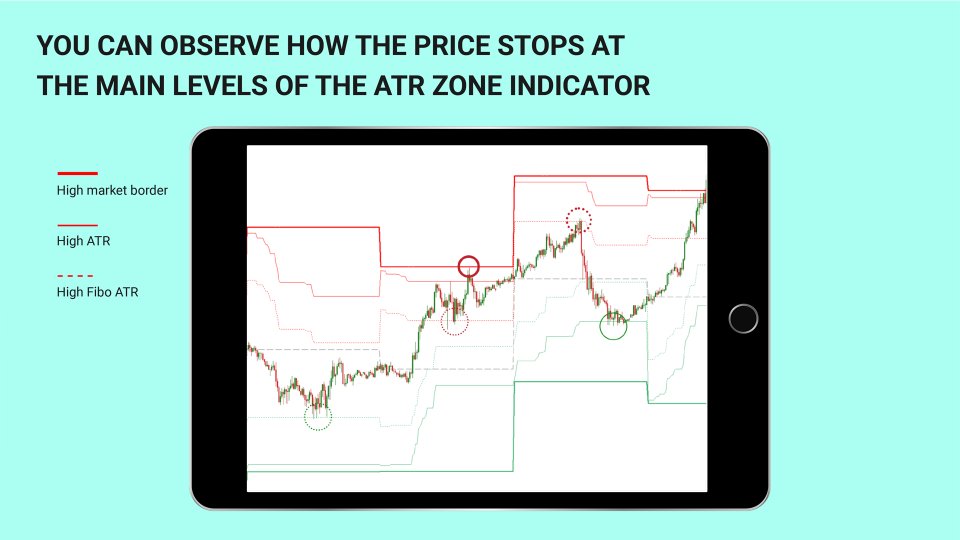
The most important indicator that we really need in intraday trading is the average daily price movement. Knowing the average daily price movement, we can set the limits (trading levels) on the chart, at which the market will lose energy. These levels are marked by the ATR Zone Indicator with bold red and green lines.

IMPORTANT!!! The ATR Zone Indicator calculates the average daily range of price movement (counts D1 candlesticks), and builds levels on a smaller timeframe.

So even on the timeframe M1, M5, M15, H1 you get the levels of the average daily range, which is more informative during intraday trading.

Earlier I talked about important additions to the indicator. Popular trader Alexander Gerchik recommends using the average value of the price movement for the last 5 days, but you should not take into account extremely large and extremely small daily bars. I listened to his recommendation and applied this rule in the ATR Zone Indicator.

Parameters of the ATR Zone Indicator. 

  • The beginning of the day - the beginning of the indicator countdown.

I think it is wrong to take the beginning of the countdown 00:00 hours of the current day. It is more correct to take the time of the beginning of the trading session in one of the trading zones as the starting point. In my trading I take the start time of the European trading session as the starting point.

  • ATR averaging period - number of days for calculating the average value of the daily price movement
  • Exclude the bar more - the coefficient of large bars, which excludes bars that are too large from the calculation of the average ATR value (value 2 means that bars, that are more than 2 times the average ATR, do not participate in the calculations).
  • Exclude smaller bars - the coefficient of small bars, which excludes bars that are too small from the calculation of the average ATR value (value 0.5 means that bars, that are less than 50% of the average ATR, do not participate in the calculation)
  • Fibo level - Fibonacci level for building additional levels (dotted levels)
  • The number of bars to calculate - number of bars to the left to display on the chart


I'm Sergey Ermolov, subscribe to my updates!


Önerilen ürünler
WT Vwap 5 Bands
Ricardo Almeida Branco
5 (1)
WT Vwap 5 Bands The WT Vwap Bands indicator is an indicator that combines price and volume, helping to show whether the price is within the "fair price", overbought or oversold. The indicator code was designed for performance and has already been tested in a real trading account. In addition to the visual inputs (color, thickness and line style), the user can define a% value that depends on the price. The default values work with the most distant band at 1% of the price and then di
VolumeDeltaWaves
Stanislav Korotky
5 (1)
This indicator is an extended implementation of Weis waves. It builds Weis waves on absolute volumes (which is the classical approach) or delta of volumes (unique feature) using different methods of wave formation and visualization. It works with real volumes, if available, or with tick volumes otherwise, but also provides an option to use so called "true volume surrogates", as an artificial substitution for missing real volumes (for example, for Forex symbols), which was introduced in correspo
Sinal IFR
Aurenice Barros De Abreu Carvalho
Sinal com base no indicador RSI, que indica compra marcando com uma seta verde quando o preco sai da região de sobrevendido, e sinaliza venda quando o preco sai da regiao de sobrecomprado. A sinalizacão é  feita com uma seta verde para compra e seta rosa para venda. Permite configurar o nível de sobrecompra e de sobrevenda, além do período do RSI. Funciona em qualquer período gráfico.
The indicator is the advanced form of the MetaTrader 4 standard Fibonacci tool. It is unique and very reasonable for serious Fibonacci traders. Key Features Drawing of Fibonacci retracement and expansion levels in a few seconds by using hotkeys. Auto adjusting of retracement levels once the market makes new highs/lows. Ability to edit/remove any retracement & expansion levels on chart. Auto snap to exact high and low of bars while plotting on chart. Getting very clear charts even though many ret
Optimized Trend Tracker OTT is an indicator that provides traders to find an existing trend or in another words to ser which side of the current trend we are on. We are under the effect of the uptrend in cases where the prices are above OTT , under the influence of a downward trend, when prices are below OTT it is possible to say that we are. The first parameter in the OTT indicator set by the two parameters is the period/length. OTT will be much sensitive to trend movements if i
Weis Wave Double Side
Eduardo Da Costa Custodio Santos
MT5 için Weis Wave Bouble Yan Göstergesi, araç setinin bir parçasıdır (Wyckoff Academy Wave Market) MT5 için Weis Wave Bouble yan Göstergesi, David Weis tarafından oluşturulan halihazırda kurulmuş Weis Wave'e dayalı olarak oluşturulmuştur. Weis Wave Çift Taraflı göstergesi, piyasayı olduğu gibi dalgalar halinde okur 1900 yılında R. Wyckoff tarafından. Çaba x sonuç, neden ve sonuç ve arz ve talebi belirlemeye yardımcı olur. Diferansiyeli, sıfır ekseninin altında kullanılabilmesi ve daha da iyileş
Indicator Name : Fourier Transform Curve Indicator Description : The Fourier Transform Curve Indicator for MetaTrader 5 is a powerful tool that leverages Fourier analysis to depict curves directly on your price chart. It is designed to provide valuable insights into the underlying harmonic components of the price data. Parameters : Input Candle Count : This parameter allows you to specify the number of candles to include in the Fourier transformation calculation. A higher value will capture lon
WT Vwap Bands
Ricardo Almeida Branco
The WT Vwap Bands indicator is an indicator that combines price and volume, helping to show whether the price is within the "fair price", overbought or oversold. The indicator code was designed for performance and has already been tested in a real trading account. In addition to the visual inputs (color, thickness and line style), the user can define a% value that depends on the price. The default values work with the most distant band at 1% of the price and then dividing this distan
WAPV Weis Wave Chart Forex
Eduardo Da Costa Custodio Santos
MT5 için Weis Wave Chart Forex bir Fiyat ve Hacim göstergesidir. Fiyat ve Hacim okuması, Richard Demille Wyckoff tarafından oluşturulan üç yasaya dayalı olarak geniş çapta dağıtıldı: Arz ve Talep, Neden ve Etki ve Çabaya Karşı Sonuç. 1900'de R.Wyckoff, analizlerinde dalga grafiğini zaten kullanmıştı. Yıllar sonra, 1990 civarında, David Weis Otomatikleştirilmiş R. Wyckoff'un dalga grafiği ve bugün size David Weis'in dalga grafiğinin evrimini sunuyoruz. Varlıkta üretilen dalga ile ilgili Hacim mik
XM Channel MT5
Kaijun Wang
5 (1)
The market price usually falls between the borders of the channel  . If the price is out of range, it is a trading signal or trading opportunity. Basically, Fit Channel can be used to help determine overbought and oversold conditions in the market. When the market price is close to the upper limit, the market is considered overbought (sell zone). Conversely, when the market price is close to the bottom range, the market is considered oversold (buy zone). However, the research can be used
Santa Trend
Marco Aurelio Cestari
4.22 (9)
Santa Trend Indicator  is an efficient way to forecast and detect the trend in any market. Advantages Generates instant buy and sell signals. Provides an alternate exit strategy to your existing trading system. Never repaints, never backpaints, never recalculates. Works in all symbols and all timeframes. Perfect trend filter for any strategy or expert advisor. Fully compatible with Expert Advisor (EA) development. Does not lag.
FREE
Professional Scalping Tool on Deriv Attention! The indicator will be sold in limited quantities!!! The previous 5 copies were sold for $250 The remaining 4 copies will be sold for $350 The next price is $500 Description: This trading indicator is designed for professional traders focused on scalping. Designed with the market in mind, it provides highly accurate spike trading signals. It works on the M1 timeframe and supports the following symbols: Boom 300 Index, Boom 500 Index, Boom 1000 I
Keltner Channels (ou   Canais de Keltner ) é mais um indicador de   volatilidade   utilizado pela   análise técnica. Também chamado de   envelope , esse canal foi criado por Chester Keltner para monitorar os seus investimentos no mercado futuro de café na década de 1960. Porém, com o passar do tempo, passou também a ser utilizado para outros ativos e, atualmente, é uma das ferramentas mais utilizadas pelos traders. Nesta versão customizada foram adicionados novas opções de método de média movel
GRat Clusters  is an indicator that shows various data in the form of clusters on a price chart: volume, delta, ratio of sales and purchases, etc. It allows you to visually see the market profile in real time and on history at a given depth. Capabilities 1.8 types of cluster data: volume, delta, purchases   and sales , volume and delta, imbalance between sales and purchases , volume profile, delta profile, buy and sell profile. 2. A cluster period can be either any available in MT5 timeframe or
Regression
MIKHAIL VINOGRADOV
The Regression indicator shows the direction of the trend. The graph shows up to 3 regression lines with different time periods. The straight line is built as the average inside the wave channel of the price movement (shown on one ScreenShot). In this case, you can disable any of the lines. Also, the indicator allows you to change the color for each line. It is interesting to calculate the relative angle in degrees. The angle display can also be turned off. Thanks to this indicator, you can
Valable ZigZag MT5
Sergey Ermolov
4.76 (17)
MT4 versiyonu  | Trend Monitor VZ göstergesi  |  Owl Smart Levels göstergesi   |   Owl Smart Levels stratejisi  |   FAQ Elliott'un dalga teorisi , finansal piyasalardaki süreçlerin, fiyat çizelgelerindeki dalgaların görsel modeline dayanan bir yorumudur. Valable ZigZag göstergesi , ticaret kararları için güvenebileceğiniz pazarın dalga yapısını görüntüler. Valable ZigZag göstergesi daha kararlıdır ve tüccarları yanıltarak klasik ZigZag göstergesi gibi yönünü sık sık değiştirmez. Bu, gösterge da
FREE
Novato
Juan Manuel Rojas Perez
5 (1)
Descubre el poderoso aliado que te guiará en el laberinto de los mercados financieros. Este indicador revolucionario te llevará de la incertidumbre a la claridad, permitiéndote identificar con precisión los puntos de inflexión del mercado. Mejora tus decisiones de entrada y salida, optimiza tus operaciones y ¡multiplica tus ganancias con confianza. ¡Para más información, te invitamos a unirte a nuestro canal de Telegram en https://t.me/Profit_Evolution  ¡Allí encontrarás contenido exclusivo, a
FREE
Novato alertas
Juan Manuel Rojas Perez
5 (2)
Descubre el poderoso aliado que te guiará en el laberinto de los mercados financieros. Este indicador revolucionario te llevará de la incertidumbre a la claridad, permitiéndote identificar con precisión los puntos de inflexión del mercado. Mejora tus decisiones de entrada y salida, optimiza tus operaciones y ¡multiplica tus ganancias con confianza. Ahora con alertas en tu pc o móvil ¡Para más información, te invitamos a unirte a nuestro canal de Telegram en   https://t.me/Profit_Evolution  ¡
FREE
To download MT4 version please click here . - This is the exact conversion from TradingView: "Linear Regression Candles" By "ugurvu". - The overall look of the indicator is like Heiken Ashi. - It can be used as a trend confirmation indicator to detect the right trend direction. - This indicator lets you read the buffers for Candles' OHLC. - This is a non-repaint and light processing load indicator - You can message in private chat for further changes you need. Thanks
Contact me for instruction, any questions! Introduction The Elliott Wave in technical analysis describes price movements in the financial market that are related to changes in trader sentiment and psychology. The 5 W Pattern (Known as 3 Drives) is an Elliott Wave pattern that is formed by 5 consecutive symmetrical moves up or down. In its bullish form, the market is making 5 drives to a bottom before an uptrend forms. In a bearish 5-drive, it is peaking before the bears take over.  5W Pattern S
Displays trends in current chart. You can display trends of multiple timeframes in one chart by inserting this indicator as often as you want. Key features: displays trend line by finding highs and lows counts number of high/low of current trend in different color (long/short) allows you to display multiple timeframe trends in one chart Settings: Indicator Name: if you want to show M5 and H1 on one chart add TITrend twice to your current chart and rename M5 to "TITrendM5" and H1 to "TITrendH1" C
Weis Wave Double Side Alert
Eduardo Da Costa Custodio Santos
MT5 için Weis Wave Bouble Yan Göstergesi, araç setinin bir parçasıdır (Wyckoff Academy Wave Market) MT5 için Weis Wave Bouble yan Göstergesi, David Weis tarafından oluşturulan halihazırda kurulmuş Weis Wave'e dayalı olarak oluşturulmuştur. Weis Wave Çift Taraflı göstergesi, R. Wyckoff'un 1900'de yaptığı gibi piyasayı dalgalar halinde okur. Çaba x sonuç, neden ve sonuç ve arz ve talebi belirlemeye yardımcı olur. Diferansiyeli, sıfır ekseninin altında kullanılabilmesi ve şunu gösteren bir koparma
Box Weis Wave
Thalles Nascimento De Carvalho
5 (1)
Eğer aktif bir trader iseniz ve finansal piyasaların hareketlerini etkili bir şekilde yorumlamak için bir yol arıyorsanız, Weis Wave Box'u keşfetmekten hoşlanacaksınız. Bu inanılmaz gösterge, hacim dalgalarının net ve doğru bir görsel analizini, buna karşılık gelen dönüş noktalarının çizimini sunmak için tasarlanmıştır. Beş özelleştirilebilir dönüş şekli ve diğer benzersiz özellikleriyle Weis Wave Box, deneyimli ve yeni başlayan traderlar için vazgeçilmez bir araç olarak öne çıkıyor. Weis Wav
FibExtender
Syed Oarasul Islam
This Indicator draws Fibonacci Extension levels in two different ways. You can select whether to draw Fibonacci Extension levels based on your favourite ZigZag settings or you can let the indicator to draw Fibonacci Extension  level based on given number of Bars or Candles.  You can also set Mobile and Email notification for your favourite Extension  levels individually. With this indicator you will not have to feel lonely as the it can generate Voice alerts, which will keep you focused on your
Scanner and Dashboard for Money Flow Index MT5 The Money Flow Index (MFI) is a technical oscillator that uses price and volume data for identifying overbought or oversold signals in an asset. It can also be used to spot divergences which warn of a trend change in price. The oscillator moves between 0 and 100. Advantages of the Scanner: - Full Alert Options. - Multi Timefrare  - Works for all instruments including Currencies, Indices, Commodities, Cryptocurrencies and Stocks. - Fully customisab
Price Channel Premium
Ignacio Agustin Mene Franco
PriceChannel! It is an indicator programmed to capture floor entries and ceiling sales! gives multiple inputs according to the temporality that you use it works for support and resistance too! It works in any temporality, works for forex currency markets ! for the pairs of synthetic indices ! Ideal for volatility and jumps! It also works for crash and boom! Good Profit, World Investor.
Contact me for instruction, any questions! Introduction The breakout and retest strategy is traded support and resistance levels. it involves price breaking through a previous level.  The break and retest strategy is designed to help traders do two main things, the first is to avoid false breakouts. Many false breakouts start with a candlestick that breaks out of a level but ends with an immediate candlestick that brings the price back into the level. The second thing that the breakout and rete
Magic EA MT5
Kyra Nickaline Watson-gordon
Magic EA is an Expert Advisor based on Scalping, Elliot Waves and with filters such as RSI, Stochastic and 3 other strategies managed and decided with the robot smartly. Large number of inputs and settings are tested and optimized and embedded in the program thus inputs are limited and very simple. Using EA doesn't need any professional information or Forex Trading Knowledge. EA can trade on all symbols and all time frames, using special and unique strategies developed by the author. The EA
Percent Levels
Cinthia Regina De Moraes
Indicador tipo 2mv frequência mostra os níveis percentuais no mercado financeiro que tendem a ser zonas realmente importantes para os traders. Observem que o preço segue um fluxo e uma frequência que se enquadram em canais percentuais de movimento,  tradicionalmente traçados por níveis Fibonacci. O indicador LevelsPercent traça linhas em pontos específicos de percentual configurados pelo usuário e "pode" anteceder possíveis níveis de SUPORTE e RESISTÊNCIA. A leitura do mercado e a identificação
Exclusive FOREX account HEDGE FuzzyLogicTrendEA is based on fuzzy logic strategy based on  analysis 5 indicators and filters. When the EA analysis all this indicators, it decides, based on its fuzzy strategy, which trade will be better: sell or buy. As additional functions, it´s possible defines spread maximum, stop loss and others. Recomm. Symbol: EURUSD, AUDUSD, GBPUSD, NZDUSD, USDCAD, AUDCAD, EURCAD e USDJPY Recomm. timeframe: H1. Backtest were done on EURUSD, H1, 01/07/2023 - 26/0
Bu ürünün alıcıları ayrıca şunları da satın alıyor
Öncelikle belirtmek gerekir ki bu Ticaret Göstergesi Yeniden Çizim Yapmaz, Gecikmez ve Gecikme Göstermez, bu da hem manuel hem de robot ticareti için ideal hale getirir. Kullanıcı kılavuzu: ayarlar, girişler ve strateji. Atom Analisti, Piyasada Daha İyi Bir Avantaj Bulmak İçin Fiyatın Gücünü ve Momentumunu Kullanan PA Fiyat Hareketi Göstergesidir. Gürültüleri ve Yanlış Sinyalleri Kaldırmaya ve Ticaret Potansiyelini Artırmaya Yardımcı Olan Gelişmiş Filtrelerle Donatılmıştır. Birden fazla katmanl
Öncelikle, bu Ticaret Sistemi'nin Non-Repainting, Non-Redrawing ve Non-Lagging Göstergesi olduğunu vurgulamak önemlidir, bu da hem manuel hem de robot ticareti için ideal hale getirir. Online kurs, kılavuz ve ön ayarları indir. "Smart Trend Trading System MT5", yeni ve deneyimli tüccarlar için özelleştirilmiş kapsamlı bir ticaret çözümüdür. 10'dan fazla premium göstergeyi birleştiriyor ve 7'den fazla sağlam ticaret stratejisi sunuyor, bu da çeşitli piyasa koşulları için esnek bir seçim yapar. Tr
Reversal First Impulse levels (RFI)      INSTRUCTIONS        RUS       -       ENG              R ecommended to use with an indicator   -   TREND PRO -  Version MT4                 A key element in trading is zones or levels from which decisions to buy or sell a trading instrument are made. Despite attempts by major players to conceal their presence in the market, they inevitably leave traces. Our task was to learn how to identify these traces and interpret them correctly. Main functions:: Di
FX Volume MT5
Daniel Stein
4.94 (17)
Sabah Brifingimiz aracılığıyla ayrıntılar ve ekran görüntüleri ile günlük piyasa güncellemenizi alın burada mql5 ve on Telegram ! FX Volume, bir brokerin bakış açısından piyasa duyarlılığı hakkında GERÇEK bir fikir veren İLK ve TEK hacim göstergesidir. COT raporlarından çok daha hızlı bir şekilde, brokerlar gibi kurumsal piyasa katılımcılarının Forex piyasasında nasıl konumlandıklarına dair harika bilgiler sağlar. Bu bilgileri doğrudan grafiğinizde görmek, ticaretiniz için gerçek oyun değiştir
Quantum Trend Sniper
Bogdan Ion Puscasu
5 (41)
Tanıtım       Kuantum Trend Keskin Nişancı Göstergesi   , trend tersine dönmeleri belirleme ve ticaret yapma şeklinizi değiştiren çığır açan MQL5 Göstergesi! 13 yılı aşkın ticaret tecrübesine sahip deneyimli tüccarlardan oluşan bir ekip tarafından geliştirilmiştir.       Kuantum Trend Keskin Nişancı Göstergesi       trend dönüşlerini son derece yüksek doğrulukla belirlemenin yenilikçi yolu ile ticaret yolculuğunuzu yeni zirvelere taşımak için tasarlanmıştır. ***Kuantum Trend Keskin Nişancı Gö
TPSproTREND PrO MT5
Roman Podpora
4.86 (7)
TPSpro TRENDPRO  - is a trend indicator that automatically analyzes the market and provides information about the trend and each of its changes, as well as giving signals for entering trades without redrawing! The indicator uses each candle, analyzing them separately. referring to different impulses - up or down impulse. Exact entry points into transactions for currencies, crypto, metals, stocks, indices!  -  Version MT4               DETAILED DESCRIPTION               R ecommended to use with
IVISTscalp5
Vadym Zhukovskyi
5 (3)
We present you the iVISTscalp5 indicator, which is not only unique, but also effective in the analysis of trading operations. This indicator is based on time data and is the result of many years of experience and deep analysis of financial markets. The iVISTscalp5 indicator is an excellent assistant for manual trading. Convenience, simplicity and visualization. All the most difficult is hidden inside. We have simplified the settings and use of the iVISTscalp5 indicator as much as possible. The i
RelicusRoad Pro MT5
Relicus LLC
4.82 (22)
Şimdi 147 $ (birkaç güncellemeden sonra 499 $ 'a yükseliyor) - Sınırsız Hesaplar (PC'ler veya Mac'ler) RelicusRoad Kullanım Kılavuzu + Eğitim Videoları + Özel Discord Grubuna Erişim + VIP Durumu PİYASAYA BAKMAK İÇİN YENİ BİR YOL RelicusRoad, forex, vadeli işlemler, kripto para birimleri, hisse senetleri ve endeksler için dünyanın en güçlü ticaret göstergesidir ve yatırımcılara kârlı kalmaları için ihtiyaç duydukları tüm bilgileri ve araçları sağlar. Başlangıç ​​seviyesinden ileri seviyey
This is arguably the most complete harmonic price formation auto-recognition indicator you can find for the MetaTrader Platform. It detects 19 different patterns, takes fibonacci projections as seriously as you do, displays the Potential Reversal Zone (PRZ) and finds suitable stop-loss and take-profit levels. [ Installation Guide | Update Guide | Troubleshooting | FAQ | All Products ] It detects 19 different harmonic price formations It plots primary, derived and complementary Fibonacci p
FX Power MT5 NG
Daniel Stein
5 (5)
Sabah Brifingimiz burada mql5 ve on Telegram! FX Power MT5 NG , uzun zamandır çok popüler olan döviz gücü ölçerimiz FX Power'ın yeni neslidir. Peki bu yeni nesil güç ölçer ne sunuyor? Orijinal FX Power hakkında sevdiğiniz her şey PLUS GOLD/XAU güç analizi Daha da hassas hesaplama sonuçları Ayrı ayrı yapılandırılabilir analiz dönemleri Daha da iyi performans için özelleştirilebilir hesaplama limiti Özel çokluDaha fazlasını görmek isteyenler için örnek ayarlar Her grafikte en sevdiğiniz renkler i
Bill Williams Advanced
Siarhei Vashchylka
5 (5)
Bill Williams Advanced is designed for automatic chart analysis using Bill Williams' "Profitunity" system. The indicator analyzes four timeframes at once. Manual (Be sure to read before purchasing) Advantages 1. Automatically analyzes the chart using the "Profitunity" system of Bill Williams. The found signals are placed in a table in the corner of the screen. 2. Equipped with a trend filter based on the Alligator indicator. Most of the system signals are recommended to be used only accordi
Matrix Arrow Indicator MT5
Juvenille Emperor Limited
5 (14)
Matrix Arrow Indicator MT5 ,   forex ,   emtialar ,   kripto   para birimleri ,   endeksler ,   hisse senetleri   gibi tüm sembollerde/araçlarda kullanılabilen   %100 yeniden boyamayan   çoklu zaman çerçevesi göstergesini izleyen benzersiz bir 10'u 1 arada trenddir.  Matrix Arrow Indicator MT5 , mevcut eğilimi erken aşamalarında belirleyecek ve aşağıdakiler gibi 10'a kadar standart göstergeden bilgi ve veri toplayacaktır: Ortalama Yönlü Hareket Endeksi (ADX) Emtia Kanal Endeksi (CCI) Klasik Hei
3 Indicators in 1 indicator Strategy based on price action Made specifically for the best forex currency pairs Can be used in the best time frame of the market at a very reasonable price This indicator is basically 3 different indicatos . But we have combined these 3 indicators in 1 indicator so that you can use 3 indicators at the lowest price. All three strategies are based on price action. But based on different trends. Long term, medium term and short term Attributes : No repaintin
Quantum Heiken Ashi PRO MT5
Bogdan Ion Puscasu
4.5 (8)
Quantum Heiken Ashi PRO ile   tanışın Pazar eğilimleri hakkında net bilgiler sağlamak üzere tasarlanan Heiken Ashi mumları, gürültüyü filtreleme ve yanlış sinyalleri ortadan kaldırma yetenekleriyle ünlüdür. Kafa karıştırıcı fiyat dalgalanmalarına veda edin ve daha sorunsuz, daha güvenilir bir grafik sunumuna merhaba deyin. Quantum Heiken Ashi PRO'yu gerçekten benzersiz kılan şey, geleneksel şamdan verilerini okunması kolay renkli çubuklara dönüştüren yenilikçi formülüdür. Kırmızı ve yeşil çubukl
Tanıtım       Quantum Breakout PRO   , Breakout Bölgeleri ile ticaret yapma şeklinizi değiştiren çığır açan MQL5 Göstergesi! 13 yılı aşkın ticaret tecrübesine sahip deneyimli tüccarlardan oluşan bir ekip tarafından geliştirilmiştir.       Kuantum Breakout PRO       yenilikçi ve dinamik koparma bölgesi stratejisiyle ticaret yolculuğunuzu yeni zirvelere taşımak için tasarlanmıştır. Kuantum Breakout Göstergesi, size 5 kar hedefi bölgesi ile kırılma bölgelerinde sinyal okları ve kırılma kutusuna
"Piranha" - an autonomous trading system that determines overbought and oversold levels on the chart. Red and blue zones represent overbought and oversold levels respectively. Entry points are marked with arrows: a downward arrow in the red zone for "sell" and an upward arrow in the blue zone for "buy". The Take profit level is indicated by the green moving average. Key features: Adjusting the Take profit level as the green moving average changes position. Averaging ability when a new market e
XQ Indicator MetaTrader 5
Marzena Maria Szmit
5 (1)
Step into the realm of Forex trading with confidence and precision using XQ, a cutting-edge Forex indicator designed to elevate your trading game to unprecedented heights. Whether you're a seasoned trader or just stepping into the world of currency exchange, XQ Forex Indicator empowers you with the insights and signals needed to make informed trading decisions. The signal conditions are a combination of three indicators, and XQ Forex Indicator only display  medium and long-term trends . The ind
Advanced Supply Demand MT5
Bernhard Schweigert
4.53 (15)
Herhangi bir Acemi veya Uzman Tüccar için En İyi Çözüm! Bu gösterge benzersiz, yüksek kaliteli ve uygun fiyatlı bir ticaret aracıdır çünkü bir dizi tescilli özelliği ve yeni bir formülü bir araya getirdik. Bu güncelleme ile çift zaman dilimi dilimlerini gösterebileceksiniz. Yalnızca daha yüksek bir TF gösteremeyeceksiniz, aynı zamanda TF grafiğini ve ARTIK daha yüksek TF'yi de gösterebileceksiniz: YUVARLAK BÖLGELERİ GÖSTERMEK. Tüm Arz Talebi tüccarları buna bayılacak. :) Önemli Bilgiler Açıkland
IX Power MT5
Daniel Stein
5 (3)
IX Power   nihayet FX Power'ın rakipsiz hassasiyetini Forex dışı sembollere getiriyor. En sevdiğiniz endeksler, hisse senetleri, emtialar, ETF'ler ve hatta kripto para birimlerindeki kısa, orta ve uzun vadeli eğilimlerin yoğunluğunu doğru bir şekilde belirler. Terminalinizin sunduğu   her şeyi analiz   edebilirsiniz. Deneyin ve işlem yaparken   zamanlamanızın   nasıl   önemli ölçüde iyileştiğini   deneyimleyin. IX Power Temel Özellikler 100 hassas, yeniden boyanmayan hesaplama sonuçları -
Introducing the South African Sniper indicator created by a small group of traders with a few years trading trading the financial market profitably . This is a plug and play indicator that provides you with  BUY and SELL (SNIPER ENTRY) signals with TARGET and trail stops. The indicator Works with all MT5 trading instruments. The indicator uses previous  chart data as receipt to speculate on future market moves.  "The South African Sniper indicator community are very happy with the indicator an
TPA True Price Action indicator reveals the true price action of the market makers through 100% non-repainting signals strictly at the close of a candle! TPA shows entries and re-entries, every time the bulls are definitely stronger than the bears and vice versa. Not to confuse with red/green candles. The shift of power gets confirmed at the earliest stage and is ONE exit strategy of several. There are available now two free parts of the TPA User Guide for our customers. The first "The Basics"
The Price Action Finder Multi indicator is an indicator of entry points that searches for and displays Price Action system patterns on dozens of trading instruments and on all standard time frames: (m1, m5, m15, m30, H1, H4, D1, Wk, Mn). The indicator places the found patterns in a table at the bottom of the screen. By clicking on the pattern names in the table, you can move to the chart where this pattern is located. Manual (Be sure to read before purchasing) | Version for MT4 Advantages 1. Pa
Fractal Advanced MT5
Siarhei Vashchylka
5 (3)
Fractal Advanced - displays Fractal and Alligator indicators on the price chart. Has wide options for settings and customization. It is also equipped with alerts and a hotkey system. Manual (Be sure to read before purchasing) | Version for MT4 Advantages 1. The indicator does not fill the entire chart with fractals, but allows you to display only relevant signals. 2. The number of fractals is adjusted by scrolling the mouse while holding down the Shift key. 3. Instantly show/hide the Alligator
Was: $249  Now: $99   Market Profile defines a number of day types that can help the trader to determine market behaviour. A key feature is the Value Area, representing the range of price action where 70% of trading took place. Understanding the Value Area can give traders valuable insight into market direction and establish the higher odds trade. It is an excellent addition to any system you may be using. Inspired by Jim Dalton’s book “Mind Over Markets”, this indicator is designed to suit the
Owl Smart Levels MT5
Sergey Ermolov
4.43 (37)
MT4 versiyonu  |  FAQ Owl Smart Levels Indicator , Bill Williams'ın gelişmiş fraktalları , piyasanın doğru dalga yapısını oluşturan Valable ZigZag ve kesin giriş seviyelerini gösteren Fibonacci seviyeleri gibi popüler piyasa analiz araçlarını içeren tek gösterge içinde eksiksiz bir ticaret sistemidir. pazara ve kar elde edilecek yerlere. Stratejinin ayrıntılı açıklaması Gösterge ile çalışma talimatı Baykuş Yardımcısı ticaretinde Danışman Yardımcısı Kullanıcıların özel sohbeti -> Satın aldıktan
"The Squeeze indicator attempts to identify periods of consolidation in a market. In general the market is either in a period of quiet consolidation or vertical price discovery. By identifying these calm periods, we have a better opportunity of getting into trades with the potential for larger moves. Once a market enters into a "squeeze," we watch the overall market momentum to help forecast the market direction and await a release of market energy." The Modified TTM Squeeze Indicator is a modi
Golden Spikes Detector
Batsirayi L Marango
5 (1)
Golden Spikes Detector This indicator is based on an advanced strategy primarily for trading spikes on Boom and Crash Indices. Complex algorithms were implemented to detect high probability entries only. It alerts on potential Buy and Sell entries. To trade spikes on the Deriv or Binary broker, only take Buy Boom and Sell Cash alerts. It was optimised to be loaded on 5-minute timeframe although multiple timeframe analysis is done in the background. Features ·             Desktop pop up and sound
Blahtech Supply Demand MT5
Blahtech Limited
4.57 (14)
Was: $299  Now: $99   Supply Demand uses previous price action to identify potential imbalances between buyers and sellers. The key is to identify the better odds zones, not just the untouched ones. Blahtech Supply Demand indicator delivers functionality previously unavailable on any trading platform. This 4-in-1 indicator not only highlights the higher probability zones using a multi-criteria strength engine, but also combines it with multi-timeframe trend analysis, previously confirmed swings
Top indicator for MT5   providing accurate signals to enter a trade without repainting! It can be applied to any financial assets:   forex, cryptocurrencies, metals, stocks, indices .  Watch  the video  (6:22) with an example of processing only one signal that paid off the indicator! MT4 version is here It will provide pretty accurate trading signals and tell you when it's best to open a trade and close it. Most traders improve their trading results during the first trading week with the help of
Gartley Hunter Multi
Siarhei Vashchylka
5 (6)
Gartley Hunter Multi - An indicator for searching for harmonic patterns simultaneously on dozens of trading instruments and on all possible timeframes. Manual (Be sure to read before purchasing) | Version for MT4 Advantages 1. Patterns: Gartley, Butterfly, Shark, Crab. Bat, Alternate Bat, Deep Crab, Cypher 2. Simultaneous search for patterns on dozens of trading instruments and on all possible timeframes 3. Search for patterns of all possible sizes. From the smallest to the largest 4. A
Yazarın diğer ürünleri
Prop Master   Uzman Danışmanı klasik stratejiye göre çalışır ve   Prop   firması   tarafından müşterileri için belirlenen tüm kuralları takip eder. Uzman Danışman, hem Prop firmalarının finanse edilen hesaplarında hem de kendi hesaplarınızda alınıp satılabilir. Ticaret hesabı türü konusunda herhangi bir kısıtlama yoktur. Prop Master canlı sinyaline göz atın:   https://www.mql5.com/tr/signals/2216370 Uzman Danışman nasıl test edilir? Expert Advisor'ın doğru saat diliminde çalışması önemlidir, bu
Ayarlar  |  MT4 versiyonu  |  Universal Box işlem seansı göstergesi   |  FAQ Universal Breakout , klasik fiyat aralığı arıza stratejisine dayanan bir ticaret danışmanıdır. Bu, fiyatın zaman aralığına göre belirlenen fiyat koridorundan çıkışını ima eden herhangi bir stratejiye göre ayarlanabilir. Örneğin: Asya, Avrupa veya Amerikan ticaret oturumlarının uç noktalarında arıza, gündüz uç noktalarında arıza, hatta Pazartesi gününün ilk H4 mumunda arıza. Telegram sohbeti: @ it_trader_chat Yeni Uzman
FREE
Owl Smart Levels MT5
Sergey Ermolov
4.43 (37)
MT4 versiyonu  |  FAQ Owl Smart Levels Indicator , Bill Williams'ın gelişmiş fraktalları , piyasanın doğru dalga yapısını oluşturan Valable ZigZag ve kesin giriş seviyelerini gösteren Fibonacci seviyeleri gibi popüler piyasa analiz araçlarını içeren tek gösterge içinde eksiksiz bir ticaret sistemidir. pazara ve kar elde edilecek yerlere. Stratejinin ayrıntılı açıklaması Gösterge ile çalışma talimatı Baykuş Yardımcısı ticaretinde Danışman Yardımcısı Kullanıcıların özel sohbeti -> Satın aldıktan
ATR Zone
Sergey Ermolov
ATR is an important indicator for any financial market. The abbreviation ATR stands for Average True Range. This indicator is a tool to determine the volatility of the market, this is its direct purpose. ATR shows the average price movement for the selected period of time. The initial price of the indicator is 63$. The price will increase every 10 sales up to 179$ The original ATR indicator is present in many trading programs. The ATR indicator is not very informative, so I modified its data and
2015'ten geriye dönük testler |  MT4 versiyonu  |  FAQ MiloBot PRO , 2 yıldan uzun   süredir geliştirilmiş , test edilmiş ve optimize edilmiş bir yazarın stratejisine dayanan bir Forex danışmanıdır. Stratejinin güvenilirliğinin bir göstergesi,   geliştiricilerin toplam 100.000 dolardan   fazla depozito içeren gerçek hesaplarını düşünebilir. MiloBot Pro'nun   gelişmiş algoritmik stratejisi , her ay istikrarlı bir şekilde kar   elde etmenizi sağla r. Ve yazarın göstergeleri, EA'nın piyasanın ters
Valable ZigZag MT5
Sergey Ermolov
4.76 (17)
MT4 versiyonu  | Trend Monitor VZ göstergesi  |  Owl Smart Levels göstergesi   |   Owl Smart Levels stratejisi  |   FAQ Elliott'un dalga teorisi , finansal piyasalardaki süreçlerin, fiyat çizelgelerindeki dalgaların görsel modeline dayanan bir yorumudur. Valable ZigZag göstergesi , ticaret kararları için güvenebileceğiniz pazarın dalga yapısını görüntüler. Valable ZigZag göstergesi daha kararlıdır ve tüccarları yanıltarak klasik ZigZag göstergesi gibi yönünü sık sık değiştirmez. Bu, gösterge da
FREE
Grid Hlevel MT5
Sergey Ermolov
4.57 (28)
MT4 versiyonu  |  Valable ZigZag göstergesi   |   FAQ Grid HLevel   Expert Advisor, Forex piyasasında her ay istikrarlı bir kar elde etmek isteyen tüccarlar için mükemmeldir. Expert Advisor, ortalama alma stratejisine göre çalışır ve onu doğru kullanmanızı öneririm.   Bunu "doğru" kullanmak, piyasanın tersine dönme noktasında ortalama ile alım satım açmak ve yalnızca küresel bir trend yönünde ticaret yapmak anlamına gelir. Ana eğilimin yönüne gelince, bunu H4 zaman dilimindeki Valable ZigZag gö
FREE
Full Fractals MT5
Sergey Ermolov
4.71 (14)
MT4 version  |   Owl Smart Levels Indicator  |  Owl Smart Levels stratejisi  |   FAQ Fractals Indicator , yazarın   Bill Williams   ticaret stratejisinin unsurlarından biridir. Fiyat tablosunda fiyat dönüş noktalarını ve dolayısıyla destek ve direnç seviyelerini aramak için kullanılır. Full   Fractals Indicator , neredeyse tüm ticaret terminallerinin araç setinde bulunan geliştirilmiş bir Fractals. Tek farkı, bir fraktal oluşturmak için ana mumun solunda 5 ve sağında 2 mum kullanmamızdır (bkz.
FREE
Full Fractals
Sergey Ermolov
4.88 (17)
MT5 version  |  Owl Smart Levels Indicator  |  Owl Smart Levels stratejisi  |  FAQ Fractals Indicator , yazarın Bill Williams ticaret stratejisinin unsurlarından biridir. Fiyat tablosunda fiyat dönüş noktalarını ve dolayısıyla destek ve direnç seviyelerini aramak için kullanılır. Full Fractals Indicator , neredeyse tüm ticaret terminallerinin araç setinde bulunan geliştirilmiş bir Fractals. Tek farkı, bir fraktal oluşturmak için ana mumun solunda 5 ve sağında 2 mum kullanmamızdır (bkz. Şekil 1)
FREE
Universal Breakout
Sergey Ermolov
4.55 (38)
Ayarlar  |  MT5 versiyonu  |  Universal Box işlem seansı göstergesi |  FAQ Universal Breakout , klasik fiyat aralığı arıza stratejisine dayanan bir ticaret danışmanıdır. Bu, fiyatın zaman aralığına göre belirlenen fiyat koridorundan çıkışını ima eden herhangi bir stratejiye göre ayarlanabilir.   Örneğin: Asya, Avrupa veya Amerikan ticaret oturumlarının uç noktalarında arıza, gündüz uç noktalarında arıza, hatta Pazartesi gününün ilk H4 mumunda arıza. Telegram sohbeti: @it_trader_chat Yeni Uzman
FREE
Universal Box MT5
Sergey Ermolov
4.71 (7)
MT4 versiyonu   |  FAQ  |  EA Universal Breakout   Universal Box , daha sonra bir fiyat aralığı kırılmasıyla işlem yapmak için kullanılabilecek   fiyat aralıklarını   grafikte çizer. Bu göstergeyi uygulayabileceğiniz birçok strateji vardır. Gösterge varsayılan olarak grafikte   Asya, Avrupa ve Amerika ticaret seansı   aralıklarını işaretleyecek şekilde ayarlanmıştır. Aralıklar, sınırları işlem seansının başlangıç ve bitiş zamanı ve o dönem için maksimum ve minimum fiyat seviyeleri olan dikdörtg
FREE
Shuttle Runner
Sergey Ermolov
4.29 (21)
La strategia swing è la base del consulente Shuttle Runner . La strategia è stata descritta nel lontano 2009 ed è stata attivamente utilizzata dai trader nel mercato Forex. Shuttle runner è una versione migliorata e migliorata di questa strategia. Telegram sohbeti: @it_trader_chat Yeni Uzman Danışman Prop Master   - bunu ticaret terminalinizde test edin https://www.mql5.com/tr/market/product/115375 L'essenza principale della strategia è la seguente: Il trading di questo consulente  è solo nel
FREE
MiloBot PRO
Sergey Ermolov
5 (3)
2015'ten geriye dönük testler |  MT5 versiyonu  |   FAQ MiloBot PRO , 2 yıldan uzun süredir geliştirilmiş , test edilmiş ve optimize edilmiş bir yazarın stratejisine dayanan bir Forex danışmanıdır. Stratejinin güvenilirliğinin bir göstergesi, geliştiricilerin toplam 100.000 dolardan fazla depozito içeren gerçek hesaplarını düşünebilir. MiloBot Pro'nun gelişmiş algoritmik stratejisi , her ay istikrarlı bir şekilde kar elde etmenizi sağla r. Ve yazarın göstergeleri, EA'nın piyasanın tersine çevri
Owl smart levels
Sergey Ermolov
4.63 (54)
MT5 versiyonu  |  FAQ Owl Smart Levels Indicator ,   Bill Williams'ın gelişmiş fraktalları , piyasanın doğru dalga yapısını oluşturan Valable ZigZag ve kesin giriş seviyelerini gösteren   Fibonacci seviyeleri   gibi popüler piyasa analiz araçlarını içeren tek gösterge içinde eksiksiz bir ticaret sistemidir. pazara ve kar elde edilecek yerlere. Stratejinin ayrıntılı açıklaması Gösterge ile çalışma talimatı Baykuş Yardımcısı ticaretinde Danışman Yardımcısı Kullanıcıların özel sohbeti -> Satın ald
Grid HLevel
Sergey Ermolov
4.48 (27)
MT5 versiyonu  |  Valable ZigZag göstergesi   |  FAQ Grid HLevel   Expert Advisor, Forex piyasasında her ay istikrarlı bir kar elde etmek isteyen tüccarlar için mükemmeldir. Expert Advisor, ortalama alma stratejisine göre çalışır ve onu doğru kullanmanızı öneririm. Bunu "doğru" kullanmak, piyasanın tersine dönme noktasında ortalama ile alım satım açmak ve yalnızca küresel bir trend yönünde ticaret yapmak anlamına gelir. Ana eğilimin yönüne gelince, bunu H4 zaman dilimindeki Valable ZigZag göste
FREE
Valable ZigZag
Sergey Ermolov
4.63 (8)
MT5 versiyonu  |  Trend Monitor VZ göstergesi  |  Owl Smart Levels göstergesi   |   Owl Smart Levels stratejisi  |   FAQ Elliott'un dalga teorisi , finansal piyasalardaki süreçlerin, fiyat çizelgelerindeki dalgaların görsel modeline dayanan bir yorumudur.   Valable ZigZag göstergesi , ticaret kararları için güvenebileceğiniz pazarın dalga yapısını görüntüler. Valable ZigZag göstergesi daha kararlıdır ve tüccarları yanıltarak klasik ZigZag göstergesi gibi yönünü sık sık değiştirmez. Bu, gösterge
FREE
Universal Box
Sergey Ermolov
5 (2)
MT5 versiyonu   |  FAQ  |  EA Universal Breakout   Universal Box , daha sonra bir fiyat aralığı kırılmasıyla işlem yapmak için kullanılabilecek fiyat aralıklarını grafikte çizer. Bu göstergeyi uygulayabileceğiniz birçok strateji vardır. Gösterge varsayılan olarak grafikte Asya, Avrupa ve Amerika ticaret seansı aralıklarını işaretleyecek şekilde ayarlanmıştır. Aralıklar, sınırları işlem seansının başlangıç ve bitiş zamanı ve o dönem için maksimum ve minimum fiyat seviyeleri olan dikdörtgenler ol
FREE
Molecule AI MT5
Sergey Ermolov
2.43 (7)
2010'dan beri V4 raporlar  |  MT4 versiyonu  |  FAQ !!! YENİ SÜRÜM V4 - 09/23/2023 !!!   Yeni ve daha kararlı bir algoritma eklendi (ayrıntılar için aşağıya bakın). TEST ETMEDEN ÖNCE DOĞRU ŞEKILDE KURUN Expert Advisor'ın doğru saat diliminde çalışması önemlidir, bu nedenle test etmeden önce GMT parametresini doğru şekilde ayarlamanız gerekir. GMT parametresi nasıl doğru ayarlanır? Ayar, piyasanın açık olduğu ve ticaret terminalinde tiklerin alındığı zamanda yapılmalıdır. Google'ı açın ve "Geçe
Molecule AI
Sergey Ermolov
3.88 (8)
2010'dan beri V4 raporlar |  MT5 versiyonu  |  FAQ !!! YENİ SÜRÜM V4 - 09/23/2023 !!! Yeni ve daha kararlı bir algoritma eklendi (ayrıntılar için aşağıya bakın). TEST ETMEDEN ÖNCE DOĞRU ŞEKILDE KURUN Expert Advisor'ın doğru saat diliminde çalışması önemlidir, bu nedenle test etmeden önce GMT parametresini doğru şekilde ayarlamanız gerekir. GMT parametresi nasıl doğru ayarlanır? Ayar, piyasanın açık olduğu ve ticaret terminalinde tiklerin alındığı zamanda yapılmalıdır. Google'ı açın ve "Geçerli
MT4 versiyonu  |   Valable ZigZag göstergesi   |  FAQ Elliott Dalga Teorisi , fiyat grafiklerindeki dalgaların görsel modeline dayanan, finans piyasalarındaki süreçlerin bir yorumudur. Bu teoriye göre, şu anda piyasada yukarı veya aşağı doğru hangi eğilimin hakim olduğunu tam olarak bilebiliriz.   Valable ZigZag göstergesi ,   piyasanın dalga yapısını   göstermenin yanı sıra mevcut zaman diliminde şu anda ana eğilimin yönünü gösterir. Size kolaylık sağlamak için Trend Monitor VZ göstergesi, işl
Safety
Sergey Ermolov
4.67 (3)
Sanırım herkes böyle bir para yönetimi kuralını «Kasa» olarak biliyor. Bilmeyenler için kasa, işlemdeki kazançlar ayak büyüklüğüyle eşitlendikten sonra pozisyonun yarısını kapatmayı varsayar. Böylece, fiyat açılıp dursa bile, artık para kaybetmeyeceksiniz, çünkü pozisyonun bir kısmı daha önce kapandığında tam olarak aynı miktarda kar elde edildi. Güvenlik Danışmanının yalnızca bir ayarı vardır – kapanış lotu. Onu 0 konumunda bırakarak, danışman anlaşmanın tam yarısını kapatacaktır. Danışman
FREE
Trend Monitor VZ
Sergey Ermolov
3.67 (3)
MT5 versiyonu  | Valable ZigZag göstergesi |  FAQ Elliott Dalga Teorisi , fiyat grafiklerindeki dalgaların görsel modeline dayanan, finans piyasalarındaki süreçlerin bir yorumudur. Bu teoriye göre, şu anda piyasada yukarı veya aşağı doğru hangi eğilimin hakim olduğunu tam olarak bilebiliriz. Valable ZigZag göstergesi , piyasanın dalga yapısını göstermenin yanı sıra mevcut zaman diliminde şu anda ana eğilimin yönünü gösterir. Size kolaylık sağlamak için Trend Monitor VZ göstergesi, işlem yaptığı
Filtrele:
İnceleme yok
İncelemeye yanıt