• Genel bakış
  • İncelemeler
  • Yorumlar
  • Yenilikler

Market Structure Hh Hl Lh Ll

Tanım:

"Piyasa Yapısı HH HL LH LL" göstergesi, finansal piyasalardaki fiyat dinamiklerini analiz etmek için güçlü ve aynı zamanda basit bir araçtır. Bu gösterge, yatırımcıların ve yatırımcıların trendlerdeki değişiklikleri tespit etmelerine ve fiyat zaman serilerindeki önemli noktaları tespit etmelerine yardımcı olur.

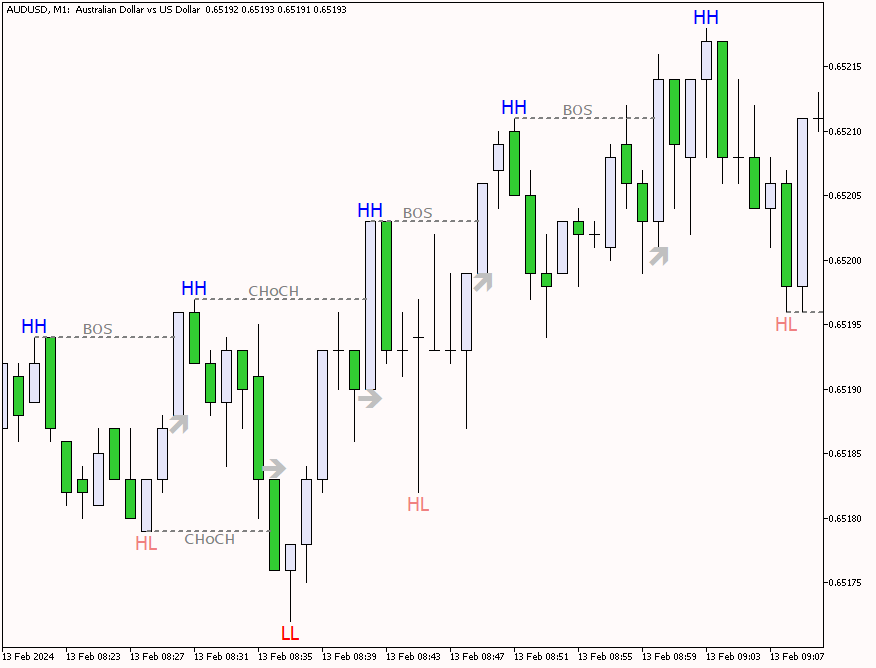
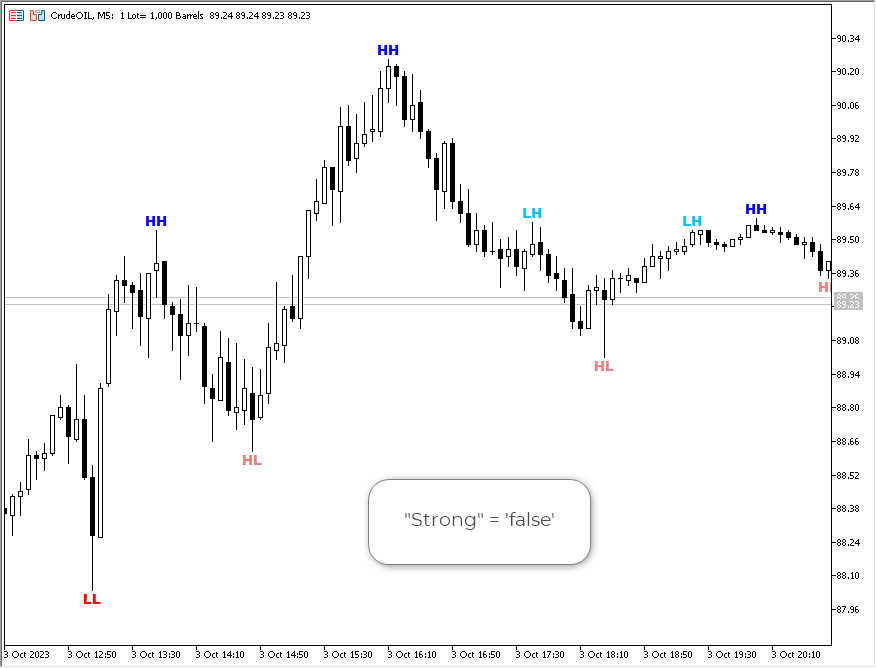
Göstergenin temel bileşenleri:

HH (Yüksek Yüksek): Fiyatın bir önceki yüksek tepenin üzerinde kapandığı tepe. HH güçlenen bir yükseliş trendine işaret ediyor.
HL (Yüksek Düşük): Fiyatın bir önceki düşük seviyenin üzerinde kapandığı minimum değer. HL yükseliş eğiliminin devam ettiğini doğruluyor.
LH (Alt Yüksek): Fiyatın bir önceki yüksek seviyenin altında kapandığı tepe. LH olası bir trend dönüşünün sinyalini veriyor.
LL (Alt Düşük): Fiyatın bir önceki düşük seviyenin altında kapandığı minimum seviye. LL düşüş trendinin başlangıcını doğruluyor.

Nasıl kullanılır:

"Piyasa Yapısı HH HL LH LL" göstergesi, yatırımcıların ve yatırımcıların piyasadaki mevcut eğilimi belirlemesine yardımcı olur. Bir yükseliş trendi bir HH ve HL dizisi ile karakterize edilir ve bir düşüş trendi bir LH ve LL dizisi ile karakterize edilir. Trend değiştiğinde bu, piyasada bir pozisyonun açılmasına veya kapatılmasına yönelik bir sinyal olabilir.

Kullanım örneği:

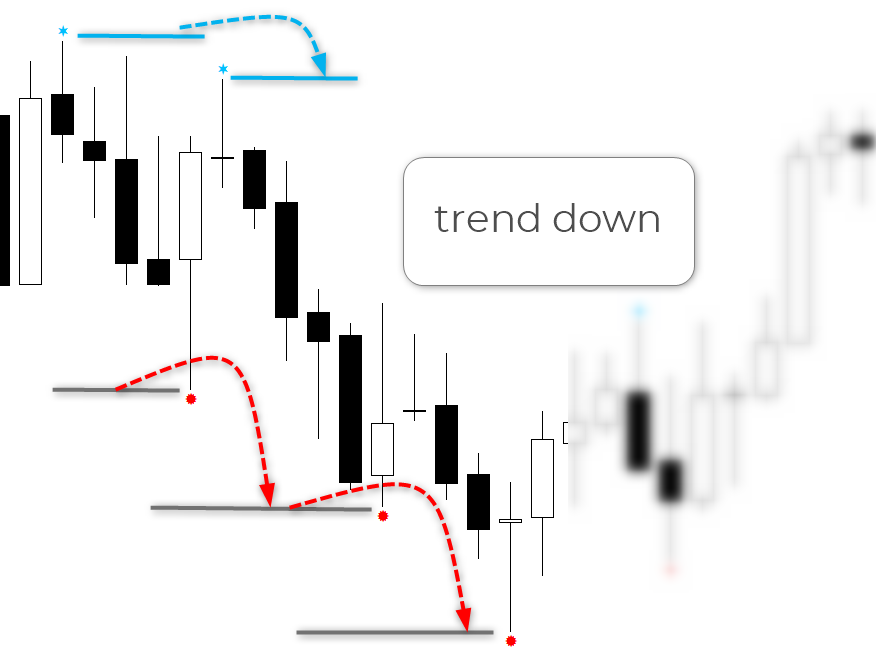
Diyelim ki bir hisse senedinde uzun bir pozisyonunuz var ve gösterge LH ve LL dizisini gösteriyor, bu da olası bir düşüş trendinin başlangıcını gösteriyor. Bu, bir pozisyonu kapatmak veya bir stop limiti belirlemek için bir sinyal olabilir.

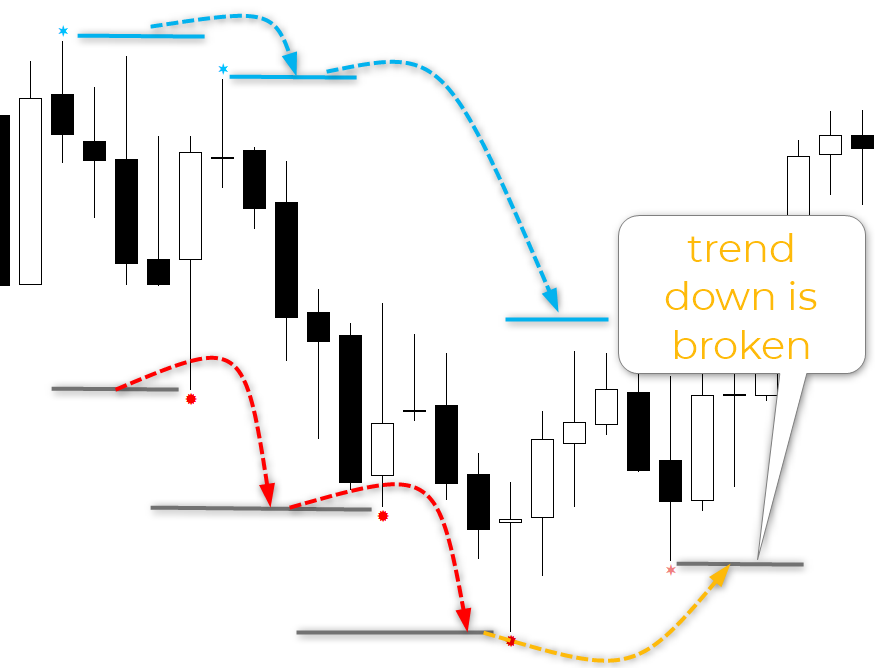
Aşağıdaki resimler düşüş eğiliminin bir örneğini ve bu eğilimin ne zaman kırıldığının bir örneğini göstermektedir.


Önerilen ürünler
VWAP Indicator
LUC JACOBUS A VERHEECKE
4.23 (22)
Volume Weighted Average Price (VWAP) The volume weighted average price (VWAP) is a   trading   benchmark   used by traders that gives the average price a security has traded at throughout the day, based on both volume and price. It is important because it provides traders with insight into both the trend and value of a security. This indicator VWAP V2 is free and is the manual version of the extended Easy VWAP indicator (30 Euro), where the date and time properties are automatically entered. Wit
FREE
The   Visual Volatility Clustering   indicator clusters the market based on volatility. The indicator does not redraw and gives accurate data, does not use closing prices. Uses the opening prices or the highs or lows of the previous completed bar. Therefore, all information will be clear and unambiguous. The essence of the indicator is to divide the price market into certain areas according to a similar type of volatility. This can be done in any way. In this example, the indicator is configure
YY Mono Waves MT5
Yuryi Yatsenko
4 (2)
The Mono Waves indicator is designed to display the wave behavior of the market on a chart. Its appearance is presented on slide 1.   This indicator uses the PPPC (Point-Percent Price Channel) indicator, which can be downloaded for free from the  Market .              When the market moves up, the upper border of the price channel is built on High candlestick prices (for more details, see the description of the PPPC indicator at the link given above). The higher the High prices rise
FREE
Stackable VWAP
Flavio Javier Jarabeck
3.33 (6)
Volume Weighted Average Price (VWAP) is a trading benchmark commonly used by Big Players that gives the average price a Symbol has traded throughout the day. It is based on both Volume and price. Additionally we put in this indicator the MVWAP (Moving Volume Weighted Average Price). For those who do not know the usage and the importance od this indicator I recommend a great article about this subject at Investopedia ( https://www.investopedia.com/articles/trading/11/trading-with-vwap-mvwap.asp
FREE
Swiss VWAPsimple
Terence Gronowski
5 (4)
Swiss VWAPsimple Motivation Did not find free VWAP that works, the one that I found craseh. So I created a VWAP which calculates values only for the actual day. So computer resouces are not over stressed. What is VWAP, how is it used?  VWAP stands for Volume Weighed Average Price, it calculates the running sum of tick volume and the runnung sum of price times tickvolume. The division of these sums result in a weighed price (Sum P*V/Sum V). The calculation starts normally at midnight. The value
FREE
The   Visual Volatility Clustering   indicator clusters the market based on volatility. The indicator does not redraw and gives accurate data, does not use closing prices. Uses the opening prices or the highs or lows of the previous completed bar. Therefore, all information will be clear and unambiguous. The essence of the indicator is to divide the price market into certain areas according to a similar type of volatility. This can be done in any way. In this example, the indicator is configure
Value Chart Candlesticks
Flavio Javier Jarabeck
4.67 (9)
The idea of a Value Chart indicator was presented in the very good book I read back in 2020 , " Dynamic Trading Indicators: Winning with Value Charts and Price Action Profile ", from the authors Mark Helweg and David Stendahl. The idea is simple and the result is pure genius: Present candlestick Price analysis in a detrended way! HOW TO READ THIS INDICATOR Look for Overbought and Oversold levels. Of course, you will need to test the settings a lot to find the "correct" one for your approach.
FREE
VWAP and MVWAP
Flavio Javier Jarabeck
4.17 (6)
Volume Weighted Average Price (VWAP) is a trading benchmark commonly used by Big Players that gives the average price a Symbol has traded throughout the day. It is based on both Volume and price. Additionally we put in this indicator the MVWAP (Moving Volume Weighted Average Price). For those who do not know the usage and the importance od this indicator I recommend a great article about this subject at Investopedia ( https://www.investopedia.com/articles/trading/11/trading-with-vwap-mvwap.asp )
FREE
The VWAP Level indicator is a technical analysis tool that calculates the weighted average price for the traded volumes of a specific asset. The VWAP provides traders and investors with the average price of an asset over a specific time frame. It is commonly used by investors to compare data on "passive" trading operations, such as pension funds and mutual funds, but also by traders who want to check if an asset has been bought or sold at a good market price. To calculate the VWAP level we
FREE
Activity Power
Zoltan Nemet
5 (4)
Multi time frame, multy currency special swing volume indicator with engulfing waves too. Simpler to use compare to Weis Wave. User don't need to adjust wave size. Just use of the basic or the upper time frames. As a multi time frame indikator user can do  very complex time frame analysyses. As well as a multy currency indicator one can make market sector-segment analysyses. Use with Wckoff principles.
FREE
MIDAS Super VWAP
Flavio Javier Jarabeck
4.29 (14)
Imagine VWAP, MVWAP and MIDAS in one place... Well, you found it! Now you can track the movement of Big Players in various ways, as they in general pursue the benchmarks related to this measuring, gauging if they had good execution or poor execution on their orders. Traders and analysts use the VWAP to eliminate the noise that occurs throughout the day, so they can measure what prices buyers and sellers are really trading. VWAP gives traders insight into how a stock trades for that day and deter
FREE
Máquina Trader Tendência Count on our trend tracker to carry out your operations on the Mini Index and the Mini Dollar!!! Operational Green is BUY and Pink is SELL!!! Enter the operation after closing the first color block!!! Developed and Tested on the 5 or 15 minute Chart for Mini Index and Mini Dollar!!! Can be used on any chart!!! Editable colors and period!!!
ZhiBiTMG is a collection of trends and martingale indicators for all market segments and all chart cycles. Many indicators on the market violate the trend but claim to be accurate, but is it really accurate? In fact, it is not accurate! Because the market must go with the trend. This ZhiBiTMG indicator gives the Martingale signal on the premise of the trend. This will be in line with market rules. Instructions for use: The red line is the downward trend line (Sell), a total of three lines; by de
VP hidden
Emr Aljnaby
5 (6)
The indicator works to convert normal volume into levels and determine financial liquidity control points. It is very similar in function to Fixed Volume Profile. But it is considered more accurate and easier to use than the one found on Trading View because it calculates the full trading volumes in each candle and in all the brokers present in MetaTrade, unlike what is found in Trading View, as it only measures the broker’s displayed prices. To follow us on social media platforms: tel
FREE
Tick Database — export of tick database from MT5 terminal to MT4. The utility provides access to the tick database in real time. This is necessary to generate synthetic charts in the MT4 terminal, which initially does not provide for loading a tick database. For example, you can organize permanent access to the tick database for the " Seconds Chart " utility, which create seconds charts in the MT4 terminal.
FREE
I recommend you to read the  product's blog  (manual) from start to end so that it is clear from the beginning what the indicator offers. This multi time frame and multi symbol supply and demand zone dashboard indicator sends alerts when the price has reached a supply/demand zone. It is also possible to use it to be alerted about regular double tops/bottoms instead of zones. It can be used with all time frames from M1 to MN. Maximum 9 time frames can be shown in the dashboard at the same time. 
This is a utility indicator that creates mini charts on left side of the chart you are looking at. It is very useful to watch many timeframes simultaneously, without having to change between multiple charts. Its configuration is very simple. You can have up to 4 mini charts opened. They automatically load the template of the "parent" chart. If you have any doubt please contact me. Enjoy! This is a free indicator, but it took hours to develop. If you want to pay me a coffee, I appreciate a lot
FREE
Donchian Pro
Paulo Henrique Faquineli Garcia
5 (2)
The Donchian Channel Channels are among the most popular tools of technical analysis, as they visually convey to the analyst the limits within which most price movement tends to occur. Channel users know that valuable information can be obtained at any time, whether prices are in the central region of a band or close to one of the border lines. One of the best known techniques to explore these concepts is Bollinger Bands. However, John Bollinger was not the only one to research the applicatio
FREE
A countdown timer for the  Volume bar chart generator  and  Tick chart generator  products, which are available for download from the MQL5 Market: Tick chart generator: https://www.mql5.com/en/market/product/29215 Volume bar chart generator: https://www.mql5.com/en/market/product/47197 The counter conveniently displays the number of ticks or transactions (depending on the chart) that need to pass for a new bar to start printing. The user can set the following indicator inputs. Volume type
FREE
Gösterge, mevcut fiyat yönünü ve piyasa oynaklığını belirlemenizi sağlar. Traders Dynamic Index'in bu sürümü, geçmiş verilerin yeniden çizilmesini ortadan kaldırdı, algoritma hesaplama hızı optimize edildi, daha hassas ayarlamalar için daha fazla harici parametreye ve genişletilmiş işlevselliklere sahiptir: ilk osilatör seçimi ve ortalamaların yumuşatma yöntemleri eklendi . parametreler: Mode Osc - tahmin osilatör seçimi Period Osc - kullanılan osilatörün hesaplama periyodu Price Osc - salınım h
VWAP Simple
Deibson Carvalho
4.03 (33)
The Volume Weighted Average Price is similar to a moving average, except volume is included to weight the average price over a period.    Volume-Weighted Average Price [VWAP] is a dynamic, weighted average designed to more accurately reflect  a security’s true average price over a given period . Mathematically, VWAP is the summation of money (i.e., Volume x Price) transacted divided by the total volume over any time horizon, typically from market open to market close. VWAP reflects the capital
FREE
Bar Color Trend
Germano Chagas
4.5 (10)
Combining the best of Price Action , Directional Movement , and Divergence/Convergence analysis, Candle Color Trend is a easy and reliable way to identify trend direction. The indicator automatically paints the candles according to the assumption that an uptrend is defined by prices that form a series of higher highs and higher lows. In contrast, a downtrend is defined by prices that form a series of lower highs and lower lows. Additionally, ADX Wilder indicator is used to measure trend weakness
FREE
A useful scanner/dashboard that shows the RSI values for multiple symbols and Time-frames. It can be easily hidden/displayed with a simple click on the scanner man top left of the dashboard. You can input upper and lower RSI values and the colours can be set to show when above/below these values. The default values are 70 and 30. There are also input colours for when the RSI is above or below 50 (but not exceeding the upper/lower levels Symbols and time-frames are input separated by commas.
Do you use volume in your reading of the market? Certainly many traders use it, and do not imagine operating without it. The Color Histogram Volume Set indicator allows the user to choose the value that he considers interesting to monitor. When you pass this you will have visual confirmation and if you want you will also have the audible alert that is given by the indicator. Of course, there are other ways to try to find a high volume, such as assessing whether the volume
Bollinger Bands B
Flavio Javier Jarabeck
5 (3)
John Bollinger created this indicator in 2010 as a way to read the original indicator (Bollinger Bands) in a more "technical" way, shown as an oscillator. The typical range of the Bollinger Bands %B is 0 - 0.5 - 1.0, where "0" represents the lower band, the "0.5" the middle band, and "1" the upper band. The line on the indicator represents the Closing prices. As simple as that. SETTINGS Bollinger Bands period of analysis Standard Deviation multiplier Shift Price type to be analyzed If you
FREE
FRB Trader - Our mission is to provide the best support to customers through conted and tools so that they can achieve the expected results FRB Support and Resistance - Indicator places lines on the chart to show Support and Resistance regions. - You can choose the timeframe you want to calculate, as well as the colors of the lines. - Algorithm calculates the points where the strengths of the asset are considered and are extremely important for decision making.
FREE
Trend Scanner mt5 GS
Vasiliy Strukov
4.93 (15)
Trend Tarayıcı, Çoklu Semboller ve Çoklu Zaman çerçevelerinden piyasa trendlerini tarar ve bunu grafikteki hareketli bir panelde görüntüler, analiz için Altın madde göstergesini kullanır Özellikler uyarıları ve e-postayı ve anında bildirimleri içerir. Tüccar, görüntüleme için kendi seçtiği birden fazla çifti seçebilir. Trend Tarayıcı, trendin yönünü görmek için harika bir araçtır ve trende göre yalnızca alım veya satım emirlerine izin vererek manuel alım satım veya EA alım satımı için kullanıla
Midas VWAP
Paulo Henrique Faquineli Garcia
4 (1)
Volume Weighted Average Price (VWAP) is a trading benchmark commonly used by Big Players that gives the average price a Symbol has traded throughout the day. It is based on both Volume and price. This indicator contains Daily VWAP and MIDAS' VWAP, which means you are able to anchor the beggining of MIDAS' calculations and, therefore you will be able to use this methodology to study price versus volume moves after anchor point. You will be able to anchor up to 3 HIGH MIDAS VWAP's and 3 LOW. Wis
FREE
The best time to trade Using this Indicator is when the time reach exactly hour,half,45 minutes,15 minutes and sometimes 5 minutes.. This indicators is helpful to those who trade boom and crash indecies.How to read this indicator first you'll see Blue allow and Red allow all these allows used to indicate or to detect the spike which will happen so the allow happens soon before the spike happen.This indicator works properly only in boom and crash trading thing which you have to consider when
Intervals
Alexandre Borela
5 (2)
Bu projeyi seviyorsanız, 5 yıldız incelemesi bırakın. instagram'da izleyin: borelatech Ticaret büyük hacimler, birden fazla enstrüman /karlara bakmamızı gerektirir Yeni fırsatlar bulmak, bu gösterge size belirli bir şekilde ayarlayarak yardımcı olacaktır Birden fazla sayı veya eki ile seviyeleri ve onları otomatik olarak günceller Fiyat değişiklikleri olarak, aksi takdirde tartışmalı bir görev. Örneğin, GBPUSD'de, göstergenin 4 örneği olabilir arsa için grafik: 100 barın uzunluğu ile her
FREE
Bu ürünün alıcıları ayrıca şunları da satın alıyor
Öncelikle belirtmek gerekir ki bu Ticaret Göstergesi Yeniden Çizim Yapmaz, Gecikmez ve Gecikme Göstermez, bu da hem manuel hem de robot ticareti için ideal hale getirir. Kullanıcı kılavuzu: ayarlar, girişler ve strateji. Atom Analisti, Piyasada Daha İyi Bir Avantaj Bulmak İçin Fiyatın Gücünü ve Momentumunu Kullanan PA Fiyat Hareketi Göstergesidir. Gürültüleri ve Yanlış Sinyalleri Kaldırmaya ve Ticaret Potansiyelini Artırmaya Yardımcı Olan Gelişmiş Filtrelerle Donatılmıştır. Birden fazla katmanl
Öncelikle, bu Ticaret Sistemi'nin Non-Repainting, Non-Redrawing ve Non-Lagging Göstergesi olduğunu vurgulamak önemlidir, bu da hem manuel hem de robot ticareti için ideal hale getirir. Online kurs, kılavuz ve ön ayarları indir. "Smart Trend Trading System MT5", yeni ve deneyimli tüccarlar için özelleştirilmiş kapsamlı bir ticaret çözümüdür. 10'dan fazla premium göstergeyi birleştiriyor ve 7'den fazla sağlam ticaret stratejisi sunuyor, bu da çeşitli piyasa koşulları için esnek bir seçim yapar. Tr
Gold Stuff mt5
Vasiliy Strukov
4.89 (173)
Gold Stuff mt5, özellikle altın için tasarlanmış bir trend göstergesidir ve herhangi bir finansal enstrümanda da kullanılabilir. Gösterge yeniden çizilmez ve gecikmez. Önerilen zaman dilimi H1. Ayarları ve kişisel bir bonusu almak için satın alma işleminden hemen sonra benimle iletişime geçin!   AYARLAR Ok Çiz - açık kapalı. grafik üzerinde oklar çizmek. Uyarılar - sesli uyarılar kapalı. E-posta bildirimi - açık kapalı. E-posta Bildirimleri. Puch bildirimi - açık kapalı. Push bildirimleri
Quantum Trend Sniper
Bogdan Ion Puscasu
5 (39)
Tanıtım       Kuantum Trend Keskin Nişancı Göstergesi   , trend tersine dönmeleri belirleme ve ticaret yapma şeklinizi değiştiren çığır açan MQL5 Göstergesi! 13 yılı aşkın ticaret tecrübesine sahip deneyimli tüccarlardan oluşan bir ekip tarafından geliştirilmiştir.       Kuantum Trend Keskin Nişancı Göstergesi       trend dönüşlerini son derece yüksek doğrulukla belirlemenin yenilikçi yolu ile ticaret yolculuğunuzu yeni zirvelere taşımak için tasarlanmıştır. ***Kuantum Trend Keskin Nişancı Gö
74% discount for the next 10 buyers (original price $605): 1 left Get a 50% bonus by buying (or even renting) any of our products. After buying (or renting), send a message for more information. 3 Indicators in 1 indicator Strategy based on price action Made specifically for the best forex currency pairs Can be used in the best time frame of the market at a very reasonable price This indicator is basically 3 different indicatos . But we have combined these 3 indicators in 1 indicator so th
Reversal First Impulse levels (RFI)      INSTRUCTIONS        RUS       -       ENG              R ecommended to use with an indicator   -   TREND PRO -  Version MT4                 A key element in trading is zones or levels from which decisions to buy or sell a trading instrument are made. Despite attempts by major players to conceal their presence in the market, they inevitably leave traces. Our task was to learn how to identify these traces and interpret them correctly. Main functions:: Di
Öncelikle, bu Ticaret Aracının Non-Repainting, Non-Redrawing ve Non-Lagging Gösterge olduğunu vurgulamakta fayda var, bu da onu profesyonel ticaret için ideal hale getiriyor. Çevrimiçi kurs, kullanıcı kılavuzu ve demo. Akıllı Fiyat Hareketi Kavramları Göstergesi, hem yeni hem de deneyimli tüccarlar için çok güçlü bir araçtır. İleri ticaret fikirlerini, Inner Circle Trader Analizi ve Smart Money Concepts Ticaret Stratejileri gibi 20'den fazla kullanışlı göstergeyi bir araya getirerek bir aray
FX Volume MT5
Daniel Stein
4.94 (17)
Sabah Brifingimiz aracılığıyla ayrıntılar ve ekran görüntüleri ile günlük piyasa güncellemenizi alın burada mql5 ve on Telegram ! FX Volume, bir brokerin bakış açısından piyasa duyarlılığı hakkında GERÇEK bir fikir veren İLK ve TEK hacim göstergesidir. COT raporlarından çok daha hızlı bir şekilde, brokerlar gibi kurumsal piyasa katılımcılarının Forex piyasasında nasıl konumlandıklarına dair harika bilgiler sağlar. Bu bilgileri doğrudan grafiğinizde görmek, ticaretiniz için gerçek oyun değiştir
TPSpro TRENDPRO  - is a trend indicator that automatically analyzes the market and provides information about the trend and each of its changes, as well as giving signals for entering trades without redrawing! The indicator uses each candle, analyzing them separately. referring to different impulses - up or down impulse. Exact entry points into transactions for currencies, crypto, metals, stocks, indices!  -  Version MT4               DETAILED DESCRIPTION               R ecommended to use with
RelicusRoad Pro MT5
Relicus LLC
4.82 (22)
Şimdi 147 $ (birkaç güncellemeden sonra 499 $ 'a yükseliyor) - Sınırsız Hesaplar (PC'ler veya Mac'ler) RelicusRoad Kullanım Kılavuzu + Eğitim Videoları + Özel Discord Grubuna Erişim + VIP Durumu PİYASAYA BAKMAK İÇİN YENİ BİR YOL RelicusRoad, forex, vadeli işlemler, kripto para birimleri, hisse senetleri ve endeksler için dünyanın en güçlü ticaret göstergesidir ve yatırımcılara kârlı kalmaları için ihtiyaç duydukları tüm bilgileri ve araçları sağlar. Başlangıç ​​seviyesinden ileri seviyey
Trend Screener Pro MT5
STE S.S.COMPANY
4.87 (62)
Trend Göstergesi, Trend Alım Satım ve Filtreleme için Çığır Açan Benzersiz Çözüm, Tüm Önemli Trend Özellikleriyle Tek Bir Araç İçinde Yerleştirildi! Forex, emtialar, kripto para birimleri, endeksler ve hisse senetleri gibi tüm sembollerde/araçlarda kullanılabilen %100 yeniden boyamayan çoklu zaman çerçevesi ve Çoklu para birimi göstergesidir. Trend Screener, grafikte noktalarla ok trend sinyalleri sağlayan etkili bir trend trend göstergesidir. Trend analizörü göstergesinde bulunan özellikler: 1.
Bill Williams Advanced
Siarhei Vashchylka
5 (4)
Bill Williams Advanced is designed for automatic chart analysis using Bill Williams' "Profitunity" system. The indicator analyzes four timeframes at once. Manual (Be sure to read before purchasing) Advantages 1. Automatically analyzes the chart using the "Profitunity" system of Bill Williams. The found signals are placed in a table in the corner of the screen. 2. Equipped with a trend filter based on the Alligator indicator. Most of the system signals are recommended to be used only accordi
ICT, SMC, SMART MONEY CONCEPTS, SMART MONEY, Smart Money Concept, Support and Resistance, Trend Analysis, Price Action, Market Structure, Order Blocks, BOS/CHoCH,   Breaker Blocks ,  Momentum Shift,   Supply&Demand Zone/Order Blocks , Strong Imbalance,   HH/LL/HL/LH,    Fair Value Gap, FVG,  Premium  &   Discount   Zones, Fibonacci Retracement, OTE, Buy Side Liquidity, Sell Side Liquidity, BSL/SSL Taken, Equal Highs & Lows, MTF Dashboard, Multiple Time Frame, BigBar, HTF OB, HTF Market Structure
AW Trend Predictor MT5
AW Trading Software Limited
4.77 (56)
Tek bir sistemde trend ve kırılma seviyelerinin kombinasyonu. Gelişmiş bir gösterge algoritması piyasa gürültüsünü filtreler, trendi, giriş noktalarını ve olası çıkış seviyelerini belirler. Gösterge sinyalleri, sinyal geçmişinin etkinliğini gösteren en uygun enstrümanların seçilmesine izin veren bir istatistiksel modüle kaydedilir. Gösterge Kâr Al ve Zararı Durdur işaretlerini hesaplar. Kılavuz ve talimatlar ->   BURAYA   / MT4 versiyonu ->   BURAYA Gösterge ile nasıl ticaret yapılır: Trend Pre
Quantum Heiken Ashi PRO MT5
Bogdan Ion Puscasu
4.5 (8)
Quantum Heiken Ashi PRO ile   tanışın Pazar eğilimleri hakkında net bilgiler sağlamak üzere tasarlanan Heiken Ashi mumları, gürültüyü filtreleme ve yanlış sinyalleri ortadan kaldırma yetenekleriyle ünlüdür. Kafa karıştırıcı fiyat dalgalanmalarına veda edin ve daha sorunsuz, daha güvenilir bir grafik sunumuna merhaba deyin. Quantum Heiken Ashi PRO'yu gerçekten benzersiz kılan şey, geleneksel şamdan verilerini okunması kolay renkli çubuklara dönüştüren yenilikçi formülüdür. Kırmızı ve yeşil çubukl
Tanıtım       Quantum Breakout PRO   , Breakout Bölgeleri ile ticaret yapma şeklinizi değiştiren çığır açan MQL5 Göstergesi! 13 yılı aşkın ticaret tecrübesine sahip deneyimli tüccarlardan oluşan bir ekip tarafından geliştirilmiştir.       Kuantum Breakout PRO       yenilikçi ve dinamik koparma bölgesi stratejisiyle ticaret yolculuğunuzu yeni zirvelere taşımak için tasarlanmıştır. Kuantum Breakout Göstergesi, size 5 kar hedefi bölgesi ile kırılma bölgelerinde sinyal okları ve kırılma kutusuna
Blahtech Supply Demand MT5
Blahtech Limited
4.57 (14)
Was: $299  Now: $99   Supply Demand uses previous price action to identify potential imbalances between buyers and sellers. The key is to identify the better odds zones, not just the untouched ones. Blahtech Supply Demand indicator delivers functionality previously unavailable on any trading platform. This 4-in-1 indicator not only highlights the higher probability zones using a multi-criteria strength engine, but also combines it with multi-timeframe trend analysis, previously confirmed swings
FxaccurateLS
Shiv Raj Kumawat
WHY IS OUR FXACCCURATE LS MT5 THE PROFITABLE ? PROTECT YOUR CAPITAL WITH RISK MANAGEMENT Gives entry, stop and target levels from time to time. It finds Trading opportunities by analyzing what the price is doing during established trends. POWERFUL INDICATOR FOR A RELIABLE STRATEGIES We have made these indicators with a lot of years of hard work. It is made at a very advanced level. Established trends provide dozens of trading opportunities, but most trend indicators completely ignore them!
Gartley Hunter Multi
Siarhei Vashchylka
5 (6)
Gartley Hunter Multi - An indicator for searching for harmonic patterns simultaneously on dozens of trading instruments and on all classic timeframes: (m1, m5, m15, m30, H1, H4, D1, Wk, Mn). Manual (Be sure to read before purchasing) | Version for MT4 Advantages 1. Patterns: Gartley, Butterfly, Shark, Crab. Bat, Alternate Bat, Deep Crab, Cypher 2. Simultaneous search for patterns on dozens of trading instruments and on all classic timeframes 3. Search for patterns of all possible sizes. Fr
ADR Ters Çevirme Göstergesi, normal ortalama günlük aralığına göre fiyatın şu anda nerede işlem gördüğünü bir bakışta size gösterir. Fiyat, ortalama aralığı ve seçtiğiniz seviyenin üzerindeki seviyeleri aştığında, açılır pencere, e-posta veya push yoluyla anında uyarılar alacaksınız, böylece hızlı bir şekilde geri çekilmelere ve geri dönüşlere atlayabilirsiniz. Gösterge, grafikte ortalama günlük aralık uç noktalarında yatay çizgiler ve ayrıca fiyatları aşan matematiksel olasılıkları olan seviye
FX Power MT5 NG
Daniel Stein
5 (5)
Sabah Brifingimiz burada mql5 ve on Telegram! FX Power MT5 NG , uzun zamandır çok popüler olan döviz gücü ölçerimiz FX Power'ın yeni neslidir. Peki bu yeni nesil güç ölçer ne sunuyor? Orijinal FX Power hakkında sevdiğiniz her şey PLUS GOLD/XAU güç analizi Daha da hassas hesaplama sonuçları Ayrı ayrı yapılandırılabilir analiz dönemleri Daha da iyi performans için özelleştirilebilir hesaplama limiti Özel çokluDaha fazlasını görmek isteyenler için örnek ayarlar Her grafikte en sevdiğiniz renkler i
Was: $249  Now: $99   Market Profile defines a number of day types that can help the trader to determine market behaviour. A key feature is the Value Area, representing the range of price action where 70% of trading took place. Understanding the Value Area can give traders valuable insight into market direction and establish the higher odds trade. It is an excellent addition to any system you may be using. Inspired by Jim Dalton’s book “Mind Over Markets”, this indicator is designed to suit the
Grafiğinizde otomatik olarak destek ve direnç seviyeleri PLUS itici mum boşlukları çizin, böylece fiyatın nereye gidebileceğini ve / veya potansiyel olarak tersine dönebileceğini görebilirsiniz. Bu gösterge, web sitemde (The Market Structure Trader) öğretilen pozisyon ticareti metodolojisinin bir parçası olarak kullanılmak üzere tasarlanmıştır ve hedefleme ve potansiyel girişler için temel bilgileri görüntüler. MT4 Version:  https://www.mql5.com/en/market/product/97246/ Göstergede 2 TEMEL öze
Advanced Supply Demand MT5
Bernhard Schweigert
4.53 (15)
Herhangi bir Acemi veya Uzman Tüccar için En İyi Çözüm! Bu gösterge benzersiz, yüksek kaliteli ve uygun fiyatlı bir ticaret aracıdır çünkü bir dizi tescilli özelliği ve yeni bir formülü bir araya getirdik. Bu güncelleme ile çift zaman dilimi dilimlerini gösterebileceksiniz. Yalnızca daha yüksek bir TF gösteremeyeceksiniz, aynı zamanda TF grafiğini ve ARTIK daha yüksek TF'yi de gösterebileceksiniz: YUVARLAK BÖLGELERİ GÖSTERMEK. Tüm Arz Talebi tüccarları buna bayılacak. :) Önemli Bilgiler Açıkland
Yeni Başlayanlar veya Uzman Tüccarlar için En İyi Çözüm! Bu Gösterge benzersiz, yüksek kaliteli ve uygun fiyatlı bir ticaret aracıdır çünkü bir dizi tescilli özellik ve yeni bir formül ekledik. Sadece BİR grafik ile 28 Forex çifti için Döviz Gücünü okuyabilirsiniz! Yeni bir trendin veya scalping fırsatının tam tetik noktasını belirleyebildiğiniz için ticaretinizin nasıl gelişeceğini hayal edin? Kullanım kılavuzu:   buraya tıklayın Bu ilk olan, orijinal! Değersiz bir özenti klonunu almayın
IX Power MT5
Daniel Stein
5 (3)
IX Power   nihayet FX Power'ın rakipsiz hassasiyetini Forex dışı sembollere getiriyor. En sevdiğiniz endeksler, hisse senetleri, emtialar, ETF'ler ve hatta kripto para birimlerindeki kısa, orta ve uzun vadeli eğilimlerin yoğunluğunu doğru bir şekilde belirler. Terminalinizin sunduğu   her şeyi analiz   edebilirsiniz. Deneyin ve işlem yaparken   zamanlamanızın   nasıl   önemli ölçüde iyileştiğini   deneyimleyin. IX Power Temel Özellikler 100 hassas, yeniden boyanmayan hesaplama sonuçları -
Fractal Advanced MT5
Siarhei Vashchylka
5 (3)
Fractal Advanced - displays Fractal and Alligator indicators on the price chart. Has wide options for settings and customization. It is also equipped with alerts and a hotkey system. Manual (Be sure to read before purchasing) | Version for MT4 Advantages 1. The indicator does not fill the entire chart with fractals, but allows you to display only relevant signals. 2. The number of fractals is adjusted by scrolling the mouse while holding down the Shift key. 3. Instantly show/hide the Alligator
Top indicator for MT5   providing accurate signals to enter a trade without repainting! It can be applied to any financial assets:   forex, cryptocurrencies, metals, stocks, indices .  Watch  the video  (6:22) with an example of processing only one signal that paid off the indicator! MT4 version is here It will provide pretty accurate trading signals and tell you when it's best to open a trade and close it. Most traders improve their trading results during the first trading week with the help of
The Price Action Finder Multi indicator is an indicator of entry points that searches for and displays Price Action system patterns on dozens of trading instruments and on all standard time frames: (m1, m5, m15, m30, H1, H4, D1, Wk, Mn). The indicator places the found patterns in a table at the bottom of the screen. By clicking on the pattern names in the table, you can move to the chart where this pattern is located. Manual (Be sure to read before purchasing) | Version for MT4 Advantages 1. Pa
Dark Absolute Trend   is an Indicator for intraday trading. This Indicator is based on   Trend Following  strategy but use also candlestick patterns and Volatility. We can enter in good price with this Indicator, in order to follow the main trend on the current instrument. It is advised to use low spread ECN brokers. This Indicator does   Not repaint   and   N ot lag . Recommended timeframes are M5, M15 and H1. Recommended working pairs: All. I nstallation and  Update Guide   -  Troubleshooting
Yazarın diğer ürünleri
Gösterge yükseliş ve düşüş eğilimi gösteriyor. Göstergenin kendisi (normal stokastik gibi) bir alt pencerede görüntülenir. Grafik arayüzü   : Ana pencerede, "Düşük" fiyattan "Düşük" fiyata (yükseliş farklılığı için) ve "Yüksek" fiyattan "Yüksek" fiyata (düşüş eğilimi sapması için) kadar üretilen "trend çizgisi" grafik nesneleri oluşturulur. ). Gösterge, penceresinde yalnızca grafik tamponlarını kullanarak çizer: “Ana”, “Sinyal”, “Nokta”, “Al” ve “Satış”. "Al" ve "Satış" tamponları farklılık gös
Trend göstergesi "   Süper Trend Esnek Uyarısı   " minimum ayara sahiptir. Bu gösterge, kullanımı mümkün olduğunca kolay olacak şekilde tasarlanmıştır. Gösterge, ana renkli bir çizgiyle eğilimi gösterir ("Veri Pencereleri" penceresinde görebileceğiniz ("SuperTrend" satırı). Ayrıca, trendin değiştiği yerlerde, gösterge renkli okları gösterir ( "Veri Pencereleri" penceresinde görebileceğiniz   "STBuy" ve "   STSell" simgeleri       ). Trendin değiştiği yerlerde, gösterge bir sinyal vermez: bir ses
Trend ticaret stratejisi "Süper Trend Esnek Uyarısı EA", aynı adı taşıyan "Süper Trend Esnek Uyarısı" göstergesi üzerine inşa edilmiştir. Danışman göstergedeki tüm bilgileri kullanır, dolayısıyla danışmanın yalnızca üç parametresi vardır, bunlar: "Çalışma zaman dilimi" - çalışma zaman dilimini, göstergenin oluşturulduğu zaman dilimini ve ayrıca "OHLC" verilerinin alındığı zaman dilimini belirtir. "Zararı Durdur", "puan" cinsinden ölçülen zararı durdurmanın sabit boyutudur ("Artı, Ctrl+F" aracın
'Supertrend MetaTrader 5' göstergesi, en basit trend ticaret sisteminin temelidir. Ve yine de çok etkili olmaya devam ediyor. Gösterge herhangi bir zaman diliminde çalışır (mevcut grafiğin zaman diliminde). Adından, bu göstergenin trendi takip ettiğini ve trend değiştiğinde göstergenin trendin değişme noktasını doğru bir şekilde gösterdiğini görebilirsiniz. 'Supertrend MetaTrader 5'in temeli, fiyat ve 'Average True Range göstergesi' değerlerinin bir çarpanla çarpılmasıdır (ayrıca 'ATR' yerine '
The Candle Length Indicator Alarm generates a sound alert, sends a push notification and an email when the size of the current candlestick changes. The size of the current candlestick can be measured in two ways: The first method: the size of the candlestick is measured from the beginning of the candlestick (from the OPEN price). The second method: the size of the candlestick is measured from current price. The indicator has the following settings: sound — a sound file from the folder: "...\Meta
The Buy Sell Color Background indicator changes the background color depending on position direction. It has three settings: Background color for BUY - background color for a Buy position Background color for SELL - background color for a Sell position Default background color - background color with no open position After you detach the indicator from a chart, its background color changes to Default background color .
The calculator of signals operates directly from the MetaTrader 5 terminal, which is a serious advantage, since the terminal provides a preliminary selection and sorts out signals. This way, users can see in the terminal only the signals that ensure a maximum compatibility with their trading accounts. The calculator of signals gives the answer to the one of the questions most frequently asked by users of the Signals service: "Will I be able to subscribe to the signal NNN, and what volume of the
Arrow Signal
Vladimir Karputov
Bu gösterge "Stokastik" kategorisine aittir. Gösterge kontrolünü mümkün olduğunca basitleştirmeye çalıştım, bu nedenle giriş parametrelerinde minimum ayarlar gösteriliyor: bu, sinyal okları için bir simge seçimidir. "Satın Al" sinyali '   Al Ok kodu   ' parametresi ile, "Sat" sinyali ise '   Ok Sat kodu   ' parametresi ile kodlanır. Sinyaller için sinyal ok kodları (lütfen 32 ile 255 arasındaki değerleri kullanın) Wingdings yazı tipinden alınmıştır. Gösterge her tik üzerinde çalışır ve mevcut çu
An Expert Advisor based on the custom indicator. Search for a signal at every tick. Positions are closed by an opposite signal. No trailing. There is no stop loss. There is no take profit. Has a minimum of settings Money management: Lot OR Risk   - type Money management The value for "Money management"   - Money management value Deviation   - admissible slippage Buy Arrow code   (font Wingdings) - character code from 'Wingdings' font for BUY signals Sell Arrow code   (font Wingdings) - characte
Ma Dema Alert
Vladimir Karputov
Gösterge üç çizgi görüntüler ve iki tür kavşağı izler. Göstergenin üç satırı: "   MA   " - yavaş gösterge "Hareketli Ortalama", "   DEMA Yavaş   " - yavaş gösterge "   Çift Üstel Hareketli Ortalama" ve "   DEMA Hızlı   " - hızlı gösterge "Çift Üstel Hareketli Ortalama". İki tür kavşak       : "   MA Uyarı Fiyatı   " - fiyat   "MA" çizgisini geçiyor ve   "   Alert DEMA DEMA   " - çizgiler kesişiyor       "DEMA Yavaş" ve   "DEMA Hızlı   ". Karşıdan karşıya geçerken aşağıdaki seçenekler mevcuttur:
Bu Uzman Danışman, manuel ve yarı otomatik ticaret için yardımcı programlar sınıfına aittir. "   Günün uç   noktalarında bekleyen emir " EA, bir önceki günün uç noktalarında bekleyen iki emir verir. Parametre "   Bekleyen Emirler: ...       ", bekleyen emirlerin türünü seçmenizi sağlar: "   Alış Durdurma ve Satış Durdurma   " veya "   Alış Limiti ve Satış Limiti   "   .       aşırılık       'Düşük' ofset aşağı doğru yapılır). "   Yeni beklemede -> öncekileri sil   " "   true   " olarak ayarlandı
"Panel Kısmi Kapatma" yardımcı programı paneli, kâr getiren bir pozisyonun hızlı bir şekilde kısmen kapatılması için tasarlanmıştır. Yalnızca iki parametresi vardır: "   Kısmi kapatma #1   " ve "   Kısmi kapatma #2   ". Herhangi bir sembol ve herhangi bir 'Sihirli sayı' için çalışır - yani, yardımcı program öncelikle manuel ticaret için tasarlanmıştır. Nasıl çalışır: Örneğin, "EURUSD", "Jump 100 Index" ve "XAUUSD" (altın) üzerinde çeşitli pozisyonlarınız var. Yardımcı program en yüksek karı olan
MQL5 "Günlük direnç ve destek" göstergesi - günlük destek ve direnç çizgilerini çizer. Çizim yalnızca grafik nesnelerin (trend çizgileri) yardımıyla gerçekleştirilir - bu göstergede gösterge tamponları kullanılmaz. Göstergenin herhangi bir ayarı yoktur - seviye araması "D1" zaman aralığından son 500 barda gerçekleştirilir ve bu parametre kodun içinde fiziksel olarak bağlanmıştır. Manuel ticaret: Manuel alım satım yaparken, bu göstergenin "M10" ile "H1" arasındaki zaman dilimlerinde kullanılması
"   Çoklu Sembol İzleme   " yardımcı programı, halihazırda açık olan tüm pozisyonlar için Kaybı Durdur'u hareket ettirir (çoklu sembol izleme). Öncelikle manuel ticarete yardımcı olmayı amaçlamaktadır. Yardımcı program için döviz çiftinin adına veya bireysel tanımlayıcıya (Sihirli sayı) göre herhangi bir kısıtlama yoktur - yardımcı program kesinlikle şu anda açık olan tüm pozisyonları işler. "   Trailing Stop   " ve "   Trailing Step   " parametrelerinin ölçü birimi puandır (1.00055 fiyatı ile
"Trend İki Hareketli Ortalama" trend göstergesi, hesaplama sonuçlarını görüntülemek için iki tür Ok kullanır - bunlar "Trend UP" ve "Trend DN".       Oklar "Trend Yukarı"       çizilir       İle       fiyat       'Düşük'       çubuk   ,       A       Oklar "Trend DN" -       İle       fiyat       'yüksek'. Trend arama algoritması, bir çubuğun fiyatının analizine ve iki 'Hareketli Ortalama' göstergesinin değerlerine dayanır. Trend yönü, mevcut (sıfır) çubuğunda hesaplanır. Bu nedenle, 1 numaralı
Üç Zaman Çerçevesi gösterge paneli. Gösterge, CAppDialog sınıfına dayalı bir panel şeklinde yapılır. Panel, fare kullanılarak simge durumuna küçültülebilir veya geçerli grafikte hareket ettirilebilir. Gösterge, paneldeki mevcut sembolün üç zaman dilimini gösterir. Mevcut sürümde, göstergenin minimum sayıda ayarı vardır - bunlar üç zaman diliminin parametreleridir: "Daha genç zaman dilimi", "   Orta   zaman dilimi   " ve "   Daha eski   zaman dilimi   ". Başlatıldığında, gösterge paneli mevcut ta
"   Piyasa Seans Süreleri   " göstergesi dört işlem seansının süresini gösterir: Asya, Avrupa, Amerika ve Pasifik. Ticaret seanslarının süresi   şu formatta   ayarlanır:       GMT ve dolayısıyla ticaret sunucusuna hiç bağlı değildir. Aşağıdaki veriler kullanılır: Ticaret Seansı Şehir GMT Asya Tokyo Singapur Şanghay 00:00−06:00 01:00−09:00 01:30−07:00 Avrupa Londra Frankfurt'ta 07:00−15:30 07:00−15:30 Amerika New York Chicago 13:30−20:00 13:30−20:00 Pasifik Wellington Sidney 20:00−
Çeşitli ticaret işlemleri için ticaret sistemi. Belirli indirim görevleri veya benzerleri için kullanılan bakiyeyi sıfır civarında dolaşacak şekilde ayarlamanıza olanak tanır. Riskten korunma   hesaplarıyla çalışacak şekilde yapılandırılmıştır.   Piyasada birden fazla pozisyon bulunamaz   . Genel bir ayar olan "   Adım, Zararı Durdur, Kar Al   " parametresi puan cinsinden ölçülür (EURUSD için örnek: 1.00055-1.00045 = 10 puan). Danışman,   pozisyon yerleştirirken marj eksikliğiyle karşılaşırsa ti
Gösterge daha yüksek zaman dilimindeki Fraktalları gösterir. İki tür Fraktal görüntülemek mümkündür: 'Normal Fraktal' ve 'BW Fraktal'. Fraktal 'UP' oluşumunu düşünün. 'Düzenli Fraktal', her bir sonraki 'yüksek' fiyatın (orta çubuğun solunda ve sağında) daha küçük olduğu çok katı bir Fraktaldır. Oysa 'BW Fractal'da tek bir koşul vardır: Merkezi çubuğun (fiyatı 'yüksek') en yüksek olması gerekir. Görsel olarak bu iki mod arasındaki fark diyagram 1'de görülebilir. 'Daha Yüksek Zaman Çerçevesi' par
Yapay Zeka Desteği Direnci Bu, “Destek” ve “Direnç” satırlarını arayan bir göstergedir. Arama, sayısal analiz ve veri işlemeye yönelik bir algoritma kullanılarak gerçekleştirilir. Üç arama seçeneği mevcuttur (“mod #1”, “mod #2” ve “mod #3”). Bu seçeneklerin her biri kendi dahili algoritmasında farklılık gösterir (şu anda bunlar tamamen dahili ayarlardır, kullanıcı tarafından kullanılamaz). Bu seçeneklerin aramanın ciddiyetine göre farklılık gösterdiğini söyleyebiliriz. Sınırlama: Şu anda gösterg
Yardımcı program "       Zaman Yöneticisini Aç       " belirli bir zamanda bir pozisyon açar ve ardından klasik takibi etkinleştirir. Zaman ("       Şimdi       ":"       dakika       ") her zaman GMT zaman diliminde bir GMT Farkı ile ayarlanır. ' tuşunu kullanarak bir pozisyon açmak için üç seçenek seçebilirsiniz.       Ticaret Modu       ': '       ELDE ETMEK       ' '       SATMAK       ' '       AL ve SAT (aynı anda)       ' '       KAPALI (değişim yok, yalnızca son çalışmalar)       ' Dörd
Gösterge       "Destek" ve "Direnç" çizgilerini gösterir (bu çizgiler DRAW_LINE çizim stili kullanılarak çizilmiştir - yani bunlar grafik nesneleri değildir). "Sinyal çubuğunun" solunda ve sağında yeni minimum ve maksimumlar için bir arama gerçekleştirilir - "sinyal çubuğu" her yeni yapının geleneksel ortasıdır. Göstergenin adında neden Esnek kelimesi geçiyor? Çünkü "sinyal çubuğunun" solunda ('Sol Çubuklar') ve sağında ('Sağ Çubuklar') farklı sayıda çubuk belirtme olanağımız var. Gösterge çizgi
Kontrol paneli iki göstergenin okumalarını tarar: 'MACD' ve 'Stokastik'. Sinyalleri üç sütunda görüntüler: MACD için, Stokastik için ve sonuç sütunu (sinyal her iki gösterge için de aynıysa). Tarama bir veya daha fazla zaman diliminde seçilebilir. Tüm zaman aralıklarını devre dışı bırakırsanız kontrol paneli yine de yüklenir, ancak bu tür durumlara özel ayarlar bulunur. Sinyaller her zaman göstergenin sıfır çubuğu (sıfır çubuğu grafikte en sağdaki çubuktur) açısından kontrol edilir. Parametreler
ATR Bantları Uyarısı, kanal genişliğinin sabit bir çarpan ("Çarpan") ve "Ortalama Gerçek Aralık" göstergesinin değeri olarak hesaplandığı bir kanal göstergesidir. Bollinger Bantlarından farklı olarak bant genişliği çok sık değişmez; ATR Bant Uyarısı göstergesinde bantlar genellikle uzun düz çizgilere sahiptir. ATR Bantları Uyarısının yorumlanması, fiyatın çoğu zaman bantların içinde olduğu gerçeğine dayanmaktadır ve fiyatın sınırlardan birine ulaşması bir trend değişikliğine işaret edebilir.
Filtrele:
İnceleme yok
İncelemeye yanıt
Sürüm 1.24 2024.05.06
BOS and CHoCH are now at least three bars
Sürüm 1.23 2024.04.28
Hid the service commands 'Prints'.
Sürüm 1.22 2024.04.26
Fix right bar
Sürüm 1.21 2024.02.14
Correct processing of gaps
Sürüm 1.20 2024.02.14
Increased work speed (this is especially noticeable in the tester)
Sürüm 1.19 2024.02.13
Fix right bars
Sürüm 1.18 2024.02.13
Small bug fixes with fonts. Add four buffers: "BOS UP", "CHoCH UP", "BOS DOWN" and "CHoCH DOWN"
Sürüm 1.17 2024.01.12
1.17 Refused indicator buffers. Added by BOS/CHoCH
Sürüm 1.16 2023.12.06
The signal is searched for on a fully formed bar - therefore the signal is not redrawn.
Sürüm 1.15 2023.10.13
++ "Max bars"
Sürüm 1.14 2023.10.11
Küçük algoritma iyileştirmesi
Sürüm 1.11 2023.10.04
Metin etiketleri eklendi. Renk, giriş parametrelerine dahil edilir.
Sürüm 1.10 2023.10.02
'Güçlü' mod = 'doğru': Yüksek ve Düşük'ün kesin karşılaştırması