Win rate signal Echidna
- Göstergeler
- Eve sense Co., Ltd.
- Sürüm: 1.21
- Etkinleştirmeler: 10
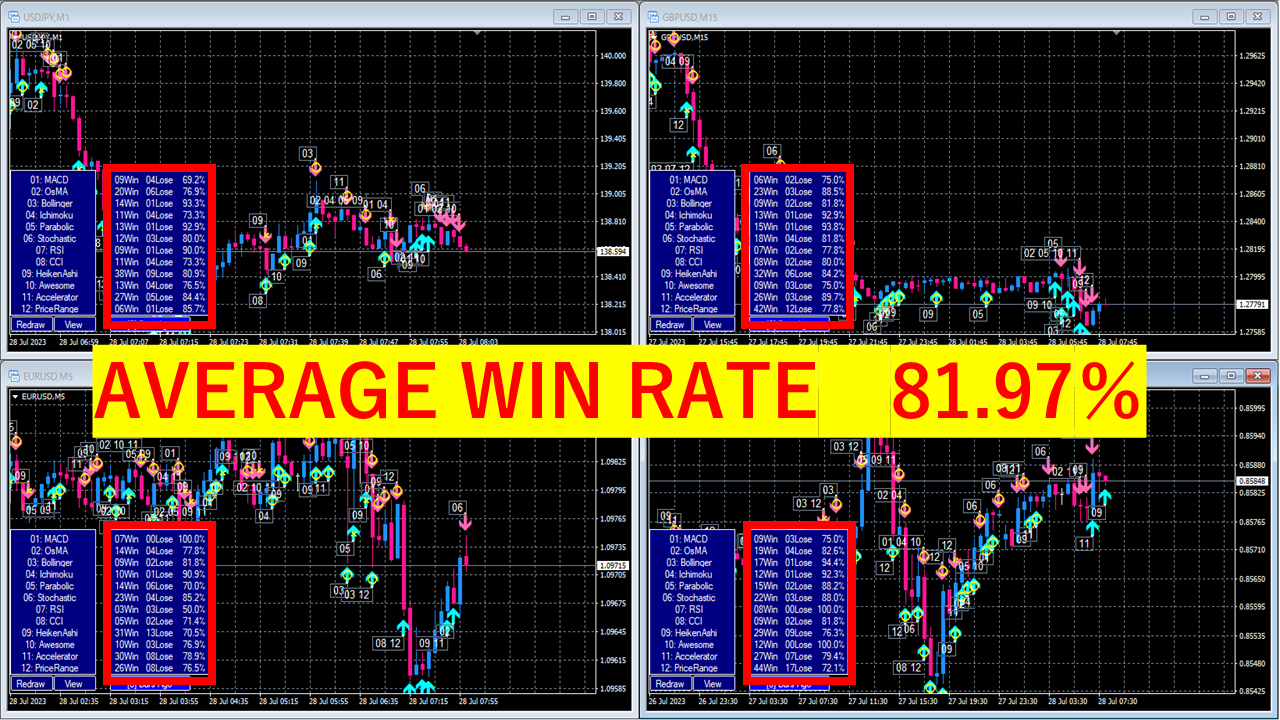
■ 12 Tür Teknik Analiz Dahildir! Kazanma Oranı Hesaplama Sistemi ile Donatılmış Gösterge
【Gösterge Özellikleri】
Bu gösterge, sinyal işaretleri aracılığıyla 12 tür normal teknik analizi sezgisel ve net bir şekilde doğrulamanıza olanak tanır.
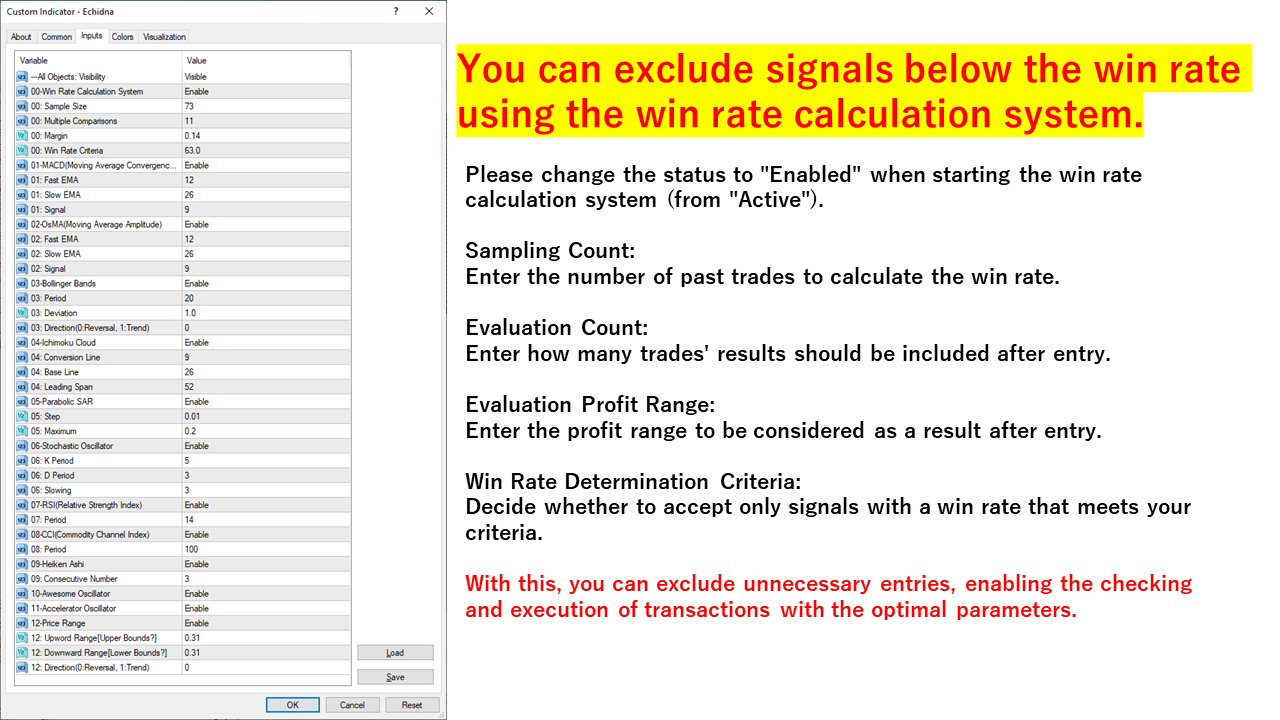
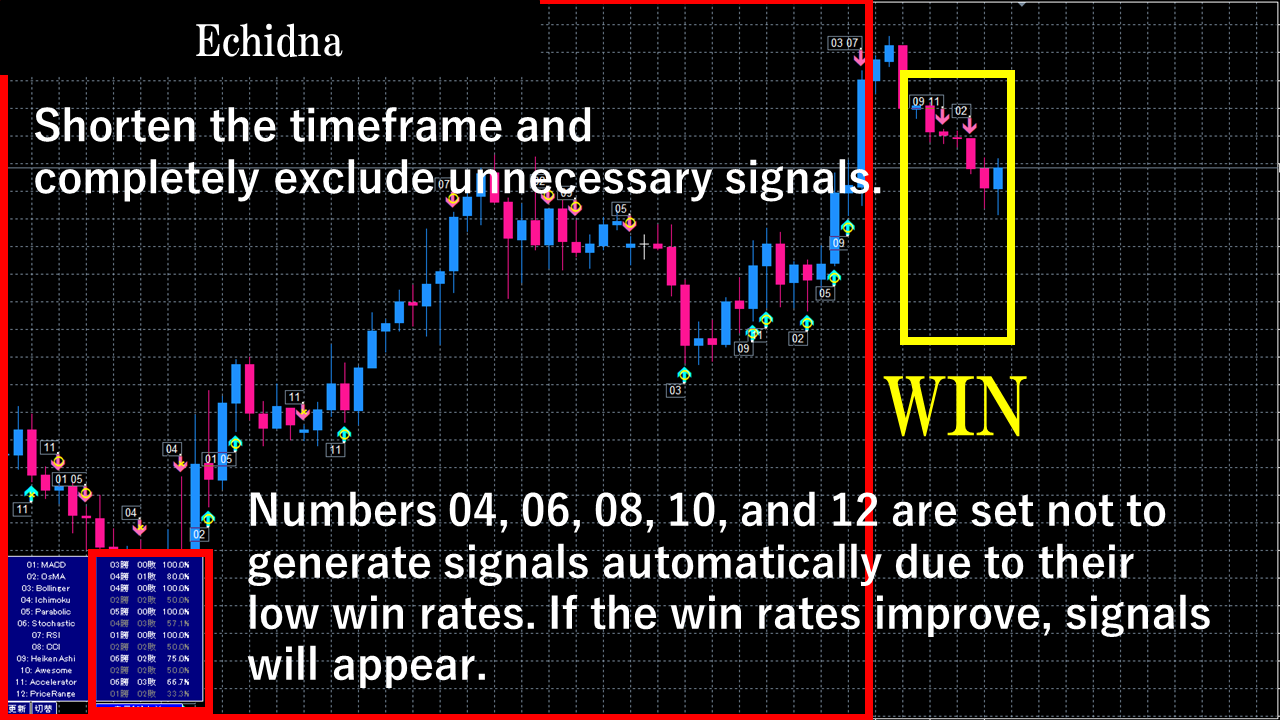
Ayrıca, mevcut parametrelerin uygun olup olmadığını kontrol eden ve kazanma oranı düşük olduğunda sinyal vermekten kaçınan otomatik bir kazanma oranı belirleme sistemine sahiptir.
Bu, gereksiz girişleri azaltır ve yalnızca kazanma oranı yüksek olduğunda işlemlere girmenizi sağlar.
【Önemli Açıklama】
・Yeniden boyama yok. 1 dakikalık grafiklerden haftalık grafiklere kadar kullanılabilir.
・Para birimi kısıtlaması yok. Tüm döviz çiftleri için kullanılabilir.
· Kazanma oranlarını hesaplama yeteneği.
・Sinyaller, yalnızca önceden belirlenmiş kazanma oranına veya daha yüksek bir orana ulaşıldığında üretilir.
・Yükü azaltmak için optimize edildi! 9 döviz çifti ile uzun süreli çalışmaya ve eş zamanlı kullanıma uygundur.
・Tanınmış bir gösterge olarak, sinyalleri takip ederken çalışmayı sağlar.
・Hata ayıklama, sorunları çözmek için hata ayıklayıcılar tarafından desteklendi ve doğrulandı.
【ECHIDNA Ok İşareti Açıklaması】
ECHIDNA Ok İşareti Göstergesi, "ok işaretleri" aracılığıyla dünyaca ünlü 12 tür teknik analiz sağlayan kullanışlı bir araçtır.
Kullanım kolaylığı için tasarlanmıştır ve bireysel parametre ayarlarına ve gereksiz göstergelerin kaldırılmasına izin verir.
Önemli gördüğünüz teknik yönlere göre ok işaretleri ile size rehberlik eder.
Özellikler:
・"Ok işaretleri" ile 12 tür gösterge analizi sağlar.
・Kazanma oranlarını kontrol eder ve yalnızca önceden belirlenmiş kazanma oranı veya daha yüksek bir oran elde edildiğinde sinyalleri görüntüler.
・Yükü azaltmak ve uzun süreli kullanım sağlamak için optimize edilmiştir.
Desteklenen Göstergeler:
01-MACD (Hareketli Ortalama Yakınsama Sapması)
02-OsMA (Osilatörün Hareketli Ortalaması)
03-Bollinger Bantları
04-Ichimoku Bulutu
05-Parabolik SAR (Durdurma ve Geri Alma)
06-Stokastik Osilatör
07-RSI (Göreceli Güç Endeksi)
08-CCI (Emtia Kanal Endeksi)
09-Heiken Ashi (Ortalama Barlar)
10-Müthiş Osilatör
11-Hızlandırıcı Osilatör
12-Fiyat Aralığı
ECHIDNA Ok İşareti Göstergesi, verimli ve doğru ticareti destekleyen, tüccarlar için güçlü bir araçtır.
Elbette, bu rüya gibi göstergeyi edinelim ve ticarette başarıyı hedefleyelim!