Bir ticaret robotunun nasıl sipariş edileceğini izleyin
Bir sipariş vermeden veya bir siparişe başvurmadan önce kuralları okuyun
MQL5 ve MQL4'teki bir ticaret robotu nasıl sipariş edilir?
Bir robot sipariş etmek için örnek İş Gerekliliklerine bakın
Kategorideki yeni siparişler:
30 - 100 USD
30 - 60 USD
300+ USD
120+ USD
75 - 100 USD
İş tamamlandı
Tamamlanma süresi: 7 gün
İş Gereklilikleri
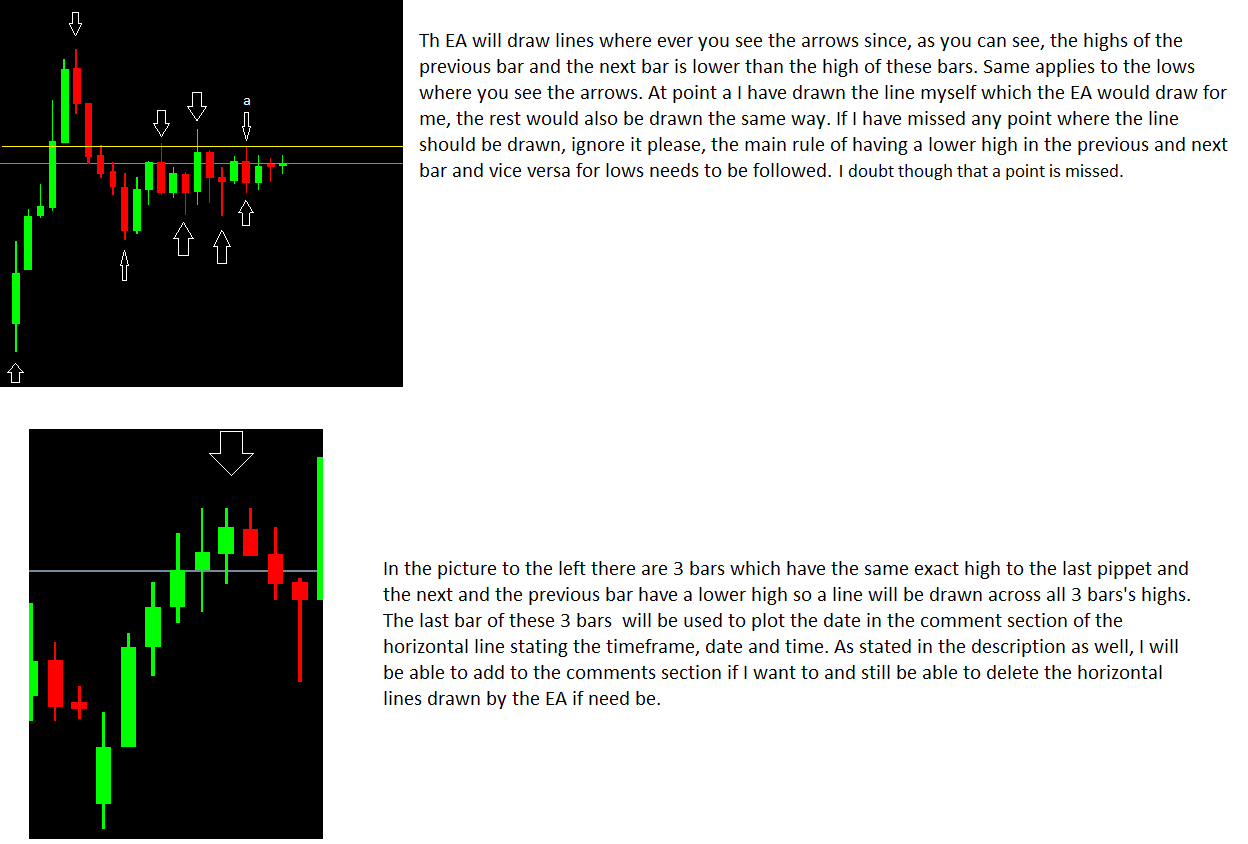
I want to have a software delivered with source code, I am not sure if it will be an indicator or an expert advisor but this software will be able to draw horizontal lines across any bar high whose previous bar and the next has a lower high. It will be vice versa for the low, so the software will draw a horizontal line across any bar's low whose previous bar and the next has a higher low. I have attached a picture named 1 to explain this point. It will be across the entire graph and all the bars as far as the graph can go historically. If there is need to load the bars first by scrolling backwards as far as MT4 will allow I will do it manually and then when I apply the EA to the graph, it will draw these horizontal lines. The EA will ignore the latest/current bar on the graph and I guess the bar before but I think I will be able to get a better understanding of this once I start using the EA.
The high will be calculated to the last pippet which will be based on the numbers from data window or that small window that pops up showing high, low, open and close when you hover over a bar which shows the same data as the data window but its important that its to the last pipet not just pip so that more accurate highs and lows are drawn.
If there are multiple bars that have the same high, for example lets say there are 5 bars which have the same high(5 bars is just an example it can be any number of bars but obviously that many bars having the same high/low is unlikely) then if there is a previous and the next bar, before and after those 5 bars who have a lower high then there will be a line drawn on those 5 bars high. This point is explained in picture 1.
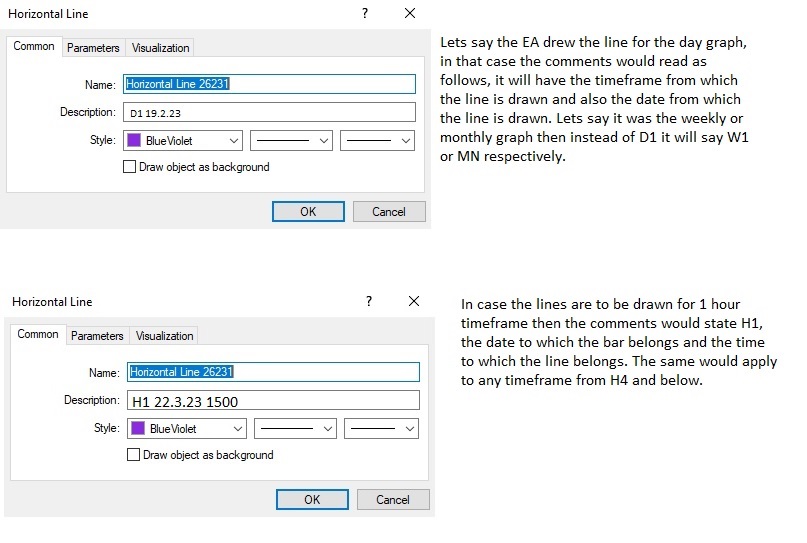
In the comment section of the line, it will say which timeframe it belongs to and it will have the date and time where the bar is located. For day, week and month, it will obviously only have the date not time. For bars where multiple bars have the same highs as explained in the above paragraph, the last bar will be used to plot the date and time. This point has been explained in the picture named 2.
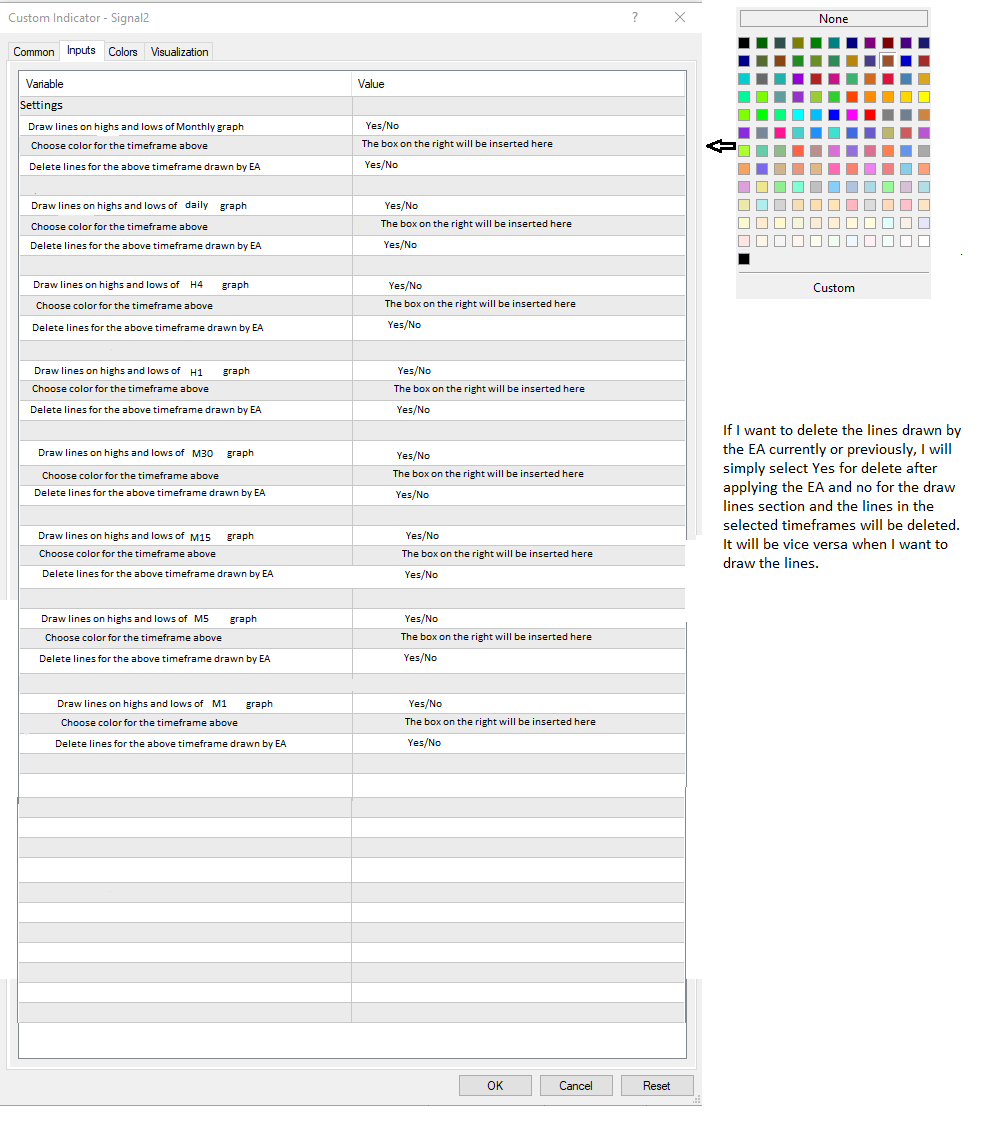
I will be able to choose in which timeframes I want these lines drawn and also I will be able to choose the colour of the horizontal line for each timeframe. This point is explained further in picture titled 3.
Once drawn I will be able to remove the EA but the lines will stay. I will be able to manually delete the selective lines as well once the EA is removed.
If I want to delete the lines drawn in a particular timeframe or all the timeframes by the EA, I will be able to delete them by reapplying the EA and selecting the timeframes I want lines removed from. The EA setting window picture gives a better idea as to what I mean. Only the lines drawn by the EA and of the selected timeframe from the EA will be deleted, not others which I have drawn manually previously. This point is explained further in picture titled 3. So when I want to draw lines I will select the Draw lines sections as Yes and Delete lines section as No, and when I want to delete lines it will be vice versa.
The product requirements are listed in this text and in the pictures so both need to be addressed and completed. I have tried my best to list all the features that are needed by the indicator in text and pictures combined but there might be things that might require changes. I would kindly request the developer to keep in mind that I can ask up to 50 changes. I am not saying that this would definitely will be required since if the indicator functions as it should then no changes would be required but if it requires changes, which I am hoping it doesnt, then those changes can be upto 50. The 50 changes come into action if I have a functional indicator which does what I have requested for. If it turns out as something entirely different, which I doubt will happen, then the changes to get the correct product produced will not count as part of the 50 changes. I have a feeling though with the pictures I have used that will not be required.
Also I might include requirement changes in the alert indicator since once you use a product you often spot additional information that you want from the indicator and for that reason the developer should keep in mind up to 50 requirement changes but again I seriously doubt if that would be needed since I think I have listed everything in the text.
I would again like to request the developer that I would require a spell of 3 days 3 times while the market is open so that I can point out the problems. Again it is not necessary that this will definitely happen but if it does happen, I would be able to request changes properly this way. Again I am hoping I dont have to use all the 3 attempts since I have tried to explain everything in the pictures and the text.
Yanıtlandı
1
Derecelendirme
Projeler
1
0%
Arabuluculuk
1
0%
/
0%
Süresi dolmuş
0
Çalışıyor
2
Derecelendirme
Projeler
75
51%
Arabuluculuk
8
38%
/
38%
Süresi dolmuş
7
9%
Çalışıyor
Benzer siparişler
I need a EA which is based upon bollinger band break by X points + Highs and Lows of candle body and wick (high or low of the bar). Trading Hours: 02:00-10:00 etc Lot size % of balance option Take profit $: X (close open trades and stop trading for the day.) TP: 1, 2, 3 Move to Break Even: 1,2, 3 Must know how to open up to 3 trades with move to Break Even up to 3 INSTANTLY no lag at all. Please request rest of
I want an Indicator that : Draws vertical lines at the opening of candles on a time frames selected.( I want to be able change the candle timeframe the line will be drawn. Eg. I can slelect 1H, 4H etc from the settings, and the vertical line will be drawn at the opening). Draw a horizontal line at the opening of the candles in the selected timeframe. Calculate the average range of the candles on a selected timeframe
I need an experienced developer who can develop an indicator properly showing a supply and demand areas , it will indicate fair value gap (FVG) and Break of Market Structure with a good, inputted parameters for settings. I will send you description on the job when you are selected
I have 5 EMA strategy works in BTC or ETH want to know if someone help me to make my strategy into the Master Robot If a Candle below 5 EMA we have to sell
Create mql4 EA to trade News
120+ USD
Creating a trading robot on mql4 for trading news mainly usd, eurozone, gdp and aud to open trades when 10 minutes after current news has been released( time frame to have an option to adjust) Open buy when actual is greater than previous news. Open sell when actual news is lower than previous news. Take profit 50 pips. To open a recovery trade when RSI 21 on daily chart goes in into oversold or overbought scenarios
Black Scholes Model: EA?
50 - 200 USD
Has anyone tried to create an EA based on the black scholes model? A) Is it even possible for metatrader5? B) What need to be added as input? C) Which other statistical and mathematical models could work and how? D) Do you have know-how in statistical and mathematical models? Would like to see some results
Date folder password lock
30+ USD
I want to lock my indicators and my EAs in the data folder with a password because i am going to give my pc to a trader , the real names of the indicators also should be changed or covered on the screen so no one should go and find them online
A professional and Expert Developer Needed for Pine Script to MQL Conversion and Licensing System
30 - 60 USD
I am seeking an experienced developer for a project that involves two main tasks: Pine Script Conversion: I have a trading script written in Pine Script that is currently operational. I need this script converted to MQL4/MQL5 for use on the MetaTrader platform. Licensing System Development: I need a system to manage the distribution of my trading bot. This system should allow me to sell the bot and control access
I am looking for a skilled developer to assist me with a project involving the following tasks: Convert Pine Script to MQL4/MQL5: I have an existing script written in Pine Script that is already functioning well. I need it converted to MQL4 or MQL5 for use on MetaTrader. Licensing System Implementation: I require a system where I can sell my trading bot and manage access through licenses. This system should allow me
Trade Entry Rule : 1 . New Arrow Higher or Lower Appear : Entry . (Range/Period: {Input}) After Entry Trailing Stop Trails { Trail Step (Input) } 2 . Lot Size { Input } 3 . Take Profit { Input } 4 . Max Number of Trades { Input } 5 . Total Number of Trades per Entry { Input } ---------------------------------------------------------------------------- 6 . Spread Filter { Input }
Proje bilgisi
Bütçe
30 - 40 USD
Geliştirici için
27
- 36
USD
Son teslim tarihi
to 10 gün