Fan sayfamıza katılın
Öyleyse bir link gönderin -
başkalarının da faydalanmasını sağlayın
- Yayınlayan:
- Nikolay Kositsin
- Görüntülemeler:
- 104
- Derecelendirme:
- Yayınlandı:
-
Bu koda dayalı bir robota veya göstergeye mi ihtiyacınız var? Freelance üzerinden sipariş edin Freelance'e git
Gerçek Yazar:
Shurka & Kevin
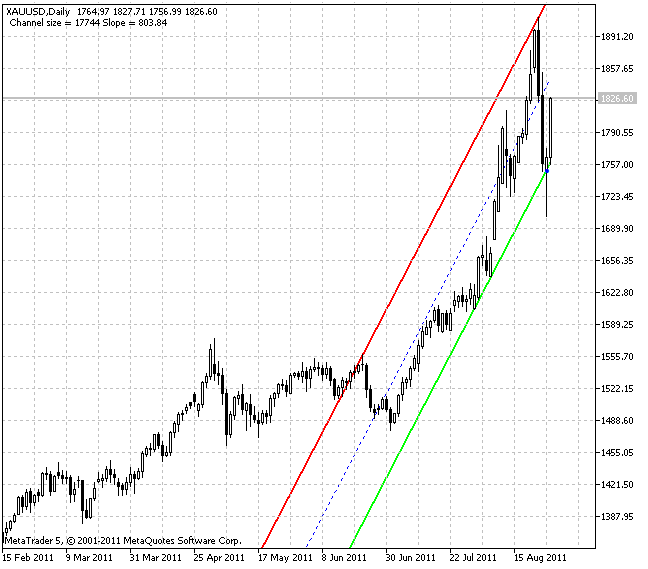
SHI_Channel_true göstergesi, otomatik modda grafik üzerinde dinamik Barishpolz hareketli kanalları görüntüler.
Göstergenin özü, geçmişte en yakın fraktali bulması, bir sonrakini araması ve onun boyunca bir çizgi çizmesidir. Karşı tarafta maksimum fraktal üzerinde paralel bir çizgi çizer. Ortadaki çizgi bunların arasına çizilir.
Parametreler (parametrenin varsayılan değeri parantez içindedir): BarsForFract(0) - fraktalın "omuz" uzunluğu.
Klasik bir fraktal beş çubuktan oluşur: ekstremum ve her iki tarafta iki çubuk ("omuz" eşittir 2). Ancak, daha önemli hale getirmek için "kaldıracı" artırabilirsiniz. Parametre 0'a eşitse, "kaldıraç" boyutu grafiğin zaman aralığına bağlıdır ve program tarafından otomatik olarak ayarlanır.
Gösterge, M1'den başlayarak tüm döviz çiftlerinde ve tüm zaman dilimlerinde çalışır. Gösterge iki varyantta yapılır. NB_SHI_Channel_true göstergesinde, Uzman Danışmanlardan bu verilere olası erişim için gösterge arabelleklerine ek olarak bir kanal oluşturan üç çizgi yerleştirilir.
Bu gösterge ilk kez MQL4'te uygulanmış ve 13.10.2006 tarihinde mql4.com adresindeki CodeBase 'de yayınlanmıştır.

MetaQuotes Ltd tarafından Rusçadan çevrilmiştir.
Orijinal kod: https://www.mql5.com/ru/code/484
 Profit labels for closed trades (deals)
Anlaşmalarda (kapalı işlemler) strateji test cihazında da gösterilen kar etiketleri oluşturma
 WATR
WATR
Basit ama net bir trend göstergesi.
 3LineBreak
Yükseliş eğilimi için çubukları mavi, düşüş eğilimi için kırmızı renklendiren bir gösterge.
 Schaff Trend Döngüsü
Schaff Trend Döngüsü göstergesi, çalışma prensibi gereği, döngüleri kullanarak MASD çizgisi ile stokastik mekanizmaları kullanan döngüsel bir osilatördür. Sonuç olarak, bu göstergenin geliştiricileri, komut dosyasının daha istikrarlı ve güvenilir sonuçlarını elde etmeyi başardılar.