Fan sayfamıza katılın
Öyleyse bir link gönderin -
başkalarının da faydalanmasını sağlayın
- Görüntülemeler:
- 11498
- Derecelendirme:
- Yayınlandı:
- 2019.02.21 12:43
-
 Ticaret fırsatlarını kaçırıyorsunuz:
- Ücretsiz ticaret uygulamaları
- İşlem kopyalama için 8.000'den fazla sinyal
- Finansal piyasaları keşfetmek için ekonomik haberler
Kayıt Giriş yapGizlilik ve Veri Koruma Politikasını ve MQL5.com Kullanım Şartlarını kabul edersiniz
Hesabınız yoksa, lütfen kaydolun
-
 Bu koda dayalı bir robota veya göstergeye mi ihtiyacınız var? Freelance üzerinden sipariş edin
Freelance'e git
Bu koda dayalı bir robota veya göstergeye mi ihtiyacınız var? Freelance üzerinden sipariş edin
Freelance'e git
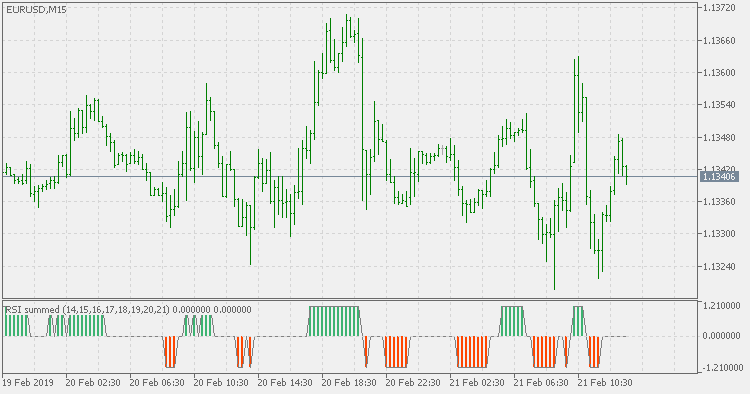
Theory :
The theory of this indicator is simple :
It takes nnn RSI values specified by periods parameter and checks if all the nnn rsi values are above or bellow the required value. If they are above, it shows it as state up, if all are bellow the desired low level, it shows it as state down, otherwise it shows it as neutral state. One may argue that that state can be obtained by checking the slowest rsi only, but in some cases it is not so (it largely depends on the periods used) hence the indicator does it for all the specified RSI values
Periods used can be specified as a list separated by ":". Default is 14;15;16;17;18;19;20;21
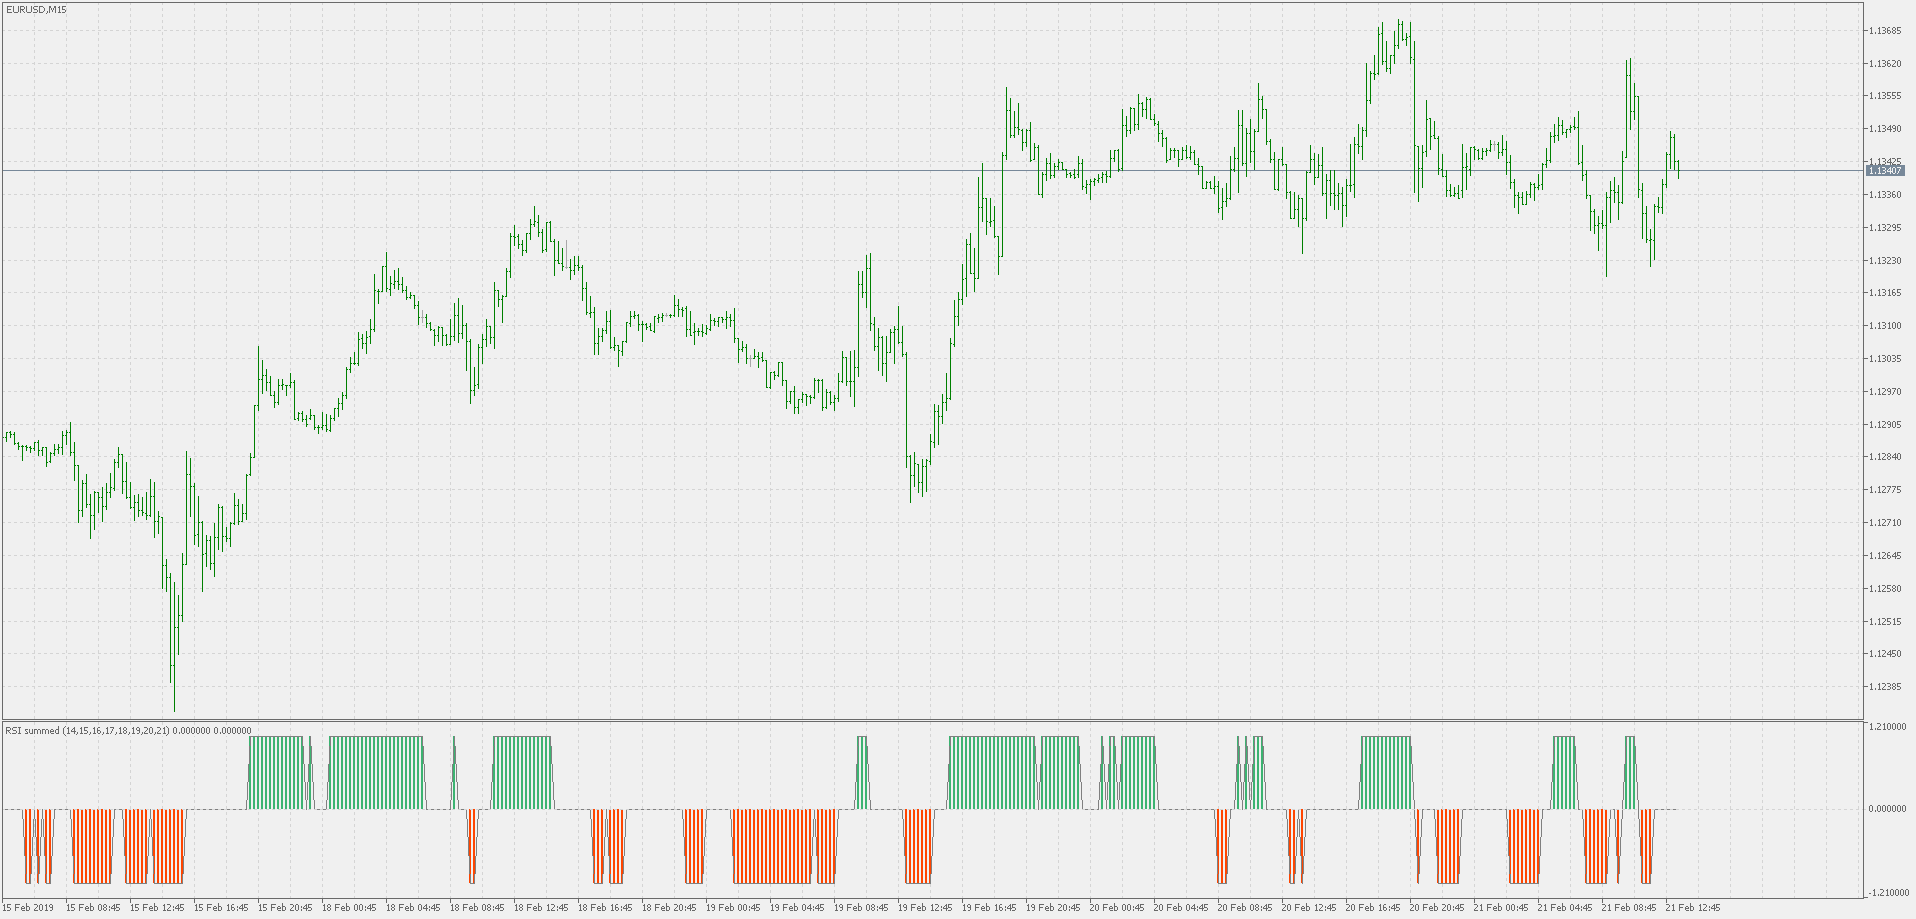
Usage :
You can use the color change as signals
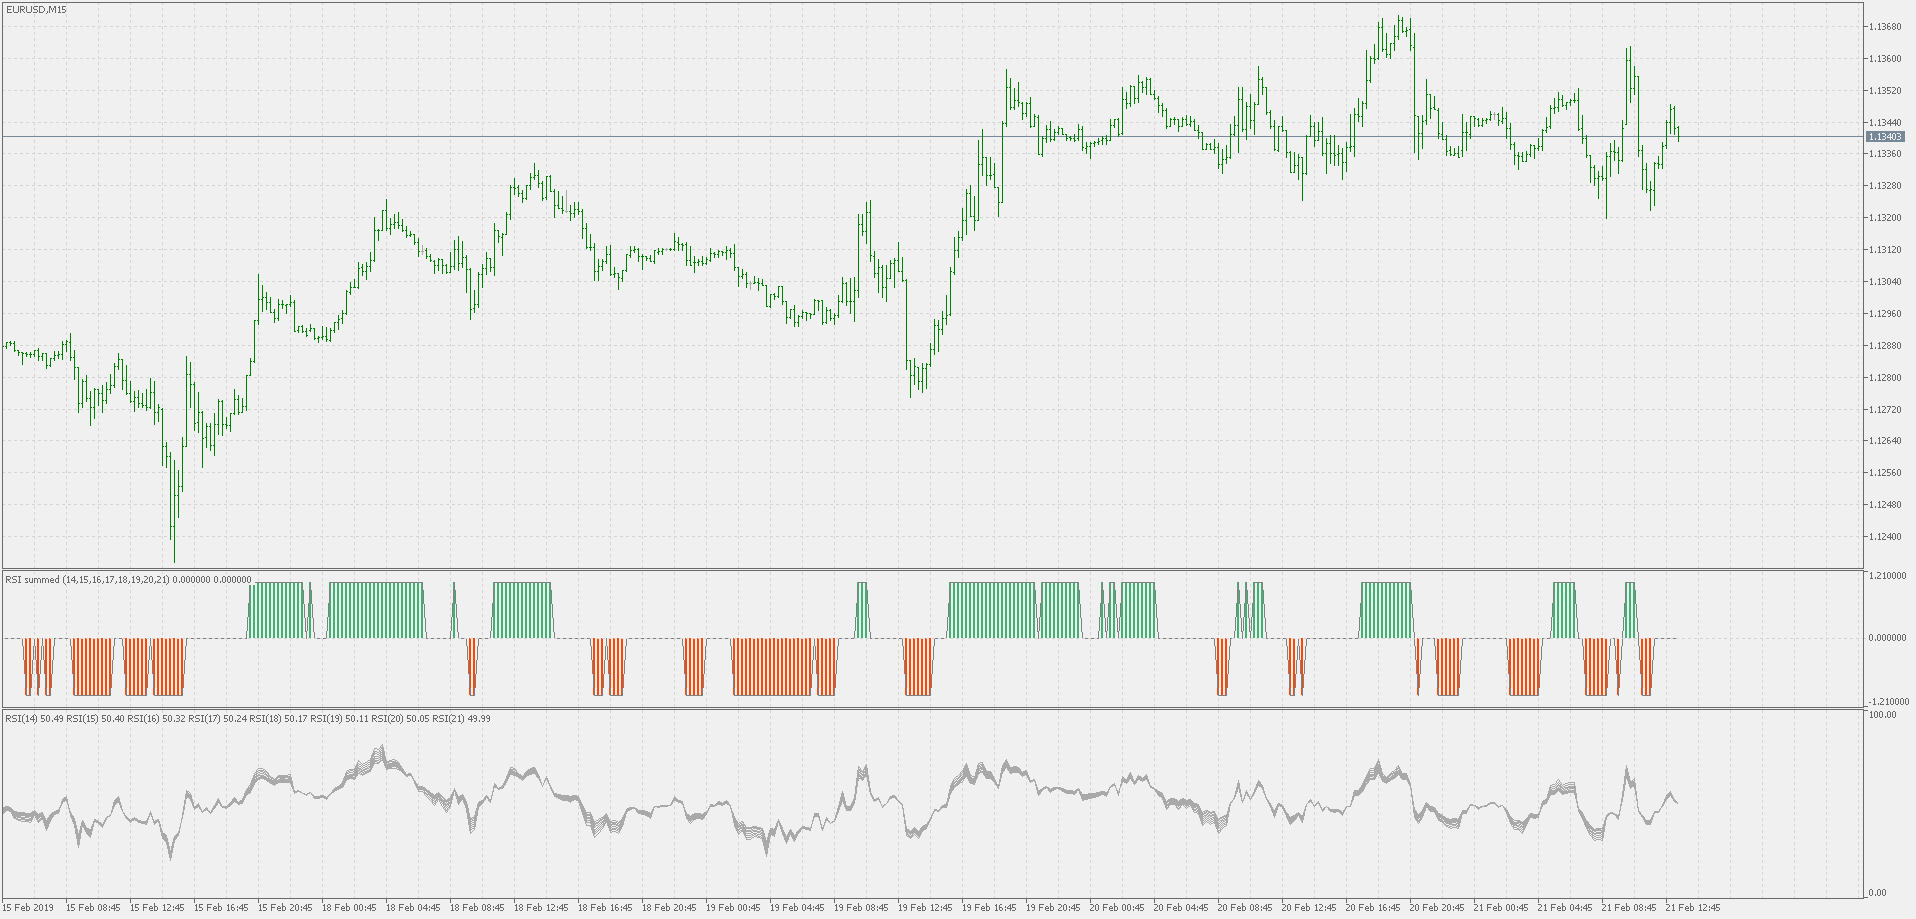
PS: example compared to the used RSIs
 Bollinger bands - squeeze
Bollinger bands - squeeze
Squeeze - on chart
Squeeze - on chart candles or bars
Normalized MACD - of averages
Normalized MACD of averages
Adaptive moving average - double smoothed
Adaptive moving average - double smoothed